Retirement Financing: An Optimal Reform Approach
Abstract
We study Pareto optimal policy reforms aimed at overhauling retirement financing as an integral part of the tax and transfer system. Our framework for policy analysis is a heterogeneous-agent overlapping-generations model that performs well in matching the aggregate and distributional features of the U.S. economy. We present a test of Pareto optimality that identifies the main source of inefficiency in the status quo policies. Our test suggests that lack of asset subsidies late in life is the main source of inefficiency when annuity markets are incomplete. We solve for Pareto optimal policy reforms and show that progressive asset subsidies provide a powerful tool for Pareto optimal reforms. On the other hand, earnings tax reforms do not always yield efficiency gains. We implement our Pareto optimal policy reform in an economy that features demographic change. The reform reduces the present discounted value of net resources consumed by each generation by about 7 to 11 percent in the steady state. These gains amount to a one-time lump-sum transfer to the initial generation equal to 10.5 percent of GDP.
1 Introduction
The government in the United States, and in many other developed countries, plays a crucial role in the provision of old-age consumption. In the United States, for example, a major fraction of the older population relies heavily on their Social Security income. Old-age benefits provided by the Social Security program are 40 percent of all income of older people. Moreover, these benefits are the main source of income for half of the older population.1 On the other hand, these programs are a major source of cost for governments. In the United States, Social Security payouts are 30 percent of total government outlays. The severity of these costs together with an aging population has made reforms in the retirement system a necessity.
Various reforms have been proposed to reduce the cost of these programs or raise revenue to fund them. Typically, these proposals only target reform of the payroll tax and old-age benefits. Moreover, with a few exceptions, they focus on gains to future generations and often ignore the impact of reforms on current generations (see our discussion of related literature in Section 1.1). While such reforms have their merit, they require interpersonal comparison of utilities and are not necessarily robust to the variety of the political arrangements through which these reforms are determined. Alternatively, one can consider Pareto improving reforms: reforms that improve everyone's welfare. It is thus important to know under what conditions Pareto improving policy reforms are feasible. Moreover, what policy instruments are essential in achieving such reforms, and how large are the efficiency gains arising from these reforms?
In this paper, we propose a theoretical and quantitative analysis of Pareto improving policy reforms which view payroll taxes, old-age benefits, etc. as part of a comprehensive fiscal policy. On the theory side, we expand on Werning (2007) and provide a test of Pareto optimality of a tax and transfer schedule in an overlapping-generations economy with many tax instruments (i.e., taxes on earnings and savings). We then use the theory to investigate the possibility of Pareto optimal reforms in a quantitative model consistent with aggregate and distributional features of the U.S. economy. Our main result is that earnings tax reforms are not always a major source of efficiency gains in a Pareto optimal reform, but asset subsidies play an essential role in producing efficiency gains.
We use an overlapping-generations framework in which individuals of each cohort are heterogeneous in their earning ability, mortality, and discount factor. We assume those with higher earning ability have lower mortality. This assumption is motivated by the empirical research that documents a negative correlation between lifetime income and mortality (see, e.g., Cristia (2009), Waldron (2013)). We also assume higher-ability individuals are more patient. The motivation for this assumption is the observed heterogeneity in savings rates across income groups (see, e.g., Dynan, Skinner, and Zeldes (2004)). This feature also allows us to match the distribution of wealth in our calibration. Finally, annuity markets are incomplete.2
Our goal is to characterize the set of Pareto optimal fiscal policies, that is, nonlinear earnings tax and transfers during working age, asset taxes, and Social Security benefits. The evaluation of fiscal policies is based on the allocations that they induce in a competitive equilibrium where economic agents face these policies. In particular, a sequence of fiscal policies is Pareto optimal if one cannot find another sequence of policies whose induced allocations deliver at least the same welfare to each type of individual in each generation at a lower resource cost.
In this environment, the key question is whether a Pareto optimal reform (henceforth “Pareto reform”) is feasible. We show that, absent dynamic inefficiencies, a Pareto reform is only possible when there are inefficiencies within each generation. In other words, determining whether a sequence of policies can be improved upon comes down to checking the same property within each generation. An important implication of this result is that Pareto improvements cannot be achieved by simply replacing distortionary tax policies. This is because in an economy with heterogeneity, distortionary taxes may be efficient, as they serve a purpose: they balance redistributive motives in a society with incentives. It is well known that the set of Pareto optimal nonlinear income taxes is potentially large.3 In other words, judgment about the Pareto optimality of a tax system is not possible by simply examining the tax rates.
In order to examine the optimality of a given tax and transfer system, we extend the analysis of Werning (2007) to our overlapping-generations economy and derive the criteria for optimality for each generation. A tax system is optimal if it satisfies two criteria, an inequality constraint for the earnings tax schedule and a tax-smoothing relationship between various taxes (between contemporaneous earnings and savings taxes and between savings taxes over time). The inequality test of earnings taxes is standard from Werning (2007), and it is equivalent to the existence of nonnegative Pareto weights on different individuals that rationalize the observed tax function. The novel prediction of our analysis is the tax-smoothing relationship between various taxes. Together, these conditions can be tested for any tax schedule, as we do in our quantitative exercise.
Our tests imply that optimality of the asset tax schedule is tied to the incompleteness in the annuity markets and to earnings taxes. In other words, if redistributive motives inherent in observed policies are captured in earnings taxes, then the tax-smoothing relationship ties the optimal level of asset taxes to these redistributive motives (earnings taxes). This condition implies that optimal asset taxes must have two components. First, they must have a subsidy component that captures the inefficiencies arising from incompleteness in annuity markets. More specifically, with incomplete annuity markets, a subsidy to savings can index asset returns to individual mortality rates and therefore complete the market. Second, optimal asset taxes must have a tax component that stems from the increasing demand for savings from more productive individuals above and beyond usual consumption-smoothing reasons. In effect, since more productive individuals have a higher valuation for consumption in the future (due to their lower mortality and higher discount factor), taxation of future consumption can relax redistributive motives by the government, which in turn leads to lower taxes on earnings. The nature and magnitude of optimal asset taxes is determined by the balance of these two effects.
With this theoretical characterization as a guide, we turn to a quantitative version of our model. Specifically, we calibrate our model economy to the status quo policies in the United States (income taxes, payroll taxes, and old-age transfers), aggregate measures of hours worked and capital stock, and the distribution of earnings and wealth. Our model can successfully match the key features of the U.S. data, particularly the cross-sectional distribution of earnings and wealth.
Using this quantitative model, we first apply our Pareto optimality test to assess the optimality of the status quo policies. Our tests show that these policies fail the efficiency test described above. While the earnings tax inequality is violated, this violation only occurs at the income levels close to the Social Security maximum earnings cap. In fact, since marginal tax rates fall around this cap, the tax is regressive and thus fails the inequality criterion. Beside this violation, earnings taxes pass our inequality test for all other earnings levels, and their deviation from optimality tests is small. On the other hand, our results show that the asset tax schedule violates our equality test at almost all ages and for all income levels. This suggests that savings tax (or subsidy) reforms—as opposed to earnings tax reforms—are a source of gains.
Next, we solve the problem of minimizing the cost of delivering the status quo welfare to each individual in each generation (i.e., the welfare associated with allocations induced by the status quo policies). The cost savings associated with this problem capture the potential efficiency gains in optimal reforms and identify the main elements of a Pareto optimal reform. This exercise confirms the results of the test: earnings taxes barely change compared to the status quo, while asset taxes are negative and progressive; that is, assets must be subsidized and asset-poor individuals must face a higher subsidy rate than asset-rich individuals.
That assets must be subsidized shows that the incompleteness in the annuity markets is the primary source of welfare gains. In addition, it shows that heterogeneity in mortality and discount rates play a secondary role in determining asset taxes. Furthermore, since, in our model, poorer individuals have a higher mortality rate, they must face a higher subsidy in order for the return on their savings to be indexed to their mortality. This effect leads to progressive subsidies.
We conduct our quantitative exercises in two forms. First, we consider the steady state of an economy with currently observed U.S. demographics. This exercise shows that asset subsidies could be significant. In particular, the average subsidy rate post-retirement is 5 percent. Overall, implementing optimal policies reduces the present value of net resources used by each cohort by 11 percent. This is equivalent to a 0.82 percent reduction in the status quo consumption of all individuals, keeping their welfare unchanged.4
Second, we consider an aging economy that experiences a fall in population growth and mortality (as projected by the U.S. Census Bureau). In this economy, and along the demographic transition, we solve for Pareto optimal reform policies that do not lower the welfare of any individual in any birth cohort relative to the continuation of status quo. Our numerical results concerning the transition economy confirm our main findings: asset subsidies are significant and crucial in generating efficiency gains. However, the gains for each birth cohort are smaller relative to the previous exercise. The present discount value of net resources used by each cohort in the new steady state falls by about 7 percent. We distribute all the gains along the transition path to the initial generations in a lump-sum fashion. This amounts to a one-time lump-sum transfer of about 10.5 percent of current U.S. GDP.
In order to highlight the importance of asset subsidies, we conduct another quantitative exercise in which we restrict reforms to policies that do not include asset subsidies and old-age transfers. In a sense, this is the best that can be achieved by phasing out retirement benefits and reforming payroll taxes. We find that these policies do not improve efficiency. In other words, they deliver the status quo welfare at a higher resource cost than the status quo policies. Finally, we also check the robustness of our results to the inclusion of other saving motives, namely, presence of out-of-pocket medical expenditure late in life (as emphasized by the seminal work of De Nardi, French, and Jones (2010)) and warm-glow bequests. Our quantitative exercises illustrate that our main findings are robust to these changes.
Asset subsidies are central to our proposed optimal policy. These subsidies resemble some of the features of the U.S. tax code and retirement system. Tax breaks for home ownership, retirement accounts (eligible IRAs, 401(k), 403(b), etc.), and subsidies for small business development are a few examples of such programs, whose estimated cost was $367 billion in 2005 (about 2.8 percent of GDP). Moreover, these programs mostly benefit higher-income individuals.5 One view of our proposed optimal policy is to extend and expand such policies to include broader asset categories and, more importantly, continue during the retirement period. Our result also highlights the need for progressivity in these subsidies, contrary to the current observed outcome. An important feature of the U.S. tax code is that it penalizes the accumulation of assets in tax-deferred accounts beyond the age of 70 and a half. Our analysis implies that these features are at odds with the optimal policy prescribed by our model and their removal can potentially yield significant efficiency gains.
1.1 Related Literature
Our paper contributes to various strands in the literature on policy reform. We contribute to the large and growing literature on retirement financing, most of which studies the implications of a specific set of policy proposals. For example, Nishiyama and Smetters (2007) studied the effect of privatization of Social Security. Kitao (2014) compared different combinations of tax increase and benefit cuts within the current Social Security system. McGrattan and Prescott (2017) proposed phasing out Social Security and Medicare benefits and removing payroll taxes. Blandin (2018) studied the effect of eliminating the Social Security maximum earnings cap.
We depart from the existing literature in two important aspects. First, we do not restrict the set of policies at the outset. Therefore, our results can inform us about which policy instrument is an essential part of a reform. As a result, we find that changing the marginal tax rates on labor earnings is not a major contributor to an optimal policy reform. Second, we focus explicitly on Pareto optimal policies and derive the condition that can inform us about the feasibility of Pareto improving policy reforms. In that regard, our paper is close to Conesa and Garriga (2008), who characterized a Pareto optimal reform in an economy without heterogeneity within each cohort and found Pareto optimal linear taxes (a Ramsey exercise).
Our paper is also related to a large literature on optimal policy design. The common approach in this literature is to take a stand on specific social welfare criteria and find optimal policies that maximize social welfare. For example, Conesa and Krueger (2006) and Heathcote, Storesletten, and Violante (2017) studied the optimal progressivity of a tax formula for a parametric set of tax functions, while Huggett and Parra (2010) and Heathcote and Tsujiyama (2015) did the same using a Mirrleesian approach that does not impose a parametric restriction on policy instruments (similar to our paper). One drawback of this approach is that it relies on the choice of the social welfare function. Consequently, the resulting policy proposals can improve efficiency while at the same time provide redistribution across individuals.6 Moreover, the resulting policies are conditional on a particular welfare function which might or might not be conforming to the political institutions that are determinants of government policies in a certain country. The benefit of our approach is that it does not rely on an arbitrary welfare function by providing nonnegative gains to all individuals. To the best of our knowledge, this is the first paper that proposes this approach to optimal policy reform in a dynamic quantitative setting.7
Our paper also contributes to the literature on dynamic optimal taxation over the life cycle. Similarly to Weinzierl (2011), Golosov, Troshkin, and Tsyvinski (2016), and Farhi and Werning (2013b), we provide analytical expressions for distortions and summarize insights from those expressions. However, unlike these cited works, which focus on labor distortions over the life cycle, we focus on intertemporal distortions. Furthermore, we emphasize the role of policy during the retirement period, thus relating our work to Golosov and Tsyvinski (2006), who studied the optimal design of the disability insurance system, and Shourideh and Troshkin (2017) and Ndiaye (2018), who focused on an optimal tax system that provides incentive for an efficient retirement age.
Another strand of literature our paper is related to studies the role of Social Security in providing longevity insurance. Hubbard and Judd (1987), İmrohoroǧlu, İmrohoroǧlu, and Joines (1995), Hong and Ríos-Rull (2007), and Hosseini (2015) (among many others) have examined the welfare-enhancing role of providing an annuity income through Social Security when the private annuity insurance market has imperfections. Caliendo, Guo, and Hosseini (2014) pointed out that the welfare-enhancing role of Social Security in providing annuitization is limited because Social Security does not affect individuals' intertemporal trade-offs. In this paper, we pinpoint the optimal distortions and policies that address this shortcoming in the system by emphasizing that any optimal retirement system (whether public, private, or mixed) must include features that affect individuals' intertemporal decisions on the margin. In our proposed implementation, those features take the form of a nonlinear subsidy on assets.
Finally, our paper is related to the literature on the observed lack of annuitization in the United States. Friedman and Warshawsky (1990) showed that if one is to consider the high fees (what they referred to as “load factor”) on annuities provided in the market together with adverse selection, the standard model without bequest motives can go a long way in explaining the lack of annuitization. Diamond (2004) and Mitchell, Poterba, Warshawsky, and Brown (1999) pointed to taxes on insurance companies as well as high overhead costs (marketing and administrative costs as well as other corporate overhead) behind the high transaction costs. In particular, observing that the government cost of handling Social Security is much lower, Diamond (2004) suggested government-provided annuities—a task that our saving subsidies achieve. Our paper can be thought of as a quantitative evaluation of this idea in reforming the retirement benefit system in the United States.
The rest of the paper is organized as follows: Section 2 lays out a two-period OLG framework where we provide intuition for our results; in Section 3, we describe the benchmark model used in our quantitative exercise; in Section 4, we calibrate the model; in Section 5, we discuss our quantitative results in steady state; in Section 6, we discuss reforms in an aging economy; in Section 7, we study various robustness exercises; and in Section 8, we present our conclusions.
2 Pareto Optimal Policy Reforms: A Basic Framework
In this section, we use a basic framework to provide a theoretical analysis of Pareto optimal policy reforms. In particular, we extend the static analysis in Werning (2007) to a dynamic OLG economy in order to characterize the determinants of a Pareto optimal policy reform.
 . There is a continuum of individuals born in each period. Each individual lives for at most two periods. Upon birth, each individual draws a type
  from a continuous distribution
  that has density
  . This type determines various characteristics of the individual such as labor productivity, mortality risk, and discount rate. We assume that an individual's preferences are represented by the following utility function over bundles of consumption and hours worked,
  :
:

 is the discount factor,
  is the survival probability, θ is labor productivity,
  is strictly concave, and
  is strictly convex. For simplicity, we assume that
  , where ℓ is hours worked.
Production is done using labor and capital, with the production function given by  , where K is capital and L is total effective labor; for ease of notation,
  here is taken to be NDP (net domestic product). In addition, population grows at rate n, and
  is total population at t.


 is the net return on investment after depreciation, while
  is the average wage rate in the economy. Note that in the above equations, we have allowed the second period taxes,
  , to depend on wealth and earnings, which can potentially capture a redistributive and history-dependent Social Security benefit formula together with taxes on assets. In addition, we have imposed incomplete annuity markets. In particular, the price of assets purchased when individuals are young is the same for all individuals and normalized to 1, even though individuals could be heterogeneous in their survival probability. This assumption is consistent with the observation that private annuity markets in the United States are very small.8 Finally, we assume that upon the death of an individual, his or her non-annuitized asset is collected by the government.
 together with
  and
and  , where subscript t represents the period in which the individual is born, total
  is capital in period t, and
  is total effective hours. Such allocation is feasible if it satisfies the usual market clearing conditions:

 . For a given set of taxes and initial stock of physical capital, we refer to the profile of utilities that arise in equilibrium as induced by policies
  ,
,  .
.In this context, for a given policy  ,
,  and its induced welfare profile,
  , a Pareto reform is a sequence of policies
  ,
,  whose induced welfare,
  , satisfies
  with strict inequality for a positive measure of θ's and some t. Notice that in our definition of Pareto reforms, we allowed for policies to be time-dependent in order to have flexibility in the reforms. A pair of policies is thus said to be Pareto optimal if a Pareto reform does not exist.
The following proposition shows our first result about the existence of Pareto optimal reforms:
Proposition 1. (Diamond)Consider an allocation  induced by a pair of policies
  ,
,  . Suppose that
  for some positive γ; then the pair
  and
and  is Pareto optimal if and only if, for all
  ,
,
 (P)
(P) (1)
(1) (2)
(2)The proof can be found in the 8.
The above proposition is an extension of the results in Diamond (1965) to an environment with heterogeneity and second best policies. It states that when the economy is dynamically efficient,  , then the possibility of a Pareto optimal reform depends on whether tax and transfer schemes exhibit inefficiencies within some generation. To the extent that dynamic efficiency seems to be the case in the data, the only possible Pareto optimal reforms can come from within-generation inefficiencies.9 In other words, the Pareto reform problem can be separated across generations and comes down to finding inefficiencies of policies within each generation. Note that a usual asymmetric information assumption is imposed on allocations, to reflect that not all tax policies are feasible. In particular, tax policies that directly depend on individuals' characteristics (e.g., ability types and mortality) are not available. As is well-known from the public finance literature, the set of Pareto efficient tax functions is potentially large.10 This implies that distortionary taxes (payroll, earnings, etc.) cannot necessarily be removed, since they could satisfy the condition in Proposition 1.
Proposition 1 and the above discussion highlight the main task at hand in finding Pareto optimal reforms: we have to characterize tax schedules,  and
and  , that solve problem (P). This is similar to the standard Pareto optimal tax problem as studied by Werning (2007) for a static economy. The difference compared to Werning's model is that the government has access to multiple instruments (i.e., tax on earnings and assets). As we establish, the fact that the government has access to multiple instruments introduces new restrictions on optimal taxes. The key implication is that Pareto optimal taxes must satisfy the following property: distortions along different margins adjusted by elasticities must be equated for all individuals of the same type. This result is akin to smoothing of distortions along different margins. The following proposition presents this result:
Proposition 2.Consider a pair of policies  and
and  and suppose that it induces an allocation without bunching, that is,
  and
and  are one-to-one functions of θ. Then the pair
  ,
,  is Pareto optimal only if it satisfies
 (3)
(3) and
and  are the wedges induced by the tax schedule; and

The proof can be found in the 8.
Equation (3) is the main dynamic implication of the test of Pareto optimality. It states that distortions to labor and assets margin must comove, holding other things constant. In other words, given any profile of labor taxes, which is determined by the profile of Pareto weights, the asset tax profile is determined by (3). Note that in (3),  is the increase in government's revenue per person from a unit increase in assets of workers of type θ, 11 while
  is the same thing except for earnings. As we describe below, equation (3) states that the behavioral increase12 in government's revenue from a small increase in asset taxes for individuals of type θ must be equal to that of earnings taxes. In this sense, this result states that with two nonlinear taxes, the distortions adjusted by behavioral responses must be equated across the two schedules.
 . In this formulation, there is no income effect and, therefore, the calculation of individual responses to tax perturbations is simpler. In Appendix B.2, we show how this analysis works in a model with income effect. Starting with the tax function
  and
and  ,13 consider the following perturbation of any tax schedule:

 increases by
  , while the marginal asset tax rate for the bracket
  decreases by dτ, where dτ and δ are two small positive numbers. Note that for all types with assets higher than
  and earnings higher than
  , this perturbation leaves their welfare, income, and marginal taxes unchanged. This is because for these types, the change in tax on earnings cancels out that of the tax on assets. As for types close to θ, since only their marginal tax changes (taxes paid on their last earned unit of earnings and assets), their welfare change is second order. By the envelope theorem, the change in welfare for them is proportional to the size of the tax change, and the measure of people affected is also small. This implies that the above tax perturbation is feasible, up to a possible second-order violation of the participation constraint (2); the utility of individuals close to θ changes by a small amount which leads to a second-order change in welfare. Therefore, at the optimum, it should not raise government revenue. Note that the same holds for the reverse of this perturbation and, as a result, at the optimum the perturbation should keep government revenue unchanged.
 is the behavioral response of earnings to an earnings tax increase of magnitude dτ, and
  is the response of assets to an increase in asset tax of magnitude dτ. Moreover,
  is the measure of individuals whose marginal earnings taxes increase, while
  is the measure of individuals whose marginal asset taxes decrease.14 Some algebra, deferred to Appendix B, shows that the above equation becomes (3).
This discussion highlights the key implication of Pareto optimality in dynamic environments where the government can impose multiple nonlinear taxes along different margins. As we have argued, small offsetting perturbations of nonlinear taxes preserve Pareto optimality, up to a second-order effect on people whose marginal taxes are perturbed. Since these perturbations have offsetting mechanical effects, it must be that their behavioral effect on government's revenue must be equated. This equalization of the behavioral response across different instruments can be thought of as sort of a tax smoothing. As we show in Section 3.5, in an extended version of this model the same results hold. Moreover, as our quantitative analysis establishes, the failure of this test of Pareto optimality is significant for status quo U.S. policies and leads to the main source of efficiency gains in Pareto optimal reforms.
 (4)
(4) , captures the inefficiencies arising from the incompleteness of annuity markets. This reflects the fact that in the absence of annuities, a subsidy to savings can provide annuity returns and thus complete the market. We should note that even absent any heterogeneity, the market incompleteness assumption implies that
  is nonzero and equal to
  , where P is the probability of survival.
The second component is more subtle and stems from the increasing demand for savings from more productive individuals above and beyond usual consumption-smoothing reasons. In effect, since more productive individuals have a higher valuation for consumption in the second period (they have a higher discount factor and a higher survival rate), taxation of second-period consumption can relax redistributive motives by the government, which in turn leads to lower taxes on earnings.15 Note that when  and
and  , our model becomes the model studied by Atkinson and Stiglitz (1976) and, as a result, the above formula becomes
  ; that is, savings taxes should be zero.
We should note a subtle point about forces towards progressivity of savings tax or subsidies in our setup. When income and mortality are positively correlated, that is,  , the market incompleteness component,
  , is negative and increases with θ. In other words, workers with lower productivity face a higher subsidy. This can be interpreted as a progressive subsidy on savings. This force towards “progressivity” in the subsidy on savings is independent of government's redistributive motive and purely comes from efficiency reasons. As an example, suppose that there is no government expenditure and government does not care about redistribution at all. In this case, the optimal labor income taxes are zero;
  , yet saving subsidies are progressive.
In addition to the above, a Pareto optimal tax system must also satisfy another condition that is equivalent to the existence of Pareto weights. That is, for any Pareto optimal tax schedule, nonnegative Pareto weights on individuals must exist so that the tax functions maximize the value of a weighted average of the utility of individuals. As shown by Werning (2007), the existence of such Pareto weights is equivalent to inequalities in terms of taxes, distribution of productivities, and labor supply elasticities. This inequality must also be satisfied in our model:
Proposition 3.A pair of policies  and
and  is efficient only if it satisfies the following relationships:
 (5)
(5)In addition, if optimal allocations under the tax functions are fully characterized by an individual's first-order conditions, then (3) and (5) are sufficient for efficiency.
The proof is relegated to the 8.
The above formula implies that a tax schedule is more likely to be negative (1) the higher is the rate of change in the skill distribution, (2) the higher is the slope of the marginal tax rate, (3) the stronger is the income effect, and (4) the lower is the Frisch elasticity of labor supply. These forces can be identified in (5). An important observation is that when taxes become regressive, that is,  , a Pareto improving reform is more likely.16
Our analysis here points towards the key properties that can, in principle, provide sources of gain for Pareto optimal reforms. Note that given the generality of our result, our analysis will apply whether transitional issues in policies are considered or not. In other words, either taxes are inefficient, in which case one can always find a rearrangement of resources across generations and find a possible Pareto improvement, or taxes are efficient, in which case it is impossible to find such an improvement.
In what follows, we develop a quantitative model that does fairly well in matching basic moments of consumption, earnings, and wealth distribution. We will use this model to test for potential inefficiencies and compute the magnitude of cost savings that Pareto optimal reforms can provide.
3 The Model
In this section, we develop a heterogeneous-agent overlapping-generations model that extends the ideas discussed in Section 2 and is suitable for our quantitative policy analysis. Our description of the policy instruments is general and includes the current U.S. status quo policies as a special case. The model is rich enough and is calibrated in Section 4 to match U.S. aggregate data and cross-sectional observations on earnings and asset distribution. In Section 3.5, we show how this model can be used to derive Pareto optimal policies.
3.1 Demographics, Preferences, and Technology
Time is discrete, and the economy is populated by  overlapping generations. A cohort of individuals is born in each period
  . The number of newborns grows at rate
  . Upon birth, each individual draws a type
  from a continuous distribution
  that has density
  . This parameter determines three main characteristics of an individual: life-cycle labor productivity profile, survival rate profile, and discount factor. In particular, an individual of type θ has a labor productivity of
  at age j. We assume that
  and thus refer to individuals with a higher value of θ as more productive. Everyone retires at age R, and
  for
for  .
.
 (this is the probability of being alive at age
  , conditional on being alive at age j).17 Nobody survives beyond age J (with
  for all θ and t). As a result, the survival probability at age j for those who are born in period t is

 . Thus, that individual's preferences over streams of consumption and hours worked are given by
 (6)
(6) and
and  are consumption and hours worked for an individual of θ at j who is born in period t.
 . In this formulation,
  is aggregate per capita stock of capital, and
  is the aggregate effective units of labor per capita. Effective labor is defined as labor productivity,
  , multiplied by hours,
  . Its aggregate value is the sum of the units of effective labor across all individuals alive in each period. In other words,

 is the share of type θ of age j in the population in period t. Finally, capital depreciates at rate δ. Therefore, the return on capital net of depreciation is
  .
.3.2 Markets and Government
We assume that individuals supply labor in the labor market and earn a wage  per unit of effective labor. In addition, individuals have access to a risk-free asset and cannot borrow. The assets of the deceased in each period t convert to bequests and are distributed equally among the living population in period t.18 Our main assumption here is that annuity markets do not exist. As discussed in Section 2, this assumption is in line with the observed low volume of trade in annuity markets in the United States and other countries.19
The government uses nonlinear taxes on earnings from supplying labor, including the Social Security tax, while we assume that there is a linear tax on capital income and consumption. The revenue from taxation is then used to finance transfers to workers and Social Security payments to retirees. While transfers are assumed to be equal for all individuals, Social Security benefits are not and depend on individuals' lifetime income.
 (7)
(7)
 is the rate of return on assets
  ;
;  and
and  are the earnings tax and asset tax functions, respectively;
  are transfers to working individuals;
  is the retirement benefit from the government; and
  is the income earned from bequests. The dependence of retirement benefits on lifetime earnings is captured by
  , which is given by

There is a corporate tax rate  paid by producers. Therefore, the return on assets,
  , is equal to
  .21 We assume that the government taxes households' holding of government debt at an equal rate and, therefore, the interest paid on government debt is also
  .
.
 (8)
(8) is per capita government purchases,
  is per capita government debt, and
  is population growth rate at t, which can be calculated as a function of mortality rates and
  . Finally, goods and asset market clearing implies
 (9)
(9) (10)
(10) (11)
(11)3.3 Equilibrium
The equilibrium of this economy is defined as allocations where individuals maximize (6) subject to (7), while the government budget constraint (8), market clearings (9), (10), and (11) must hold. The equilibrium is stationary (or in steady state) when all policy functions, demographics parameters, allocations, and prices are independent of calendar period t.
This sums up our description of the economy. In the next section, we describe our approach to analyzing an optimal reform within the framework specified above. Note that we have not specified any details of the status quo policies yet. We will do that in Section 4 where we impose detailed parametric specifications of the U.S. tax and Social Security policies and calibrate this model to the U.S. data. We can then apply our optimal reform approach to the calibrated model and conduct our optimal reform exercise.
When the tax function and Social Security benefits are calibrated to those for the United States, we refer to the resulting equilibrium allocations and welfare as status quo allocations and welfare. We refer to the status quo welfare of an individual of type θ who is born in period t by  .
.
3.4 Remark on Annuity Markets
Throughout the analysis in this paper, we assume that there are no markets for annuities. This is in line with the observed lack of annuitization in the United States. As Poterba (2001), Benartzi, Previtero, and Thaler (2011), and many others have mentioned, the annuity market in the United States is very small. According to Hosseini (2015)'s calculation based on HRS, only 5 percent of the elderly hold private annuities in their portfolio.22 Moreover, the offered annuities have very high transaction costs and low yields (see Friedman and Warshawsky (1990) and Mitchell et al. (1999)), and are not effectively used by individuals (see Brown and Poterba (2006)).23
Various reasons have been proposed as leading to lack of annuitization in the United States: the presence of Social Security as an imperfect substitute, adverse selection in the annuity market, low yields on offered annuities due to overhead and other costs, bequest motives, and complexity of choice faced by individuals (see Benartzi, Previtero, and Thaler (2011) and Diamond (2004)). All of these reasons warrant government intervention in annuity markets. In our paper, we have focused on the extreme case where the government fully takes over the annuity market. This role for the government was also discussed in detail by Diamond (2004). It would be interesting to study the case where annuity markets are present and government intervention crowds out the private market. This, however, is beyond the scope of our paper.
3.5 Optimal Policy Reform in the Quantitative Framework
Our optimal policy-reform exercise is very similar to the one in the two-period model provided in Section 2. It builds on the positive description of the economy in Section 3. In particular, we use the distribution of welfare implied by the model in Section 3 and consider a planning problem that chooses policies in order to minimize the cost of delivering this distribution of welfare, the status quo utility profile  , to a particular representative cohort of individuals. We show how the efficiency tests discussed in Section 2 extend to the dynamic environment. For simplicity, we assume steady state and do not consider the changes in prices resulting from the reforms. Later, in our quantitative exercise, we allow for both transitions and changes in prices.
3.5.1 A Planning Problem
The set of policies that we allow for in our optimal reform are very similar to those described in Section 3. In particular, we allow for nonlinear and age-dependent taxation of assets. Moreover, we allow for nonlinear and age-dependent taxation of earnings together with flat Social Security benefits (i.e., Social Security benefits are independent of lifetime earnings). Therefore, given any tax and benefit structure, each individual maximizes utility (6) subject to the budget constraints (7).
The planning problem associated with the optimal reform finds the policies described above to maximize the net revenue for the government (i.e., present value of receipts net of expenses). In this maximization, the government is constrained by the optimizing behavior by individuals—as described above, the feasibility of allocations and the requirement that each individual's utility must be above  . We also focus on the steady-state problem for the government and ignore issues related to transition.
 (P1)
(P1) (12)
(12) (13)
(13) (14)
(14)3.5.2 Test of Pareto Optimality
 (15)
(15)The following proposition presents tests of Pareto optimality for the quantitative framework developed above:
Proposition 4.The wedges induced by any Pareto optimal tax schedule must satisfy the following equality constraints:
 (16)
(16) (17)
(17) (18)
(18) is the intertemporal elasticity of substitution at age 0.
Moreover, when the first-order conditions are sufficient for describing the behavior of consumers, the above conditions are also sufficient for any Pareto optimal tax schedule.26
The above formulas are the equivalents of the optimality formulas in Section 2. In particular, as it might be apparent, equations (16) and (17) are the equivalents of the tax-smoothing relationship (3).

Similarly, equation (17) states that the behavioral increase in government revenue must be equated for an increase in taxes at age j and age  . Note that since these tax perturbations are done in two different ages, in order for them to be welfare neutral, the magnitude of the perturbations must be adjusted. The last term in (17) performs this age adjustment; by definition of the savings wedge,
  . In other words, the age adjustment is equal to the ratio of marginal utilities of consumption adjusted by the interest rate. Finally, as before, inequality (18) is equivalent to the nonnegativity of the implied Pareto weights.
Equation (17) is informative about the behavior of savings wedges—marginal tax rates—over time. Specifically, it highlights the role of the changes in the gradient of the survival over the life cycle, that is,  . An increase in this gradient with age leads to a decline in subsidies or increase in taxes on savings. This goes back to a mechanism that we have already discussed in Section 2: a higher gradient of survival leads to a higher value of consumption late in life and higher demand for saving. Taxation of savings is then a way to prevent productive individuals from earning less and saving less and, as a result, reducing the deadweight loss of taxation of earnings. From an alternative perspective, when the gradient of survival is high, saving increases quickly with productivity, which in turn reduces the density of number of workers at a certain asset level. Hence, the tax-smoothing intuition in Section 2 would imply that taxes (subsidies) must be higher (lower). As we show in our quantitative exercise, the gradient of survival is positive and increases with age. This would imply that subsidies become more progressive as individuals age.
 (19)
(19)Finally, note that whether the above tests are satisfied determines the Pareto optimality of a tax system. Away from the optimum, that is, when these conditions are violated, in general it is difficult to determine what margins must be adjusted. In our numerical simulations, however, often the magnitude of the violation is indicative of the significance of the reform. In other words, when the above conditions are violated significantly, the gains from a reform in the associated policies are significant. In what follows, we show that the main source of violation is the equations associated with savings wedges and, thus, they are the main source of gains.
3.5.3 Optimal Taxes
So far, we have mainly focused on optimal allocations and wedges. It is possible to construct taxes whose marginals coincide with the wedges described above. In the Supplemental Material (Hosseini and Shourideh (2019)), we provide a monotonicity condition which, if satisfied, implies the existence of tax functions that implement the efficient allocation. This monotonicity condition is a condition on allocations that result from the planning problem. While we have no way of theoretically checking that the monotonicity conditions are satisfied, our numerical simulations always involve a check that ensures that they are. Needless to say, in all our simulations, the monotonicity constraints are satisfied.
Furthermore, while in most of our analysis we focus on taxes on savings and earnings, it is possible to think about alternative implementations of efficient allocations. For example, another implementation of efficient allocations is via earnings taxes and Social Security benefit formulas that are indexed to income as well as assets. If the goal is to provide a progressive asset subsidy, this indexation must occur so that an increase in households' saving increases their retirement benefit, while this indexation must be progressive, that is, it must be higher for workers with lower income and assets. For an asset tax, the implication is similar.27 An alternative way of implementing this policy is to use a personalized nonlinear consumption tax that varies with age. A declining (increasing) consumption tax can then replicate the saving subsidies (taxes).
4 Calibration
In this section, we calibrate the model described in Section 3 by choosing parametric specifications and parameter values. We will estimate some of the parameters independently (e.g., wage/productivity profiles or mortality profiles), and we choose the rest of the parameters (e.g., discount factor) so that the model matches targets from the U.S. data.
4.1 Earning Ability Profiles
 at age j can be written as

 is an age-dependent productivity shifter given by

 . We calculate this as the ratio of all reported labor earnings to total reported hours. For labor earnings, we use the sum over a list of variables on salaries and wages, separate bonuses, the labor portion of business income, overtime pay, tips, commissions, professional practice or trade payments, and other miscellaneous labor income converted to constant 2000 dollars. In order to avoid well-known issues in the raw data, we use Heathcote, Perri, and Violante's (2010) version of the PSID data. The resulting estimated parameters are
  ,
,  ,
,  , and
, and  .
.Moreover, we assume the type-dependent fixed effect θ has a Pareto-lognormal distribution with parameters  . This distribution approximates a lognormal distribution with parameters
  and
and  at low incomes and a Pareto distribution with parameter
  at high values. It therefore allows for a heavy right tail at the top of the ability and earnings distribution. For this reason, it is commonly used in the literature (see Golosov, Troshkin, and Tsyvinski (2016), Badel and Huggett (2014), and Heathcote and Tsujiyama (2015)).28 We choose the tail parameter and variance parameter to be
  and
and  , respectively. The location parameter is set to
  so that
  has mean 0. With these parameters, the cross-section variance of log hourly wages in the model is 0.36. Also, the ratio of median hourly wages to the bottom decile of hourly wages is 2.3. These statistics are consistent with the reported facts on the cross-section distribution of hourly wages in Heathcote, Perri, and Violante (2010).
4.2 Demographics and Mortality Profiles
 is constant and is equal to 1 percent. The model period is 1 year. Individuals start earning income at age 25, they all retire at age 65, and nobody survives beyond 100 years of age. Each individual has a Gompertz force of mortality
 (20)
(20)The Gompertz distribution is widely used in the actuarial literature (see, e.g., Horiuchi and Coale (1982)) and economics (see, for example, Einav, Finkelstein, and Schrimpf (2010)). The second term in equation (20) determines the changes in mortality by age and is common across all types. The first term is decreasing in θ and determines the gradient of mortality in the cross section. Therefore, a higher-ability person has a lower mortality at all ages. The key parameter is  , which determines how mortality varies with ability. To choose this parameter, we use data on the male mortality rate across lifetime earnings deciles reported in Waldron (2013). She used Social Security Administration data to estimate mortality differentials at ages 67–71 by lifetime earnings deciles. Table I shows the estimated annual mortality rates for 67- to 71-year-old males born in 1940.29 This piece of evidence points to large differences in death rates across different income groups, with the poorest deciles almost four times more likely to die than the richest decile. We use these data to calibrate parameter
  .
.
|
Lifetime Earnings Decilesa |
||||||||||
|---|---|---|---|---|---|---|---|---|---|---|
|
1st |
2nd |
3rd |
4th |
5th |
6th |
7th |
8th |
9th |
10th |
|
|
Deaths (per 10,000) |
369 |
307 |
286 |
205 |
204 |
211 |
204 |
167 |
142 |
97 |
Parameter  is chosen to match the average survival probability from cohort life tables for the Social Security area by year of birth and sex for males of the 1940 birth cohort (Table 7 in Bell and Miller (2005)). Finally,
  is chosen so that mortality at age 25 is 0. The parameters that give the best fit to the mortality data in Table I and average mortality data are
  ,
,  , and
, and  . Figure 1 shows the fit of the model in terms of matching mortality across the lifetime earnings deciles in Waldron (2013). Once we have the mortality hazard
  , we can find the survival probability
  .
.

Using this parameterization, we find there are 4 workers per each retiree in the steady state. This is consistent with U.S. Census Bureau estimates.30
4.3 Preferences and Technology
We assume a constant relative risk aversion over consumption,  , and constant Frisch elasticity for disutility over hours worked,
  . The risk aversion parameter is
  , and the elasticity of labor supply is
  . The weight of leisure in utility ψ is chosen so that, in the model, the average number of annual hours worked is 2000.

 to match a capital to output ratio of 4.31 The other parameter,
  , determines the degree of heterogeneity in the discount factor. The larger is
  , the larger is the dispersion in the discount factor across ability types. We choose this parameter to match the wealth Gini index of 0.78 based on the 2007 Survey of Consumer Finances (SCF).
The aggregate production function is Cobb–Douglas with a capital share parameter  , and the depreciation rate is
  . These are chosen to match the average ratio of capital income and investment relative to GDP in the United States over the period 2000–2010.
4.4 Social Security
Social Security taxes are levied on labor earnings, up to a maximum taxable, as in the actual U.S. system. Benefits are paid as a nonlinear function of the average taxable earnings over lifetime.32 Let e be labor earnings and  be maximum taxable earnings. We set
  equal to 2.47 times the average earnings in the economy,
  . The Social Security tax rate is
  .33 There is also a Medicare tax rate,
  , which applies to the entire earnings.
 ). We use the same benefit formula that the U.S. Social Security Administration uses to determine the primary insurance amount (PIA) for retirees:

To account for Medicare benefits, we assume each individual in retirement will receive an additional transfer independent of that individual's earnings history. We choose this value so that the aggregate Medicare benefits are 3 percent of GDP.34
4.5 Income Taxes and Government Purchases

 , in which
  is labor earnings and
  is the Social Security and Medicare payroll taxes that the worker pays. The second term reflects the effective tax credit individuals get for the portion of Social Security tax paid by their employers. We assume retirement benefits are not taxed.
The tax function of this form is extensively used to approximate the effective income taxes in the United States. The parameter τ determines the progressivity of the tax function, while λ determines the level (the lower λ is, the higher are the total tax revenues for a given τ). Heathcote, Storesletten, and Violante (2017) estimated a value of 0.151 for τ, based on PSID income data and income tax calculations using NBER's TAXSIM program. We use their estimated value for τ and choose λ. We refer to this tax function as HSV tax function. The left panel in Figure 2 illustrates the resulting marginal and average taxes as functions of annual earnings in constant 2000 dollars.

Tax functions. The left panel is the calibrated HSV tax function,  . The right panel is the effective tax function (including HSV tax, payroll tax, and transfers). The discontinuity is due to the Social Security cap on taxable earnings.
Finally, we assume the government debt is 47 percent of GDP.36 The transfers  are chosen such that the government budget constraint (equation (8)) is satisfied in stationary equilibrium.
To summarize, individuals pay three different types of taxes on their earnings: HSV nonlinear tax, Social Security payroll tax (subject to a maximum taxable cap), and Medicare tax. In addition, they receive the transfer  prior to retirement. The right panel in Figure 2 shows the resulting marginal and average tax on the sum of all these taxes and transfers. The discontinuity in the marginal tax is due to Social Security's maximum taxable earnings cap. In addition to earnings taxes, we assume that there is a proportional tax on consumption. This tax allows us to match the government's balance sheet. In particular, part of the government's revenue comes from consumption tax, which is not captured by the earnings tax and transfers, as estimated by Heathcote, Storesletten, and Violante (2017). In our steady-state analysis, the value of this consumption tax, represented by
  , is fixed and is set to 5.5 percent, as calculated in Mendoza, Razin, and Tesar (1994). In our analysis of the economy under transition, we assume that this consumption tax is increased to finance the increase in the retirement benefits paid out by the government.
Finally, we assume that there is a (corporate) capital income tax of 33 percent, which is paid by the firms. We assume that this rate is fixed and remains unchanged under the reform. As a result, the implied after-tax return on all assets is  and is the same for everyone.37 This is also the interest rate that the government pays on its debt. We assume that households do not pay any tax on their savings—beyond the corporate income tax. In general, measurement of savings taxes in the cross section is very difficult.38 This is because of the vast differences in the tax code in the treatment of different types of savings. In reality, a significant fraction of savings are held in tax-deferred retirement accounts39 (which are tax deductible and are treated as income during retirement), whose tax treatment is possibly progressive. On the other hand, richer individuals who hold stocks and bonds can have more sophisticated strategies to minimize their tax burden. These facts motivate us to use no savings taxes in our benchmark calibration. In order to check the robustness of this assumption, we provide two robustness exercises in the Supplemental Material: an exercise with a flat and positive savings tax and one with a progressive savings tax.40
4.6 Calibration Results
Table II lists the parameters that are either taken from other studies, or estimated or calculated independent of the model structure. Their sources and estimation or calculation procedures are outlined in the previous paragraphs. Table III lists the parameters that are calibrated using the model by matching some moments in the U.S. data. The top panel lists the parameter values. The bottom panel shows the targeted moments in the data and the resulting values in the model.
|
Parameter |
Description |
Values/source |
|---|---|---|
|
Demographics |
||
|
J |
maximum age |
75 (100 years old) |
|
R |
retirement age |
40 (65 years old) |
|
n |
population growth rate |
0.01 |
|
Mj(θ) |
mortality hazard |
see text |
|
Preferences |
||
|
σ |
risk aversion parameter |
1 |
|
ε |
elasticity of labor supply |
0.5 |
|
Labor productivity |
||
|
σθ |
Pareto-lognormal variance parameter |
0.6 |
|
aθ |
Pareto-lognormal tail parameter |
3 |
|
μθ |
Pareto-lognormal location parameter |
−0.33 |
|
Technology |
||
|
α |
capital share |
0.435 |
|
δ |
depreciation rate |
0.048 |
|
Government policies |
||
|
|
Social Security and Medicare tax rates |
0.124, 0.029 |
|
|
Social Security benefit formula |
see text |
|
τc |
consumption tax |
0.055 |
|
τ, λ |
parameters of income tax function |
0.151, 4.74 |
|
G |
government purchases |
8% of GDP |
|
D |
government debt |
47% of GDP |
 , τm
, τm
- a For details on the calculation of capital share, government expenditure, and government debt, see Supplemental Material.
|
Parameters |
Description |
Values |
|---|---|---|
|
β0 |
discount factor: level |
0.976 |
|
β1 |
discount factor: elasticity w.r.t θ |
0.014 |
|
ψ |
weight on leisure |
0.675 |
|
Targeted Moments |
Data |
Model |
|---|---|---|
|
Capital-output ratio |
4.00 |
4.00 |
|
Wealth Gini (SCF (2007)) |
0.78 |
0.78 |
|
Average annual hours |
2000 |
2000 |
As a check of the model's ability to capture the extent of inequality in the data, we compute the concentration of earnings and wealth in the model and compare them with the data. The results are presented in Figure 3. The left panel shows the concentration of earnings. The dashed line indicates the commutative share of earnings at each commutative population share for individuals age 25 to 60 in the CPS (1994). The solid line shows the same measure in the model. Overall, the model does a good job at capturing the extent of earnings inequality in the data. The Gini index of earnings is 0.43 in the model and 0.46 in the data. Moreover, the model is able to capture the concentration of earnings at the top. The share of earnings of the top 1 percent is 8 percent in the model and 6 percent in the data. This is achieved through the use of a Pareto-lognormal distribution for ability distribution (even though we did not directly target this moment).

Fit of the distribution of earnings (left panel) and wealth (right panel).
Finally, the right panel in Figure 3 shows the concentration of wealth. The dashed line is the cumulative share of wealth owned by each cumulative population share in the SCF (2007). The model matches the Gini index of wealth by construction (see Table III). Heterogeneity in the discount factor allows us to generate a high concentration of wealth in the model. The share of wealth owned by the top 1 percent is 23 percent in the model and 29 percent in the data. In the Supplemental Material, we plot consumption and earnings profiles in the model and discuss their relationship to the data.
5 Quantitative Results: Steady State
In this section, we apply the tools developed in Section 3.5 to our calibrated economy described in Section 4. We first make a case for policy reforms by demonstrating that status quo policies fail the Pareto optimality tests derived in Proposition 4. We then use the procedure outlined in the Supplemental Material to solve for optimal policies that implement efficient distortions in the economy. Finally, we report the effect that an optimal reform has on individual choices, macro aggregates, and government budget. Note that our optimal policies minimize the present value of consumption net of labor income for each generation. We report the reduction in this cost as a measure of efficiency gains from optimal reform policies.
Two points are worth emphasizing about our exercise. First, the efficiency gains from our Pareto optimal policy reforms can be redistributed across individuals in various ways. In this section, we do not specify how the gains are distributed. In the next section, we provide one way to distribute these gains to a subset of the population. Second, since it is important to disentangle the partial and general equilibrium effects of the reform, in Sections 5.1–5.5, we assume that prices—interest rates and wages—are fixed at the status quo level. We also assume the same demographics as the current U.S. economy. In Sections 5.4 and 6, we report the results with endogenous factor prices, future demographics, and transition.
5.1 Test of Pareto Optimality
We start our analysis by testing the Pareto optimality of the status quo allocations. We do this by computing the intertemporal and intratemporal distortions for the status quo allocations and checking how much the formulas (16), (17), and (18) are violated.
In Figures 4 and 5, we plot the implications of Pareto optimality tests for the status quo economy. Figure 4 plots the performance of the tests for labor wedges.41 The left panel depicts the inequality (18); the dashed red line is the left-hand side, and the black solid line is the right-hand side. As it illustrates, the inequality only fails to hold over a small range of earnings. This is where effective earnings taxes are regressive, due to the Social Security maximum taxable earnings cap (see Figure 2). In this range, the term  is a large negative number. This pushes the left-hand side of inequality (18) up. The right panel depicts the change required in the labor wedge so that the tax smoothing relationship in (19) holds. As we see, the percentage change in the labor wedges to restore (19) is around ±0.5 percent. In other words, it suggests that given the earnings taxes at
  , that is, age 25, and the redistributive motives they represent, earnings taxes are roughly optimal and should not change by much. This observation is suggestive of one of our main findings: that earnings taxes are not a large source of inefficiency of the tax code.


Moving to the efficiency properties of savings taxes, Figure 5 shows the efficiency properties of savings wedges. In the left panel, we focus on working life and examine (16). The figure depicts the change required in savings taxes so that (16) holds at ages 30, 40, and 50. Interestingly, for young people, savings wedges must increase. This is because these young individuals face a borrowing constraint (they cannot borrow) and thus face a negative wedge on their intertemporal savings margin.42 For individuals with mid-values of lifetime earnings, the required change is minimal, close to 0. This is mainly because their mortality risk is small and not very sensitive to their lifetime income. Finally, for working-age rich individuals, the savings wedge must increase. This is because of the discount rate differentials for productive workers. As mentioned in Section 2, since more productive individuals value consumption more in the future, a tax on savings of an individual incentivizes everyone with a higher productivity to work harder and save more. Nevertheless, this figure illustrates that a reform must significantly change the tax treatment of savings.
The right panel of Figure 5 depicts the change required in savings taxes so that (17) holds with equality—holding the values on the RHS fixed. As it can be seen, savings wedges must decline significantly for the majority of individuals older than 65. This is mainly capturing the fact that markets are incomplete, and a subsidy to savings completes the market, that is, provides annuity insurance to workers. Note that the required change in savings subsidies is small at the extremes. At the bottom of the distribution, individuals face a binding borrowing constraint and thus face a negative wedge. Therefore, the required decline in their savings wedge is not high. For individuals at the top of the income distribution, the mortality risk is very small and, as a result, the required decline in their savings wedge is small.
In summary, the results of our tests suggest the following. First, earnings taxes pass the Pareto optimality tests to a great extent, except around the Social Security earnings cap. Second, savings taxes strongly fail the Pareto optimality tests. This result suggests that in a reform, the focus must be on asset taxes as opposed to earnings taxes. Our numerical results below confirm this intuition.
5.2 Optimal Policies
We solve for optimal policies using the planning problem (P1) outlined in Section 3.5. These are (1) nonlinear, age-dependent taxes on assets upon survival,  ; (2) nonlinear, age-dependent taxes on labor income,
  ; (3) transfers to workers before retirement,
  ; and (4) transfers to workers after retirement,
  . Note that transfers are independent of individual choices, but they do depend on age. Note also that the level of transfers and assets of households is not uniquely determined, due to the presence of lump-sum transfers. As a result, we choose transfers such that the lowest-ability type opts not to hold any asset. Moreover, we assume that individuals face linear consumption taxes. We fix the consumption tax rate at the calibrated level for the status quo economy. This assumption eases the comparison of labor income taxes across economies.43 Finally, we fix the corporate income tax rate at the calibrated status quo level. This implies that the pre-tax return on assets is the same in the status quo economy and in the optimal reform.
Figure 6 shows the optimal marginal and average labor income tax functions for ages  (solid lines). We also plot the status quo tax functions for comparison (dashed lines). Notice that except for the region where there is a sharp drop in the status quo tax rates (due to Social Security maximum taxable earnings), the optimal taxes are very close to those in the status quo. Furthermore, there is little age dependence in the optimal labor income taxes.44 These results imply that there is little room for improvement in efficiency by reforming labor income taxes. In essence, our exercise confirms the insight from the Pareto optimality tests performed in Section 5.1 regarding earnings taxes.

Optimal labor income tax functions. The left panel shows marginal taxes, and the right panel shows average taxes. The black dashed line is the effective status quo tax schedule.
The left panel of Figure 7 shows the optimal marginal taxes (subsidies) on assets for ages  . Since mortality is larger for asset-poor individuals, the rates are larger for these individuals at all ages. In contrast, asset-rich individuals have higher ability, and hence lower mortality. The inefficiency due to the absence of an annuity market is smaller for these individuals; therefore, asset subsidies are smaller (taxes are higher). In this sense, optimal asset taxes (subsidies) are progressive. Figure 7 also illustrates that subsidies are large, around 5 percent, and thus can play an important role in the provision of retirement benefits by the government.

Optimal asset tax functions. The left panel shows the marginal taxes over all asset levels at ages 65, 75, and 85, while the right panel shows the average marginal rates at each age from 65 to 85. The dashed line is the population mortality index.
The right panel shows the average marginal rates at each age from 65 to 85 years in comparison to the average mortality of the population. The difference between the two implies the following: first, progressivity of the subsidies is significant and cannot be ignored; second, policies are above and beyond completing the annuity market, as would be the case in a world where mortality were observed by the government (or mortality were uniform in the population).
As before, the implied magnitudes of asset subsidies and their progressivity confirm the results of our optimality tests. In other words, asset subsidies are an important part of our Pareto optimal reform.
5.3 Sources of Retirement Income
It is useful to compare the sources of retirement income in the status quo economy and that of the optimal reform. This comparison would shed light on the burden of the reform for the government and on changes in individual budgets.
Table IV compares the share of government transfers out of the total income for retired individuals (asset income plus government transfers). In our calculation for the status quo economy, the government transfers consist of Social Security (and Medicare) benefits. For comparison, we also include the share of government transfers in retirement income as measured in the CPS data (reported in Poterba (2014)).45
|
Share of public transfers in retirement income (%) |
||||
|---|---|---|---|---|
|
Optimal reform |
||||
|
Income quartiles |
Dataa |
Status quo |
(incl. asset subsidies) |
(excl. asset subsidies) |
|
1st |
95 |
100 |
80 |
47 |
|
2nd |
90 |
94 |
70 |
27 |
|
3rd |
67 |
79 |
63 |
17 |
|
4th |
34 |
33 |
48 |
6 |
The numbers in our status quo economy are close to the CPS data, particularly for the lower half of the income distribution.
An important feature of the reform economy is the significant reduction in the share of government transfers in retirement income for all income groups except the top quartile. This is mainly a result of the presence of asset subsidies. In particular, asset subsidies imply that individuals will save more. As a result, asset income constitutes a higher fraction of retirement income and, therefore, the share of government transfers in income declines.
5.4 Aggregate Effects of Reforms
Table V shows the summary statistics of the aggregate variables for our economy. In the first column, we report the aggregate quantities in the calibrated benchmark with the status quo U.S. policies. The second column shows the aggregate variables under Pareto optimal reform policies, holding factor prices fixed. In this case, the stock of capital in the economy is 12.29 percent higher relative to the status quo. This is due to higher incentives to save provided by optimal asset subsidies. As a result, GDP is higher by 4.33 percent and consumption by 1.66 percent relative to the status quo. However, consumption as share of GDP falls slightly from 0.69 to 0.67. This is, again, due to a higher desire for savings under optimal reform policies. Overall, the present discounted value of consumption, net of labor income, for each cohort falls by 11.08 percent in the optimal reform relative to the status quo. In terms of flow of consumption, this is equivalent to a 0.82 percent fall in consumption for all types in all ages. That is the amount of decline in status quo consumption needed to equalize the present discount value of consumption, net of labor income, equalized across status quo and optimal reform allocations.
|
Current U.S. (1) |
Optimal reform |
||
|---|---|---|---|
|
(2) |
(3) |
||
|
Factor prices |
|||
|
Interest rate (%) |
4.05 |
4.05 |
3.81 |
|
Wage |
1.00 |
1.00 |
1.03 |
|
Values relative to GDP |
|||
|
Consumption |
0.69 |
0.67 |
0.68 |
|
Capital |
4.00 |
4.31 |
4.13 |
|
Tax revenue (total) |
0.26 |
0.27 |
0.27 |
|
Earnings tax |
0.14 |
0.14 |
0.15 |
|
Consumption tax |
0.04 |
0.04 |
0.04 |
|
Capital (corporate) tax |
0.08 |
0.09 |
0.08 |
|
Transfers |
0.16 |
0.15 |
0.15 |
|
To retirees |
0.08 |
0.02 |
0.02 |
|
To workers |
0.08 |
0.05 |
0.05 |
|
Asset subsidies |
0.00 |
0.08 |
0.08 |
|
Change (%) (relative to current U.S.) |
|||
|
GDP |
– |
4.33 |
1.72 |
|
Consumption |
– |
1.66 |
0.58 |
|
Capital |
– |
12.29 |
5.14 |
|
Labor input |
– |
−1.80 |
−0.83 |
|
PDV of net resources |
– |
−11.08 |
−29.43 |
|
Consumption equivalence |
0.82 |
2.18 |
|
- a Column (1) is the benchmark calibration to the current U.S. economy. Column (2) is the optimal reform policies with prices and demographics fixed at the current U.S. values. Column (3) is the optimal reform policies with equilibrium prices but fixed demographics (at current U.S. levels).
The third column in Table V shows aggregate quantities under Pareto optimal policies with endogenous factor prices (but with benchmark demographics, i.e., current U.S. demographics). In this case, the capital stock is higher by only 5.14 percent. This is due to the general equilibrium effect of the lower real return (3.81 percent relative to 4.05 percent). GDP is higher by 1.72 percent and consumption by 0.58 percent relative to the status quo. The cost savings in this case are significantly larger relative to the case with fixed factor prices. In other words, the present discounted value of consumption, net of labor income, for each generation falls by 29.43 percent (this is equivalent to a 2.18 percent fall in the flow of consumption for all types at all ages). This large difference in cost savings can be accounted for entirely by the fall in the interest rate.46
5.5 Distributional and Budgetary Effects of the Reform
While our exercise keeps the distribution of welfare the same, an optimal reform can affect the allocation of resources across individuals. In this section, we describe the effect of our optimal reform exercise on the distribution of allocations.
Figure 8 shows the Lorenz curve for earnings and wealth distribution for status quo and efficient allocations. As we see, the optimal reform policies do not have a significant effect on the distribution of earnings, which is in line with the fact that earnings taxes exhibit very little change. On the other hand, the efficient distribution of assets is less concentrated than in the status quo. In particular, the wealth Gini under reform policies is 0.64, which is significantly lower than the wealth Gini of 0.78 under the status quo. This is mainly because the consumption of low-productivity individuals increases late in life, due to subsidies on assets and, as a result, the asset distribution becomes less skewed.

Distribution of earnings and wealth: status quo versus optimal reform. The black line shows the results in the calibrated economy with current U.S. status quo policies. The gray solid line shows the results under Pareto optimal policies (for current U.S. demographic parameters and holding factor prices fixed).
Table V shows how the optimal reform affects the government's tax revenue and transfers. There is little difference in total tax revenue and total transfers as a fraction of GDP. However, the nature of transfers changes significantly in an optimal reform. Pure transfers before and after retirement fall as a percentage of GDP; instead, asset subsidies, which amount to 8 percent of GDP, are introduced. Optimal reform policies can achieve the same welfare as status quo policies by collecting more taxes and transferring fewer resources. This is possible because optimal reform policies remove inefficiencies due to a lack of annuitization and inefficiencies in the status quo income tax.
6 Quantitative Results: Transition
The above analysis points towards the key reforms that are relevant for an overhaul of the fiscal policies including Social Security in the steady state. While the results are informative, the analysis assumes that there is no demographic change and, therefore, downplays the role of a policy reform. In this section, we repeat our quantitative exercise in an aging society with a declining population growth and mortality rate. Our quantitative results confirm the importance of asset tax reforms and the lack of importance of earnings tax reforms.
6.1 An Aging Economy
We assume that the status quo economy is initially in a steady state determined by the calibrated parameters, as described in Section 4. The economy then experiences a demographic transition which starts at  and ends in 50 years. At the conclusion of the demographic transition, the population growth is 0.5 percent (down from 1 percent), consistent with U.S. Census Bureau's projections (see Colby and Ortman (2015)). In addition, the new population mortality rates match the mortality rates of 2040 birth cohort males (Table 7 in Bell and Miller (2005)). We calibrate equation (20) to match the differences in mortality rates among lifetime earnings deciles reported in Waldron (2013), as well as the new population mortality rates.47 All parameters change gradually according to a linear trend over the 50-year transition period. These assumptions imply that the ratio of workers to retirees falls from 4 (its current value) to 2.4 (its projected value). This is consistent with U.S. Census Bureau's projections (see Colby and Ortman (2015)).
6.2 Transition in the Status quo Economy
In order to solve for optimal policies, we need to know the distribution of lifetime welfare for each birth cohort along the transition path for the status quo economy. Since, under the status quo and in an aging economy, the Social Security program is not sustainable, we have to take a stance on what status quo policies will be implemented in order to make the Social Security system sustainable. To this end, we make the following assumptions. First, we assume that the income tax schedules and Social Security benefit formula do not change. Second, the debt to GDP ratio is held constant at its initial calibrated value of 47 percent. Third, and most importantly, we assume that the consumption tax adjusts in each period to balance the government budget constraint and hence finance the transition. It is important to note that, due to political uncertainties, it is impossible to know how status quo policies evolve in response to demographic changes. Here, we use the simplest benchmark to conduct our analysis. However, our methodology can be applied to any alternative assumption for the future path of status quo policies.
The second column in Table VI shows how the demographic change and continuation of status quo policies affect the aggregates. Since mortality is lower, individuals live longer and, therefore, have a higher demand for savings. This, in turn, increases the stock of capital by 7.96 percent. However, due to the lower number of workers as share of population, the labor input falls by 9.26 percent, resulting in a 2.13 percent decline in GDP.
|
Current U.S. (1) |
Continue (2) |
Optimal reform |
|||
|---|---|---|---|---|---|
|
(3) |
(4) |
(5) |
|||
|
Factor prices |
|||||
|
Interest rate (%) |
4.05 |
3.37 |
4.05 |
3.81 |
3.31 |
|
Wage |
1 |
1.08 |
1 |
1.03 |
1.09 |
|
Values relative to GDP |
|||||
|
Consumption |
0.69 |
0.69 |
0.67 |
0.68 |
0.68 |
|
Capital |
4.00 |
4.41 |
4.31 |
4.13 |
4.45 |
|
Tax revenue (total) |
0.26 |
0.29 |
0.27 |
0.27 |
0.27 |
|
Earnings tax |
0.14 |
0.14 |
0.14 |
0.15 |
0.13 |
|
Consumption tax |
0.04 |
0.07 |
0.04 |
0.04 |
0.07 |
|
Capital (corporate) tax |
0.08 |
0.07 |
0.09 |
0.08 |
0.07 |
|
Transfers |
0.16 |
0.19 |
0.15 |
0.15 |
0.13 |
|
To retirees |
0.08 |
0.12 |
0.02 |
0.02 |
0.02 |
|
To workers |
0.08 |
0.07 |
0.05 |
0.05 |
0.04 |
|
Asset subsidies |
0.00 |
0.00 |
0.08 |
0.08 |
0.07 |
|
Change (%) (relative to status quo) |
|||||
|
GDP |
– |
−2.13 |
4.33 |
1.72 |
−1.44 |
|
Consumption |
– |
−2.38 |
1.66 |
0.58 |
−2.00 |
|
Capital |
– |
7.96 |
12.29 |
5.14 |
9.73 |
|
Labor input |
– |
−9.26 |
−1.80 |
−0.83 |
−9.26 |
|
PDV of net resources |
– |
– |
−11.08 |
−29.43 |
−4.24 |
|
Consumption equivalence |
– |
– |
0.82 |
2.18 |
0.98 |
- a Column (1) is the benchmark calibration to the current U.S. economy. Column (2) is the continuation of U.S. status quo policies (with consumption tax adjusted to balance government's budget constraint). Column (3) is the optimal reform policies with prices and demographics fixed at the current U.S. values. Column (4) is the optimal reform policies with equilibrium prices but fixed demographics (at current U.S. levels). Column (5) is the optimal reform policies with equilibrium prices and future demographics. In columns (3) and (4), the percentage change in the PDV is calculated relative to column (1). In column (5), the percentage change in the PDV is calculated relative to column (2).
While continuation of the status quo policies does not change the tax revenue as percentage of GDP, there is a significant increase in old-age transfers as percentage of GDP. This is because there are more retirees in the economy. On the other hand, to offset the effect of a rise in old-age transfers on government budget, the consumption tax rate must rise to 10 percent (from the original value of 5.5 percent). This increase in the consumption tax rate increases the share of government revenue from consumption tax and contributes to a decline in inequality. As a result, inequality overall does not change very much. The cross-sectional distribution of earnings and wealth in the new steady state are depicted in Figure 9. There is no change in the distribution of earnings, while the distribution of wealth becomes slightly more unequal (the wealth Gini index rises from 0.78 to 0.79).

Distribution of earnings and wealth: status quo versus. optimal reform. The black solid line shows the results in the calibrated economy with current U.S. status quo policies. The black dashed line shows the steady-state results with projected demographic parameters and continuation of status quo policies. The gray solid (blue in the online version of the article) line shows the steady-state results under Pareto optimal policies for projected demographic parameters. Factor prices are endogenous.
6.3 Reform Exercise
Using the time path of the distribution of welfare for each generation, we solve the problem of minimizing the resource cost of delivering the status quo welfare to each individual in each birth cohort. We do this while keeping the corporate income tax rate and consumption tax rate at their status quo level.48
A complication that arises when performing an optimal policy reform in an economy in transition is the treatment of existing generations: generations that are alive at the time of the reform. The complication arises from an information problem. At the time of the reform, households who have worked and saved previously have revealed their types. Thus, if the government has a flexible enough tax function (e.g., generation-specific taxes on their assets at the time of the reform), it can achieve first best and fully bypass the incentive problem. We think this ability of the government to completely bypass the incentive problem is unrealistic. It also creates a discontinuity on allocations for people who are alive at the time of the reform relative to future generations, which makes it harder to accept it as a reasonable reform.
In order to solve this problem, we make the following assumptions: any person who is alive at the beginning of the reform ( ) will face the status quo policies together with an additional one-time lump-sum transfer. All other individuals will face optimal reform policies. Note that this means that the generations that are alive at the start of the reform receive all the gains from the reform.
6.4 Optimal Reforms
Our quantitative exercise for the transition mainly confirms our previous findings in our steady-state analysis: asset subsidies play a key role in the reform, while earnings taxes do not change it by much. Figure 10 shows the changes in the earnings taxes over time. Since in the course of transition to the new steady state, inequality remains somewhat constant, earnings taxes should not change by much. Furthermore, asset subsidies are still significant, although slightly lower, due to the decline in the mortality rate (Figure 11).

Evolution of optimal marginal labor income tax functions over the transition.

Evolution of optimal marginal asset tax functions over the transition.
The last column of Table VI shows the impact of these policies on aggregate allocations and on government budget. Capital stock rises more relative to the status quo economy. This leads to a smaller decline in GDP and aggregate consumption.49 Figure 12 shows the path of the aggregate variables over the transition. The jump in the primary surplus as share of GDP is due to the initial lump-sum distribution.

Evolution of aggregates along the transition.
Importantly, reform policies reduce the cost of delivering the status quo welfare to each birth cohort. Under optimal reform policies, the present discounted value of consumption net of labor income for a newborn is 4.24 percent lower relative to what it would be under the continuation of the status quo policies in the steady state (this is equivalent to 0.98 percent lower consumption for all types and all ages). As we discuss above, we distribute these resources to those who are alive at the start of the reform in a lump-sum fashion. This transfer is equivalent to 10.5 percent of GDP in the initial steady state.
Overall, we view the results of our quantitative exercises, one for the aging economy and one in the steady state, as pointing towards the importance of asset subsidies to all individuals as an integral part of any fiscal policy reform. This is in contrast with much of the discussion in policy circles on earnings tax reform (reform of the payroll taxes, etc.).
7 Extensions and Robustness
In this section, we investigate the importance of our results relative to other commonly considered reforms. Furthermore, we discuss the robustness of our results to alternative calibrations of status quo policies as well as alternative motives for saving.
7.1 Optimal Privatization Reform
As we discussed in Section 5, savings subsidies play an important role in our Pareto optimal reforms. In particular, the optimality tests and the optimal reform exercise indicate a reform of the earnings taxes does not seem to play an important role. One might, however, think that this is due to the generality and flexibility of the asset taxes. Here, we briefly describe an exercise that further highlights the role of asset subsidies and their progressivity. The details of the analysis are in the 8.
In this exercise, we assume that there are no asset taxes or subsidies. This exercise is similar to a particular proposal that has received considerable attention in the literature: privatization of retirement financing. More precisely, this is the proposal to eliminate Social Security retirement benefits and reduce payroll taxes and move towards a save-for-retirement system.50 These privatization policies differ from our optimal reform policy in two very important ways. First, our optimal reform policy does not involve a major adjustment of labor income taxes. Second, our optimal reform policy relies crucially on asset subsidies.
We solve for the best reform policies that feature no old-age transfers and no asset taxes or subsidies. In this regard, the efficiency gains from these policies can be viewed as an upper bound on what can be gained through privatization policies. The additional constraint that we impose on the planning problem relative to that in Section 5 is that the savings wedge as defined in (15) must be 0. This implies that earnings taxes are chosen without constraint, and savings subsidies are 0 for everyone.
Figure 13 (left panel) shows the optimal marginal taxes under privatization policies. Note that marginal rates are lower than the status quo, especially at the lower income levels. Moreover, the drop in marginal taxes matches the level of payroll taxes. In this regard, our optimal policies mimic a key feature of the privatization proposals. However, there is also a crucial difference that our optimal labor tax rates are negative for the poorest individuals. The no-subsidy restriction tilts the optimal profiles of consumption towards younger ages. To accommodate this higher consumption, low-income individuals must work more. The negative marginal income tax provides the incentive needed for these low-ability individuals to increase their work effort.

Optimal labor income tax functions with privatization (no old-age transfers and no asset subsidies). The left panel is optimal marginal taxes under privatization, while the right panel shows the same for the benchmark calibration. The black dashed line is the effective status quo tax schedule.
Under privatization policies, the present discounted value of consumption, net of labor income, rises relative to the status quo under all scenarios regarding prices and demographics. In other words, imposing zero taxes on savings—as opposed to subsidizing them—is stringent enough on allocations that it raises the costs of delivering utilities in the steady state. This highlights the importance of subsidies in any reform. Details of the calculations and aggregate effects of privatization policies are provided in the Supplemental Material.51
While this exercise highlights the importance of savings subsidies, one can also question how important the progressivity of the subsidy system is in a reform. In the Supplemental Material, we perform an optimal reform exercise while imposing that savings taxes must be linear. Our calculations establish that two-thirds of the gains can be achieved by linear subsidies and optimal earnings taxes. Thus, progressivity of subsidies is an integral part of an optimal reform.
7.2 Alternative Status quo Tax Function
One of our key findings in Section 5 is that the status quo earnings tax function in the United States fails the Pareto efficiency test only at the maximum Social Security taxable income. This is partly because, for the most part, we used a smooth function to approximate the U.S. earnings taxes. A concern is that the actual earnings tax in the United States contains many thresholds which lead to a non-smooth tax function and could potentially lead to inefficiencies. To address this concern, we repeat our exercise using the calculations of effective marginal tax rates on labor income provided by the Congressional Budget Office; see Harris (2005). In particular, for the status quo earnings taxes, we use the effective marginal federal (and state and local) tax rate for a head of household with one child in 2005.52 This tax approximation includes many intricate features of the tax code including EITC phase-in and phase-out, AMT, CTC, and itemized deductions.
Figure 14 depicts the earnings tax test. Despite a non-smooth status quo tax function, the earnings tax function fails the inequality test only at the Social Security maximum taxable income. However, it comes close to being violated at a lower income level as well. This level of earnings is the large drop in the effective marginal tax rate due to transition from the EITC phase-out (which implies an effective marginal rate of 31 percent) to the 15 percent bracket. Furthermore, as the right panel in Figure 14 depicts, the deviations from the tax smoothing equation (19) are higher than before and of a magnitude of up to 3 percent. Nevertheless, as depicted in Figure 15, the optimal labor income taxes are not very far from optimal. Intuitively, despite having many ups and downs, there is not much variation in the marginal income taxes relative to a smooth approximation to this schedule. As a result, the earnings taxes do not vary by much in an optimal reform.53


Optimal labor income tax functions for the alternative status quo tax policy. The left panel shows optimal marginal taxes and compares them with CBO effective tax rates. The right panel shows the same for the benchmark economy (with HSV tax function).
7.3 Additional Motives for Saving
In our analysis so far, we have assumed that the drop in income during retirement and demand for insurance against mortality risk are the only motives for saving. In other words, a large source of inefficiency comes from households' desire to finance old-age consumption and self-insure against outliving their assets. Absent any other motive for saving, the model may over-emphasize the role of life-cycle saving and, hence, exaggerates inefficiencies caused by the annuity market incompleteness. To check the robustness of our findings, in this section we consider other motives for saving commonly considered in the literature: out-of-pocket medical expenditures and bequest motives.
7.3.1 Out-of-Pocket Medical Expenditures
As De Nardi, French, and Jones (2010) documented, out-of-pocket medical expenditures rise rapidly with age and income. As people get older, this increase in their medical needs provides a strong motive to save. This motive is even stronger for those with a higher lifetime income. To examine how this additional saving motive affects our results, we introduce exogenous out-of-pocket medical expenditure to the model.54 We assume these medical expenditures increase with age and ability type θ. More specifically, let  be the medical expenditure of a person of type θ at age j. In other words, we assume
  for all θ. Moreover, to focus on saving in old age, we assume there are no out-of-pocket medical expenditures prior to retirement, that is,
  for all
  . Finally, we assume monotonicity with respect to age. For
  , we assume
  if
if  for all θ.
 be the total consumption expenditure. Individual preferences are given by


In order to calibrate the out-of-pocket medical expenditure profiles, we closely follow De Nardi, French, and Jones (2010) and use data from the AHEAD survey between 1996 and 2006. We allow medical expenditure to depend on age and permanent income ranking (the individual's average income quantile, which can be thought of as associated with θ). This is depicted in the left panel of Figure 16. Furthermore, in order to better match the patterns of asset decumulation, we assume that σ, the coefficient of absolute risk aversion, takes a value of 2. As before, we calibrate the average discount factor in order to match the capital output ratio. We leave the variation in the discount factor, represented by parameter  , the same as in the benchmark model.

The left panel shows the average out-of-pocket medical expenditures by permanent income. The right panel shows the median assets by permanent income quintile in the model (solid line) and data (dashed line). Data source: De Nardi, French, and Jones (2010) calculations for AHEAD cohorts who were 74 and 84 years old in 1996. Note that the lowest quintile has 0 assets in the model and in the data.
To show how well the model captures the pattern of dissaving in retirement, we plot the median assets by permanent income quintile in the model as well as the medial assets by permanent income quintile in the AHEAD data in Figure 16 (right panel). The data are based on De Nardi, French, and Jones (2010) calculations for AHEAD cohorts who were 74 and 84 years old in 1996. As we see, the model (solid line) captures the pattern of dissaving very well except for the assets of the top income quintile.
Using the calibrated model, we compute the optimal earnings tax and asset subsidies. These are presented in Figures 17 and 18. As these figures demonstrate, there are no significant differences in optimal policies derived from the model with medical expenditures relative to the ones presented in the previous sections. In other words, the presence of medical expenditure does not change the prescription of our model about policy reforms. As we have mentioned before, the presence of medical expenditure that increases with earnings leads to forces towards taxation of savings. Yet, our analysis shows that such forces are not strong enough to overcome the forces to subsidize savings. This is mainly because the gradient of medical expenditure is not large enough to generate a strong motive for savings taxes.

Optimal labor income tax functions with out-of-pocket medical expenditures. The left panel is optimal marginal taxes with out-of-pocket medical expenditures. The right panel shows the same for the benchmark model. The black dashed line is the effective status quo tax schedule.

Optimal asset tax functions with out-of-pocket medical expenditures. The left panel shows optimal marginal taxes over all asset levels at ages 65, 75, and 85 for an economy with out-of-pocket medical expenditure. The right panel shows the same for the benchmark model.
Finally, Table VII shows the effect of optimal policies on aggregate quantities. The last row presents the efficiency gains, measured in decline in the present discounted value of lifetime consumption, next to labor income for each cohort. The magnitude of the cost savings is not very different from the ones in the main exercise. This is mainly because of the way optimal reforms affect consumption profiles over the lifetime. In particular, due to annuitization, consumption does not fall as people age and, thus, the same level of utilities can be delivered with a lower level of consumption. As a result, when we calculate the present values, the drop in consumption early in life is more pronounced because of discounting. Because of this, the cost saving measures do not drop significantly.
|
Current U.S. (1) |
Continue (2) |
Optimal reform |
|||
|---|---|---|---|---|---|
|
(3) |
(4) |
(5) |
|||
|
Factor prices |
|||||
|
Interest rate (%) |
4.05 |
3.14 |
4.05 |
3.84 |
3.06 |
|
Wage |
1 |
1.11 |
1 |
1.02 |
1.12 |
|
Change (%) (relative to status quo) |
|||||
|
GDP |
– |
1.70 |
2.18 |
0.9 |
1.92 |
|
Consumption |
– |
0.19 |
0.34 |
−0.31 |
−0.06 |
|
Capital |
– |
16.21 |
7.63 |
3.95 |
17.97 |
|
Labor input |
– |
−8.24 |
−2.02 |
−1.39 |
−8.93 |
|
PDV of net resources |
– |
– |
−9.67 |
−28.76 |
−7.94 |
|
Consumption equivalence |
0.66 |
1.97 |
0.99 |
||
- a Column (1) is the benchmark calibration to the current U.S. economy. Column (2) is the continuation of the U.S. status quo policies (with the consumption tax adjusted to balance government's budget constraint). Column (3) is the optimal reform policies with prices and demographics fixed at the current U.S. values. Column (4) is the optimal reform policies with equilibrium prices but fixed demographics (at the current U.S. levels). Column (5) is the optimal reform policies with equilibrium prices and future demographics. In columns (3) and (4), the percentage change in the PDV is calculated relative to column (1). In column (5), the percentage change in the PDV is calculated relative to column (2).
In summary, the inclusion of out-of-pocket medical expenditure results in a richer model that is able to capture more details in the patterns of asset accumulation or decumulation. However, the model's implication for an optimal policy does not change. Moreover, the efficiency gains from implementing optimal policies, although lower, are still significant and imply that the reform is effective even in the presence of out-of-pocket medical expenditure.
7.3.2 Bequest Motive
 (21)
(21) is the amount of bequest left by type θ if they do not survive to age
  . We use a utility from bequest
  that implies that bequests are luxury goods. Moreover, we allow the government to differentially tax savings conditional on survival and bequests. In order to calibrate this model, we match the moments related to the distribution of bequests in the United States: the fraction of the deceased individuals that leave no bequests and the ratio of bequests to wealth in the aggregate.
Using this calibrated model, we perform an optimal policy reform exercise on the calibrated model that includes the medical expenditure profiles estimated in Section 7.3.1. Figure 19 depicts the optimal asset subsidies compared to those in the benchmark model. Especially for lower values of assets, optimal subsidies are as large as those in the benchmark models. This is mainly because it is optimal for these individuals not to leave bequests. For higher values of assets, subsidies fall relative to the benchmark model due to the demand for bequests by richer individuals. Nevertheless, our benchmark implications for optimal policies remain roughly unchanged. An integral part of this policy is bequest taxation. In particular, for many individuals, bequests must be fully taxed away in order to solve the market incompleteness problem faced by these households. Interestingly, in an optimal policy reform, most of the cost savings come from a reduction in bequests. This is because the only way for individuals to save is a risk-free asset and, as a result, bequests are too high for the status quo economy. The detailed theoretical and quantitative analysis of this model is in the Supplemental Material.

Optimal asset tax functions with out-of-pocket medical expenditures and bequest motives. The left panel shows the optimal marginal asset taxes over all asset levels for surviving individuals at ages 65, 75, and 85. The left panel shows the marginal bequest taxes for the same ages.
8 Conclusion
In this paper, we have provided a theoretical and quantitative analysis of Pareto optimal policy reforms aimed at financing retirement. These are reforms that intend to separate the efficiency of such schemes from their distributional consequences. Our optimal reform approach points towards the importance of subsidization of asset holdings late in life. At the same time, our analysis shows that reforms aimed at earnings taxes (such as a decline in payroll taxes or an extension of Social Security maximum earnings cap) are not integral to Pareto optimal reforms.
To keep our analysis tractable, we have focused on permanent ability types and abstracted from idiosyncratic shocks that are the focus of most of the optimal dynamic tax literature. Inclusion of these shocks introduces additional reasons for taxing capital (as in Golosov, Kocherlakota, and Tsyvinski (2003) and Golosov, Troshkin, and Tsyvinski (2016)) in the pre-retirement period. As shown by others, such shocks induce very little reason to tax capital income (see Farhi and Werning (2012)), compared to the magnitude of our savings distortions. Hence, we have good reasons to believe that including shocks to earnings does not alter our results.
A key feature of our model is the correlation between earning ability and mortality. In choosing this assumption, we were guided by the large body of evidence that points to a strong correlation between socioeconomic factors (such as income or education) and mortality rates. We take an extreme view and assume that this correlation is exogenously given and individuals' choice has no effect on their mortality. In reality, many individuals affect their mortality through the decisions they make over their lifetime. We choose to ignore these effects due to two reasons. First, as Ales, Hosseini, and Jones (2012) showed, when individuals differ in their earning ability, and mortality is endogenous, efficiency implies more investment in the survival of the higher-ability individuals. Hence, it is never efficient to eliminate the correlation between ability and mortality. Second, in any model in which the length of life is endogenous, the level of utility flow becomes important in marginal decisions by individuals. This makes analysis of such models very complicated and intractable. It is important, however, to know how inclusion of endogenous mortality affects our analysis of optimal policy. We leave this for future research.
 when the individual survives to the second period, and all of the assets when the individual dies in the second period.
 as the effective marginal corporate tax rate on capital gains that captures all the distortions caused by the corporate income tax code and capital gain taxes. Our optimal reform exercise does not contain an overhaul of the capital tax schedule. As a result, in our economy, we take as a given the after-tax interest rate earned on all types of assets.
Appendix A: Proofs
A.1 Proof of Proposition 1
We first show the following lemma:
Lemma 5.A feasible allocation  together with capital allocation
  is induced by some sequence of tax functions
  ,
,  if and only if
 (22)
(22)
Proof.Suppose that an allocation is induced by a sequence of tax functions and suppose that for some types θ and  ,
,

 ,
,  ,
,  —this is a feasible choice since budget constraints are independent of agents' types. This implies that the original allocations cannot be induced by the tax functions as the allocations are not optimal under the tax codes.
Now consider a feasible allocation that satisfies the condition in the statement of the lemma. Let  be defined by

 . Then let
  be defined by

where  . Note that this tax function is well-defined as, if
  and
and  are the same for two types, then the incentive compatibility constraint implies that
  must also be the same and therefore so is the value of
  . Furthermore, for a value
  with
with  , we choose a value for
  so that these points are not chosen by any type θ—this is easily done by considering the value for the highest type that benefits from such a point and choosing it high enough so that such type does not want to choose this point. If, under this construction,
  , then we can adjust the tax function by a constant in order to make this equality be satisfied.
By the incentive compatibility and the construction of  and
and  , it is optimal for an individual of type θ to choose the desired allocation. Since this allocation is feasible, it must be induced by the constructed tax functions. □
Now we prove Proposition 1:
Proof.Given the above lemma, we can focus on allocations. In particular, among the set of feasible and incentive compatible allocations (those satisfying (22)), those induced by Pareto optimal tax functions must be Pareto optimal themselves. In what follows, we characterize the set of Pareto optimal allocations. A useful property that helps us in our analysis is that, under our assumption of the utility function, the set of incentive compatible allocations is linear in the utility space. This property allows us to use standard separating hyperplane arguments to show that an allocation is Pareto optimal if and only if a positive continuous function  exists so that this allocation is the solution to the following planning problem:


 (P1)
(P1)
 is the utility of each individual at date t under the specified allocation. Note that since the objective is strictly concave—if we rewrite things in terms of utilities—and the constraint set is convex, the solution to this planning problem is unique.
Now consider the solution to the above problem for a sequence of  's. Then the first-order conditions with respect to
  satisfy


 . We can rewrite the above optimization as


 , then, since each generation's contribution to the objective is additively separable, the solution to the above must also solve the optimization (P). Now, if an allocation solves optimization (P), then it must be the solution of the above problem where
 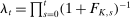 . By assumption
  as a result,
  and the objective in the above is well-defined. Now since, given these values of
  , the solution to the above satisfies the FOC's associated with (P1) and the solution to (P1) is unique, the allocation must be Pareto optimal. This concludes the proof. □
A.2 Proof of Proposition 2
Proof.For the class of preferences considered, any Pareto optimal allocation induced by some tax function must solve planning problem (P). By the no-bunching assumption, we can replace the incentive compatibility constraint with its associated first-order condition

 is the utility of individual θ. The first-order conditions associated with this problem are given by

 for all values of θ. By definition of the labor and saving wedges, we have


Note that the FOC's also imply that


A.3 Proof of Proposition 3
Proof.Consider the first-order conditions derived in Section A.2. Then Pareto optimality of the allocation implies that, for θ,  . Therefore, we must have

Note that under the assumption that first-order conditions fully characterize optimal allocation, the local incentive constraint is sufficient for global incentive compatibility. As a result, the planning problem for each generation is given by


 , we have

 ,
,  , and
, and  and let
  and
and  be the inverse of
  and
and  , respectively, the above optimization problem can be written as


 ,
,  ,
,  . Since its objective is strictly concave in these variables—
 and
and  are strictly convex and concave, respectively—by Theorem 1, Chapter 8 of Luenberger (1997), the first-order conditions are sufficient. This implies that (3) and (5) are sufficient for Pareto optimality of a tax schedule. □
A.4 Proof of Proposition 4
The planning problem (P1) replaces a global implementability as in (1) with its local equivalent (13). We start by deriving this local implementability constraint for the planning problem.
A.4.1 Derivation of Local Implementability Constraint (13)
 are replaced by
  :
:


 back and evaluate at the solution
  :
:

We now turn to the proof of Proposition 4. To avoid clutter, assume  and
and  . Also we will drop dependence on θ whenever possible.
Proof.Let  where
where  is the density function. Let
  ,
,  , and
, and  be multipliers on equations (12), (13), and (14), respectively. The first-order conditions for the problem (P1) are
 (23)
(23) (24)
(24) (25)
(25)
Recall that

 ; we get


 :
:

 :
:
 (26)
(26) and
and  is the Frisch elasticity of labor supply,
  , at
, at  .
.Note also that, combining (23) and (24), we get

 (27)
(27)
The sufficiency of these conditions can be shown using an argument which is very similar to the sufficiency in Proposition 3; it uses the linearity of the incentive constraint in utility space. It is thus omitted to avoid repetition. □
Appendix B: Intuitive Derivation of Tax-Smoothing Formulas
In this section, we describe how the tax-smoothing formula can be derived from a perturbation of the earnings and savings tax schedules. To do this, first observe that by a duality argument, our optimal policy problem is equivalent to maximizing a weighted average of utilities of the individuals subject to incentive compatibility
B.1 No Income Effect

 ,
,  and suppose that both taxes are paid in the first period56 and suppose that it induces choices
  without bunching, that is, both
  and
and  are one-to-one functions. This implies that both of these functions must be increasing.
 ,
,  where
where

 , dy, da,
  are sufficiently small real numbers and θ is any type. As is standard (see Saez (2001)), this perturbation has three effect: a mechanical effect, a behavioral effect, and a welfare effect.

 is the social marginal value of giving one unit of income to an individual of type θ—this is evaluated according to the social welfare function associated with the Pareto optimal tax schedule. Intuitively, this perturbation simply decreases the after-tax income of workers with type
 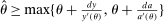 . Moreover, from an envelope condition, the change in utility for these individuals is simply
  . As da and dy become small and converge to zero, the welfare and mechanical effects converge to the above integrals. Note that for types in the interval
 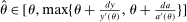 , only the marginal taxes change and, therefore, the change in their utilities is of higher order of magnitude relative to
  and
and  .
.Note that we can always choose the perturbation so that  and
and  . This implies that the welfare and mechanical effects are both zero. Therefore, this perturbation only has a behavioral effect on the savings and earnings of individuals in a small interval above θ. Note that since there is no income effect, the earnings tax perturbation,
  , only affects earnings while savings tax perturbation,
  , only affects saving behavior.
 is small enough, we can say that the set of types that change their earnings is given by
  and their change in earnings must satisfy

 . We can write the above approximately as


 is the size of the bracket that is affected by this perturbation, while
  is the behavioral change in government revenue; simply marginal tax rate multiplied by the behavioral change in earning. Similarly, the set of types that change their savings is given by
  and their change in savings must satisfy

 . We can write the above approximately as

 is the intertemporal elasticity of substitution. This implies that the gain in government budget from this behavioral response is approximately given by

 , at the optimum,
 (28)
(28)


 and thus the above can be written as

B.2 Income Effect
With income effect, cross-elasticities matter as well; earnings and savings tax perturbations affect both earnings and savings.
Consider the same tax perturbation as above. Note that, using the same argument, the welfare effect and mechanical effects cancel each other. We thus need to understand the behavioral effects.
 . Then we must have that

 is the compensated elasticity matrix and is given by


 , we can write this as