Tactile, Visual,and Bimodal P300s: Could Bimodal P300s Boost BCI Performance?
Abstract
The P300 is a positive peak in EEG occurring after presentation of a target stimulus. For brain-computer interfaces (BCIs), eliciting P300s by tactile stimuli would have specific advantages; the display can be hidden under clothes and keeps the user′s gaze free. In addition, robust classification is especially important for BCIs. This motivated us to investigate P300s in response to tactile and visual stimuli unimodally and bimodally. Tactile stimuli were delivered by tactors around the participant′s waist. Visual stimuli were flashed circles on a monitor, schematically representing the tactors. Participants attended to the vibrations and/or flashes of a ‘‘target’’ presented in a stream of standards. The P300 amplitude for the different modalities was comparable in size and depended on electrode location. Classification accuracy was highest in the bimodal condition. We conclude that bimodal stimuli could enhance classification results within a BCI context compared to unimodal presentations.
1. Introduction
Brain-computer interfaces (BCIs) enable users to control a system without using their muscles but solely by brain signals. BCIs could be useful for “locked-in” patients, who cannot use their muscles to communicate with their environment [1–3], but are also explored for healthy people, for example, in gaming. Both for patients and healthy users, an important application area is navigation BCIs, for instance, to navigate hands-free through a virtual environment, to control a wheelchair through a real environment, or to navigate through the menus of a computer application.
Events or stimuli in the external environment elicit specific patterns in the brain that can be registered by EEG electrodes. These patterns are referred to as Event-Related Potentials or ERPs. The P300 ERP is a positive deflection in EEG that occurs approximately 300 ms after a target stimulus is presented. P300s are of specific interest for BCIs because they can be manipulated by the voluntary focus of attention without training, and they are relatively easily detectable in the EEG signal [4]. Several groups built P300 BCIs that, for instance, allow participants to spell a word [5–8], to control a wheelchair [9], to switch devices on or off in a virtual room [10], and to stop a virtual car [11]. Apart from P300s elicited by a voluntarily attended stimulus, low-level perceptual properties [12–14], rareness [15, 16], and inherent meaning [17, 18] can make a stimulus stand out from other stimuli and produce a P300. This means that P300s are both under influence of bottom-up and top-down processes.
BCIs based on visual or auditory stimuli occupy the chosen modality such that it is not available to communicate other information to the user. Therefore, applying an alternative modality to free the eyes and ears of the user is a relevant issue. A similar trend can be seen in the design of user interfaces where alternative displays are being developed to lessen the risk of visual and/or auditory overload in, for instance, car driving [19]. The use of tactile displays is one of these alternatives. Tactile displays (like the vibration function on your mobile phone) present information through mechanoreceptors in the skin. Tactile displays have also been developed to present navigation information, including vibrating belts for pedestrians [20] and vests worn by pilots [21] and astronauts [22]. Especially the torso is very suitable to process spatial information [23], because—like the proverbial tap on the shoulder—locations on the torso are automatically mapped to our body frame of reference. Another advantage of a tactile display is that the vibrating elements can be hidden by clothing. We recently developed a tactile P300-based BCI [24]. The stimuli of this BCI consisted of 2, 4, or 6 equidistantly localized vibrations around the user’s waist that could be very suitable to indicate possible navigation directions. We found that classification performance was independent from the number of presented directions and that the optimal Stimulus Onset Asynchrony (SOA) was close to SOAs of visual P300 BCIs. In the current study, our first research question is how P300s elicited by vibrations around the waist and corresponding classification performance roughly compare to visual P300s and classification performance. Therefore, we investigate P300s elicited by tactile stimuli around the waist and compare these to visual P300s with respect to their amplitudes and latencies and as a function of electrode location. Polich and colleagues compared visual and auditory P300s and found the P300 latency to be shorter for auditory than for visual targets [14, 25], and the P300 amplitude to be either larger for auditory than for visual targets [26] or smaller [14]. Modality did not seem to affect which electrode location displayed the P300 most strongly. Please note that examining the exact effect of modality alone is impossible since one never knows whether the only manipulated variable is modality or whether it is actually, for example, the saliency of the stimulus that causes the effect.
For BCIs, a high signal to noise ratio is of paramount importance since this will decrease the time needed to determine the user’s intention with an acceptable uncertainty. Possibly, bimodal stimulus presentation can alter the P300 amplitude [27] or other EEG features, therewith improving classification. Potential causes of a larger bimodal P300 could range from simple energy summation [28] to superadditive effects as recorded from multimodal cells (see for a review [29], and see [30] for some critical notes). Our second research question is, therefore, whether bimodal visuo-tactile stimuli can enhance P300 detection compared to unimodal stimuli.
As in [24], we used small vibrators (called tactors) arranged around the waist to deliver tactile stimuli. A computer monitor delivered visual stimuli. The visual display was a schematic, top-down depiction of the tactor arrangement with flashing instead of vibrating tactors. Stimulus timing was the same in both modalities. In the bimodal condition, matching visual and tactile stimuli were delivered simultaneously.
2. Methods
2.1. Participants
Five female and three male volunteers participated in this study (age 21 to 32). They were all untrained and naïve with respect to the aims of the experiment. Each participant gave her or his informed consent before the experiment started.
2.2. Stimuli
Tactile (T) Participants wore an adjustable vest lined with 5 rows of 12 equally spaced tactors spanning the trunk circumference, therewith resembling the 12 hours of the clock with 12 o’clock at the frontal midline. For the current experiment, we only used some of the tactors. The seven tactors at 3 to 9 o’clock in the row at approximately navel-height were designated as the standards. The target consisted of three tactors in a column at 12 o’clock with the middle one in the same row as the standards (see for a schematic overview Figure 1(a)). During a trial, the seven standards and one target each vibrated once in random order. The vibrating time was 200 ms and the time in between vibrations was 400 ms. The tactors were custom built. They consisted of plastic cases with a contact area of 1 × 2 cm, containing 160 Hz vibrating motors. (TNO, The Netherlands, model JHJ-3; see [21] for comparable equipment and tactor layout).
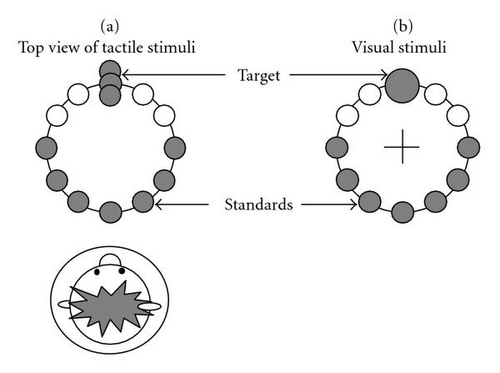
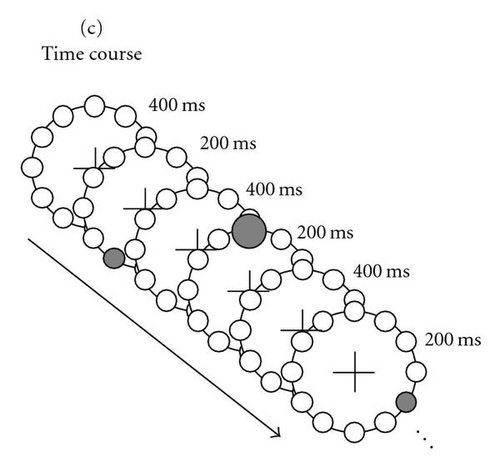
Visual (V) The configuration of tactors around the waist was schematically displayed on an LCD (Dell 20 inch flat panel, refresh rate 75 Hz) in a top-down view. A big circle represented the waist (5.2 cm diameter—corresponding to approximately 5 degrees of visual angle) and 12 small circles, one at each clock hour, represented the tactors (Figure 1(b)). The circles were black on a gray background. The viewing distance was approximately 65 cm. As with the tactile stimuli, the seven circles at 3–9 o’clock were the standards and the one at 12 o’clock was the target. During a trial, each of the seven standards and the target turned red (“flashed”) in random order. In addition, only the target increased in size. Analogous to the tactors, the circles at 1, 2, 10, and 11o’clock were not used. The timing parameters were the same as for the tactile stimuli, that is, the target and standards turned red for 200 ms with 400 ms breaks in between (see Figure 1(c)). We asked our participants to fixate a cross in the center of the schematically displayed waist. The stimulus configuration was small enough to be able to clearly see the flashes while fixating.
Bimodal (B) Corresponding visual and tactile stimuli were presented simultaneously.
2.3. Task and Procedure
Participants sat on a stool in a dimly lit, shielded room in front of the monitor, wearing the tactile vest and an EEG electrode cap. During the recording, an analog noise generator produced pink noise in order to mask any sound of the tactors. For consistency, the pink noise was also present in the visual conditions.
Participants were asked to simply pay attention to the 12 o’clock target (whether tactile, visually, or bimodally presented) and ignore the standards without making any movements. In all conditions, participants were instructed to fixate the fixation cross in the center of the schematically displayed waist (which was also the center of the screen) during the trials. Each trial lasted 4800 ms. Blinking was allowed during the 3084 ms breaks between trials, indicated by the disappearance of the fixation cross. When a participant accidentally blinked during a trial (as determined by the EOG signal exceeding a threshold of 50 μV), a warning message was displayed. The data of that trial were not used and a replacement trial was added.
2.4. Design
Each participant completed two sessions consisting of three blocks: a tactile, visual, and bimodal block. Each block contained 50 valid trials (i.e., trials without blinks). The order of the blocks in a session was randomized. All six blocks were finished after each other with short 1- to 5- minute breaks in between blocks.
2.5. Recording Materials
EEG activity was recorded at the Fz, Cz, Pz, and Oz electrode sites of the 10–20 system [31] using electrodes mounted in an EEG cap (g.tec medical engineering GmbH). A ground electrode was attached to the forehead. An electrode close to the upper part of the outer canthus of the right eye and an electrode close to the lower part of the outer canthus of left eye recorded blinks and eye movements (Kendall Neonatal ECG electrodes from Tyco Healthcare Deutschland GmbH). The EOG electrodes were referenced to each other whereas the EEG electrodes were referenced to an electrode on the right mastoid. The impedances of all electrodes were below 5 kΩ. EEG and EOG data were sampled with a frequency of 256 Hz and filtered by a 0.5 Hz high pass-, a 30 Hz low pass-, and a 50 Hz notch filter (USB Biosignal Amplifier, g.tec medical engineering GmbH).
2.6. Analysis
We analyzed EEG data offline from 200 ms before stimulus onset until 800 ms after stimulus onset. In order to remove outliers that could distort the average EEG, trials with signals exceeding 80 μV at any time during the trial were discarded; this concerned a total of 47 out of 2550 trials.
We calculated the following three dependent variables: P300 latency, P300 amplitude, and the absolute difference between the target and distractor traces. To calculate the latency and the amplitude of the P300, we first looked for the peak value of the EEG signal between 250 and 580 ms after target onset. P300 latency was defined as the latency (in ms after target onset) of that peak. P300 amplitude was defined as the difference between the target signal and the average signal for the seven standards at P300 latency. Note that by defining the P300 amplitude in this way, P300s that the standards might elicit are subtracted from the target P300 amplitude. Visual inspection of the averaged signals suggested that target stimuli did not only elicit P300s. Most notably, they also caused a later more negative component in the EEG signal. Thus, for each trial we also computed the absolute difference between the target curve and the average standard curve from stimulus onset until 800 ms after stimulus onset as a dependent variable.
As mentioned in the introduction, the preferred way of analyzing EEG data for BCIs is using a classification technique. For the classification analysis we used EEG epochs of 154 samples, starting at stimulus onset and ending 600 ms after. Each of these epochs was downsampled by averaging over consecutive sets of 10 samples, resulting in 15 features per epoch. Since we used four electrodes, the total length of the feature vector belonging to one stimulus is 60. The task of the classification model is to indicate which of the eight feature vectors corresponding to one trial (one target and seven standards) most probably belongs to the target. For each participant and each condition, we performed a cross validation using linear discriminant analysis (PRTools4, [32]), following the leave-one-out method. This entails training a model on the feature vectors of all trials except for one. The resulting model is applied to the trial that was left out for training. Either the model correctly indicates which of the features belongs to the target, or the model makes an error. This procedure is repeated for each trial, and a percentage correct is derived. In addition, we computed percentages correct when the model is decided after more than one trial, that is, on the basis of N feature vectors belonging to the target and N times 7 feature vectors belonging to the standards, where N was 2 to 10. For this, the model was trained on all data minus the N trials. After applying the model to the N test trials, we normalized the probabilities of feature vectors corresponding to the target for each of the trials. These normalized probabilities were summed over the N trials, and the tactor corresponding to the highest probability value was indicated as the target.
In the classification analysis as described above, we use epochs that are longer than the ones containing only the P300. The classification model may thus use any other difference in the EEG elicited by targets and standards. To estimate the information content of the epochs containing the P300 and epochs of the same length before and after that, we repeated the classification analysis (only for deciding after one trial and ten trials) on epochs from 50 to 300 ms, 300 to 550 ms, and 550 to 800 ms after stimulus onset.
We used repeated measures ANOVAs with electrode site (Fz, Cz, Pz, Oz) and condition (tactile, visual, bimodal) as independent variables to test for effects on the P300 amplitude, latency, and absolute difference. Another repeated measures ANOVA with only condition as independent variable was performed on percentages correct as derived from the classification analysis. Two final ANOVAs were performed on the percentages correct of the classification results using different epoch lengths, with epoch timing (before, during, or after the P300) and condition as independent variables; one ANOVA for deciding after one trial and one for deciding after ten trials.
3. Results
3.1. EEG Signals
Figure 2 gives an impression of the individual participant data. Depicted are the average Pz EEG samples from 200 ms before stimulus onset until 800 ms after, for the different conditions (encoded by the colors) and separately for target and standard presentations (solid and dashed curves, resp.). Pz is a location where the P300 is usually strongly displayed (e.g., [25, 33, 34]). Participants′ data vary considerably, reinforcing the general notion that for BCIs, the evaluation of EEG data should be tailored to the individual user. However, it is clear that for all participants, our tactile stimuli elicit P300s, and at least as well as our visual stimuli do. Figure 2 also shows that for most participants, the P300 occurs later than 300 ms after target onset, which has been reported by many authors before (e.g., [33, 35, 36]).


Figure 3 presents the grand averages for the four electrode sites. The EEG signal clearly varies between sites. For all conditions, the P300 seems weak at Fz, and strong at Pz. The relative size of the visual and tactile P300 amplitude depends on electrode location: tactile P300s tend to be larger than visual P300s except at Oz. Bimodal stimuli do not yield much stronger P300s than the next strongest unimodal stimulus. Oz shows an early positive peak for visual and bimodal stimuli. Cz and in a lesser degree Fz show a rather early negative component for tactile targets only.

The statistical analysis of the P300 amplitude (Figure 4(a)) indicates a significant effect of electrode site (F(3,21) = 7.34, P < .01), no main effect of condition (F(2,14) = 0.84, P = .45) but an interaction between condition and electrode site (F(6,42) = 3.54, P < .01). This interaction shows that the electrode site affects tactile and visual P300 amplitudes differently; the amplitude for the tactile condition is significantly higher than for the visual condition at Fz (P < .01) and Cz (P < .01) but not at other locations (the trend going the other way at Oz).
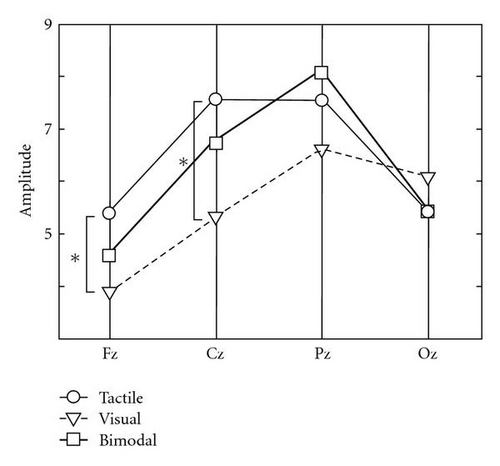
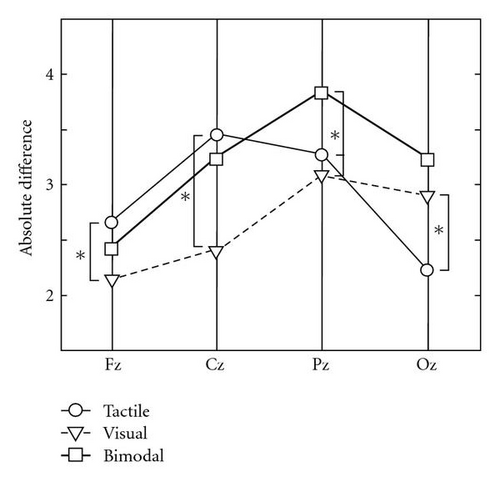
Figure 4(b) shows the average absolute difference between the standard and target signals for each electrode site and condition. The pattern of results is similar to the results of the amplitude data, but for this measure, the repeated measures ANOVA also indicates a significant main effect of condition (F(2,14) = 4.40, P = .03 with mean values of 2.90, 2.64, and 3.18 for tactile, visual, and bimodal, resp.) besides a significant effect of electrode site (F(3,21) = 7.03, P < .01) and an interaction between condition and electrode site (F(6,42) = 7.48, P < .01). The post hoc test indicated that the absolute difference in the bimodal condition was significantly larger than both unimodal conditions at Pz (tactile: P = .01, visual: P < .01). Similar to the amplitude, absolute difference was significantly higher for the tactile condition than for the visual condition at Fz (P = .02) and Cz (P = .01) and (for this variable time significantly so) smaller at Oz (P < .01).
For both the amplitude and the absolute difference, the different effect of condition for Oz compared to the other electrode sites is most conspicuous. Whereas amplitude and absolute difference are, or tend to be, larger in the tactile than in the visual condition at Fz, Cz, and Pz, it is, or tends to be the other way around for Oz (Figures 4(a) and 4(b)).
P300 latency was not significantly affected by our independent variables.
3.2. Classification
Figure 5(a) shows the average classification accuracy after 1 up to 10 trials for epochs from stimulus onset until 600 ms thereafter. Accuracy gradually increases with the number of trials up to 100% for the bimodal condition. After only one trial, classification accuracy between participants ranged from 47% to 70% in the tactile condition, 44% to 68% in visual, and 47% to 83% in the bimodal condition. Chance performance is 12.5%. A repeated measures ANOVA on classification performance after one trial indicated a significant effect of condition (F(2,14) = 6.30, P = .01). Post hoc tests indicate that visual and tactile do not differ from each other (P = .97) but that the bimodal condition differed from each of the unimodal conditions (P-values <.01).
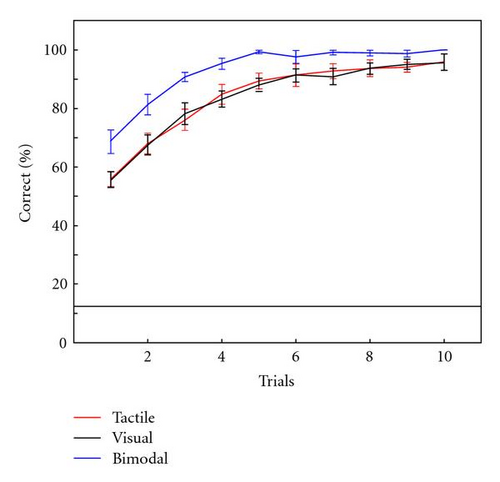
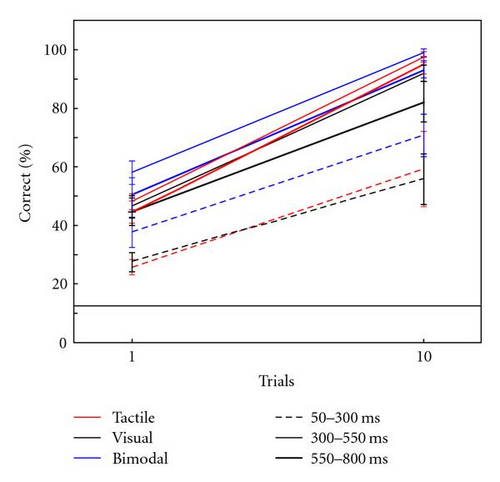
Figure 5(b) shows the average classification accuracy after one trial and ten trials, for different 250 ms epochs before the P300 (50–300 ms from stimulus onset), during (300–550 ms) and after (550–800 ms). All results are above chance level. A repeated measures ANOVA on the classification results after one trial indicated a significant effect of epoch timing (F(2,14) = 19.66, P < .01) and condition (F(2,14) = 5.06, P = .02). There was no interaction (F(4,28) = 0.38, P = .82). Post hoc tests indicate that the results for the early epoch are worse than both other epochs (P-values <.01), but the middle and late epochs do not significantly differ. For the first two epochs, post hoc tests indicate that classification accuracy in the bimodal condition is higher than in either unimodal condition (P-values <.03). A repeated measures ANOVA on the classification results after ten trials indicated a significant effect of epoch timing (F(2,14) = 20.10, P < .01). As was the case for classification results after one trial, post hoc tests indicate that the results for the early epoch are worse than both other epochs (P-values <.01), but the middle and late epochs do not significantly differ. There was no main effect of condition (F(2,14) = 2.36, P = .13) and no interaction (F(4,28) = 0.44, P = .78).
4. Discussion
With the present study we wanted to answer the questions as to whether tactile stimuli around the waist elicit reliable P300s in rough comparison to visual stimuli, and whether bimodal visuo-tactile stimuli result in stronger P300s that can be detected more accurately than unimodal stimuli. We showed that our tactile stimuli around the waist produce amplitudes that were generally larger than for the visual stimuli used in this study (significantly so for Fz and Cz). Also, the absolute difference between the EEG signal from the onset of the target until 800 ms later compared to the EEG signal from the onset of the standard until 800 ms later was similar or larger for tactile stimuli than for visual stimuli. Classification accuracy was about the same in the tactile and visual conditions. Thus, we can conclude that the effect of attending to tactile targets on the waist can be at least as strong as attending to the visual targets used in our experiment (see below for further notes on comparing between modalities). Oz was the only electrode site where the effects were, or tended to be, stronger for visual than tactile stimuli. Figure 4 suggests a continuum of the effects with the visual P300 increasing from frontal to occipital, tactile P300 peaking around the central electrode, and bimodal P300 lying more or less in between. P300 latency roughly mirrored P300 amplitude.
At Pz the absolute difference was significantly larger for the bimodal condition compared to both unimodal conditions. Whereas presenting bimodal stimuli may thus make the P300 stand out somewhat more, the improvement does not approach something like a sum of the tactile and visual signals. Still, bimodal presentation of the stimuli offers a clear advantage for classification, especially after a small number of trials. After one trial, the model is correct in 56% of the cases in the unimodal conditions and 67% in the bimodal. Our classification analysis using different epoch timing suggests that classification is probably not based on the P300 alone, especially the later part contains information that can help distinguishing between targets and nontargets.
In an experiment similar to ours, Aloise et al. [37] found that target versus nontarget presentations were easier to classify for visual stimuli than for vibrotactile stimuli delivered to the hand. As these “conflicting” results show, it is not the case that one or the other modality will always produce the clearest P300. This is also suggested by the results of Polich and colleagues [14, 26] who found differential results as to whether auditory or visual P300 amplitudes were larger. One difference between the present study and [37] was the inter stimulus interval used. Though in our study, the inter stimulus interval of 400 ms was already short compared to previous tactile P300 experiments, in [37] 150 ms inter stimulus intervals were used. Short breaks in between stimuli could make it more difficult to distinguish between tactile standards and targets whereas visual stimuli are not so much adversely affected (see also the differential effects of target-to-target interval on auditory and visually elicited P300s in [38]). Probably more important for the different results in both studies are the different eye fixation instructions that the participants received [39]. In our study, we instructed participants to fixate a cross that was presented in the center of the schematically displayed waist in all conditions. In [37] participants were not instructed with respect to eye movements so that they probably fixated the known location of the visual target. A recent study on the differential effect of covert and overt attention on the P300 [39] indicates that this probably enhanced the visual P300 and therewith made it less comparable to the tactile P300 since there is no equivalent for visually fixating in the tactile modality.
As mentioned in the introduction, both top-down and bottom-up attention can generate a P300. Polich [38] proposed that these different causes correspond to different P300 subcomponents, with the P300a originating from bottom-up driven attention and the somewhat later P300b originating from more top-down processes. In the current experiment, where we aimed to compare P300s elicited by visual, tactile and bimodal stimuli, we made use of both of these kinds of attention to boost the P300. Thus, not only did we ask participants to attend to the target stimulus, but also the target differed from the standards. One of our recent experiments [24] showed that tactile stimuli around the waist also elicit P300s when target and standards are alike and participants can choose their own target, which would be necessary when using tactile stimuli in P300-based BCIs.
Because previous studies showed that bimodal stimuli strongly enhance certain (early) EEG components [29, 40–44], one could have expected a stronger bimodal enhancement on the P300 than that indicated by Figures 3 and 4. However, we probably strengthened the stimulation intensity by presenting the stimuli bimodally; not only of the targets, but also of the standards. Because we defined the P300 amplitude as the difference between the target and standard EEG traces, bottom-up stimulus enhancement of both target and standards may not have enlarged the P300 amplitude. Nakajima and Imamura [45] showed that for tactile electrical stimuli, stimulus intensity did increase the amplitudes of the P300s, but not the difference in response to the target and standard. This suggests that the bimodal enhancement that we did find is caused by top-down effects. That the enhancement is small may be due to the possibility that participants could have attended to only one of the modalities. Talsma et al. [43] found that only when participants attended to both a stimulus′ audio and visual modalities, a superadditive effect on the P50 occurred. It is generally assumed that for multisensory integration to occur, stimuli should coincided in time as well as in space ([29], although see [46] for an example of multisensory integration for stimuli that are not colocated). The “bimodal” stimuli used in the present study are cooccurring in time and are representing the same symbolic direction, but they are spatially disparate (i.e., on the waist and on the computer screen), possibly preventing a rapid and early integration. Further improvement of bimodal presentation may be expected when both modalities are also physically colocated.
Although the average EEG plots and dependent measures did not suggest a very strong enhancement of the P300 by presenting the stimuli bimodally at individual electrode locations, classification performance was clearly supported by bimodal presentation. The main reason probably is that classification analysis is not restricted to only the use of the P300. It uses all differences between target and standard EEG traces, specifically adjusted to the individual participant.
Looking at the average traces (Figure 3), several non-P300 components seem to differ between targets and standards. At Oz, positive rather early peaks followed by negative peaks appear for the visual and bimodal targets. Since they are measured over the visual cortex and only when visual stimuli are presented, we hypothesize that these components reflect lower level visual processes. At Cz, there is a negative peak only for tactile targets. Very prominent and present at all electrodes for all conditions is a target negativity occurring after the P300. This difference could be used to distinguish between targets and standards as shown by our epoch classification analysis. Samples between 550 and 800 ms resulted in (almost) as high classification accuracy as the epoch around the P300 (i.e., between 300 and 550 ms). Several P300 papers show a similar difference between targets and standards [10, 18, 47–49]. However, though the figures show a negativity after the P300 for targets versus standards, none of the authors comment on the effect. One possible explanation might be that after target presentation, alfa activity increases (see [50–52] for relations between rhythmic EEG activity and attended versus ignored events). However, the effect looks more like a sustained negativity rather than a 12 Hz wave.
Importantly, and as Allison and Pineda already mention in their 2006 paper [53], these results stress the existence and importance of non-P300 components in differentiating between targets and standards. Since most authors provide their classification algorithms with potentially more information than just the P300, many so-called P300 BCIs do not need to exclusively rely on the P300. As also suggested by [6], when fixation is not controlled for, early visual evoked potentials are probably important features in visual BCIs.
In conclusion, EEG sampled after presenting a conspicuous tactile target can be well distinguished from tactile standards by linear discriminant analysis. Thus, vibrotactile stimuli around the waist are potentially suitable for P300-based BCIs, confirming recent results [24]. The advantages of the tactile modality over the visual or auditory modality are that tactile stimuli can remain unnoticed by others and keep the user’s eyes and ears free. The kind of tactile stimuli used in this study would especially be suitable for communicating spatial information, such as desired directions of movement, since they map naturally to 2D or even 3D space. Visuo-tactile presentations slightly enhanced the P300 compared to stimuli presented unimodally. Classification accuracy in the bimodal condition was substantially higher, especially after few target presentations. This means that adding tactile stimuli to an existing visual BCI may be beneficial. Further study is required to investigate the interaction between modality and attention, the role of multimodal congruency in space and time, and the effects of early sensory integration.
Acknowledgments
Thanks are due to Roy Raymann, Antoon Wennemers, and Wouter Vos. The authors gratefully acknowledge the support of the BrainGain Smart Mix Programme of the Netherlands Ministry of Economic Affairs and the Netherlands Ministry of Education, Culture, and Science.


