Tumors in Brown Bullheads in the Chesapeake Bay Watershed: Analysis of Survey Data from 1992 through 2006
Abstract
Liver and skin tumor prevalences in brown bullheads Ameiurus nebulosus have been used in the North American Great Lakes to designate highly contaminated areas of concern and monitor their recovery. Here we interpret the results of six surveys conducted in the Chesapeake Bay watershed between 1992 and 2006, with data for 647 fish. The objective has been to develop an adequate database to critically evaluate the use of tumor prevalence as a habitat quality indicator within the watershed. Surveys featured randomized fish collection; recording of sex, length, weight, and age; and histopathology of all livers and all raised skin lesions. The Bayes information criterion was used to analyze all possible combinations of age, gender, length, and weight as covariates for logistic regression. Length and gender were the covariates that best described liver tumor prevalence. There were no covariates in the model for skin tumor prevalence. In some surveys, biomarkers, such as biliary polynuclear aromatic hydrocarbon (PAH)-like metabolites, hepatic cytochrome P450 activity, and hepatic DNA adducts, were used with sediment and tissue chemistry data to evaluate classes of chemicals as likely contributors to tumor prevalence. We highlight two surveys of the Anacostia River, Washington, D.C. (average = 55% liver tumors, 23% skin tumors), where sediment PAHs, biliary PAH-like metabolites, and hepatic DNA adducts were high, suggesting that PAHs play a major role. We show that logistic regression is an appropriate procedure for comparing “contaminated” versus “reference” locations, and we evaluate the utility of tumor surveys as an environmental indicator for the Chesapeake Bay watershed.
The prevalence of tumors in wild fish has been used as an indicator of environmental quality in saltwater (Myers et al. 1990, 1994, 2003; Vogelbein et al. 1990) and freshwater (Baumann et al. 1991, 1996; Smith et al. 1994) ecosystems. Environmental managers in the Laurentian Great Lakes have used tumor prevalence as a criterion for identifying contaminated areas of concern. The brown bullhead Ameiurus nebulosus has been the most frequently used freshwater species in North American tumor surveys. This is attributable to its bottom-dwelling nature and propensity to develop liver tumors and highly visible orocutaneous tumors presumptively arising in response to chemical carcinogens. Its utility as an environmental indicator is enhanced by a home range estimated at only 0.5–2.1 km (Sakaris et al. 2005). Baumann et al. (1996) summarized Great Lakes brown bullhead tumor data and reported that liver tumor prevalence exceeding about 9% and skin tumor prevalence exceeding about 20% were nearly always observed in chemically contaminated areas. Baumann (2002) suggested criteria of about 5% liver tumors and 12% skin tumors for distinguishing highly contaminated areas of concern from the less contaminated areas of recovery.
For liver tumors in fish, the strongest evidence for chemical etiology exists for polynuclear aromatic hydrocarbons (PAHs; e.g., Vogelbein et al. 1990; Baumann et al. 1991; Myers et al. 2003, 2008; Vogelbein and Unger 2006). Experimental studies demonstrated a cause-and-effect relationship between PAHs and liver tumors or preneoplastic lesions (e.g., Metcalfe et al. 1988; Hawkins et al. 1990). A linkage between sediment PAHs and liver tumors was established by Baumann and Harshbarger (1998) from surveys conducted in the 1980s and 1990s with brown bullheads in the Black River, Ohio. They observed that tumor prevalence increased and decreased according to changes in sediment PAH concentrations.
Skin tumors in brown bullheads have been induced by repeatedly painting the skin with sediment extracts containing high PAH concentrations (Black et al. 1985). Baumann et al. (1996) reported that higher oral and cutaneous tumor prevalence occurred in PAH-contaminated Great Lakes tributaries compared with reference sites. Grizzle et al. (1984) observed an increased prevalence of papillomas in black bullheads A. melas exposed to chlorinated wastewater effluent, and prevalence decreased when chlorination was lowered. Poulet et al. (1994), however, noted the occurrence of orocutaneous tumors in 94 brown bullheads collected from 17 locations (both contaminated and uncontaminated) in New York State. They found that the distribution of lesions did not suggest a strong correlation with exposure to chemical carcinogens. Bunton (2000) concluded that although skin tumors in brown bullheads are associated with bottom dwelling, feeding, and contact with contaminated sediments, other factors may also be involved. To date, no virus has been identified as a causative agent for brown bullhead skin (or liver) tumors.
Biomarkers are physiological, biochemical, or histological changes used as indicators of chemical exposure, effects, or both. Because fish rapidly metabolize PAHs (Krahn et al. 1986), researchers use biomarkers rather than tissue concentrations as indicators of exposure and response. Detection of PAH-like metabolites in bile indicates recent exposure on the order of days (Collier and Varanasi 1991). The presence of a diagonal radioactive zone (DRZ) on chromatograms of liver DNA results from polycyclic aromatic compounds, PAHs, and nitro-PAH compounds, forming adducts with DNA. These adducts represent the interaction of carcinogenic metabolites with DNA nucleotides that occur as molecular events in the early stages of carcinogenesis. Moreover, adduct concentrations are useful as a biomarker of response to PAH exposure (Reichert et al. 1998).
Since 1992, the U.S. Fish and Wildlife Service (USFWS) Chesapeake Bay Field Office has been conducting brown bullhead tumor surveys and biomarker studies in the Chesapeake Bay watershed, where the species occurs in fresh and tidal waters up to about 8‰ salinity. The objectives have been to establish tumor prevalence as an indicator of habitat quality in the watershed, gather evidence of the effects of chemical stressors, and ultimately to monitor the success of cleanup efforts. In this paper, we summarize and interpret the results of six surveys. We analyze effects of covariates, such as age, length, and sex; compare tumor prevalence among locations at a standard age or length; and evaluate the utility of tumor surveys as an environmental indicator for the Chesapeake Bay watershed.
Methods
Study areas and sampling methods
U.S. Fish and Wildlife Service tumor survey locations in the Chesapeake Bay watershed (Pinkney et al. 1995, 2001, 2004a, 2004b; Pinkney and Harshbarger 2005, 2008) are mapped in Figure 1. The motivations for these studies were either anecdotal evidence of brown bullheads with raised lesions, knowledge of sediment contamination or water quality concerns, or both. The first survey (1992) sampled Farm, Neabsco, and Marumsco creeks near Featherstone National Wildlife Refuge along the tidal Potomac River about 40 km downriver from Washington, D.C. Later studies have focused on rivers in and near Washington, D.C., and Baltimore, Maryland (Pinkney et al. 2001, 2004a, 2004b). In 2005, a survey was conducted in the South River near Annapolis, Maryland, an area undergoing rapid suburban development (Pinkney and Harshbarger 2005). In 2006, two locations in the Little Blackwater River were surveyed: upstream of and within the boundary of Blackwater National Wildlife Refuge (Pinkney and Harshbarger 2008). The upstream location receives stormwater runoff from Cambridge, Maryland. In three of the surveys, the Tuckahoe River, which flows through a watershed dominated by agricultural and forested land use, was designated as a reference location.
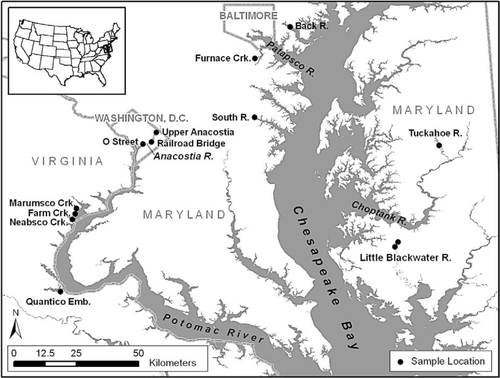
Map of the brown bullhead collection locations.
Fish were sampled using electroshocking boats, fyke nets, and eel traps and by angling. In the initial study (Pinkney et al. 1995), the minimum total length was 280 mm; thereafter, it was 260 mm, with one exception: the Pinkney et al. (2004b) study specifically tested tumor prevalence and biomarkers in two size-classes, 260 mm or larger and 150–225 mm. In all surveys, fish were collected randomly (i.e., no selections were based on external appearance), transported in aerated site water to the USFWS laboratory, and held (without feeding) for up to 2 d until necropsy.
Laboratory procedures
Brown bullheads were measured for total length (mm), weighed (g), euthanatized by severing the spinal cord, and necropsied. Condition factor (K) was determined ([weight × 105]/length3; Carlander 1969). Histopathology was performed on all livers and all raised external lesions. These were usually associated with the mouth, often on the dental ridge (Figure 2), and less frequently on the ventral portion of the operculum. Internal organs were exposed by a longitudinal, ventral abdominal incision, and the liver was excised. Gender was determined and recorded. Livers were weighed, and the hepatosomatic index (HSI) was calculated as liver weight divided by body weight. Four blocks of hepatic tissue cut from each liver by scalpel were placed in a numbered cassette and submerged in a dedicated bottle containing a 10% solution of buffered neutral formalin. As most external lesions were too hard to cut by scalpel due to underlying bone, intact lesions with adjacent tissue were cut from the fish with a bone cutter. After fixation, bone was decalcified with formic acid, the softened tissues were cut, and tissue blocks were placed in cassettes.
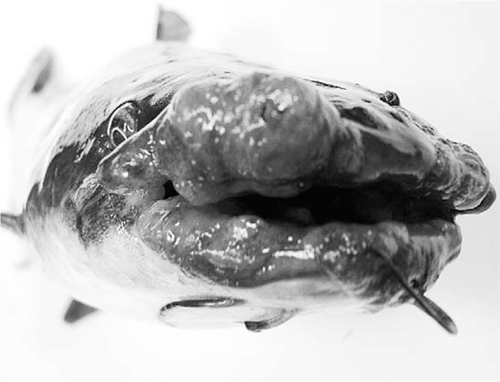
Mouth lesions on a brown bullhead from the South River, Maryland, later diagnosed as squamous cell carcinomas.
Cassettes containing the fixed tissues were shipped to a processing laboratory, where they were dehydrated, infiltrated with paraffin, and embedded in paraffin blocks. Paraffin blocks were sectioned with a microtome at 4–5 μm. Tissue sections were mounted on glass microscope slides, deparaffinized, stained with hematoxylin and eosin, coverslipped, cleaned, and labeled (Luna 1968). Finished slides were returned for pathological evaluation. The diagnostic terminology was consistent with Blazer et al. (2006, 2007). Hepatocellular neoplasms were classified as hepatocellular adenomas (noninvasive) and hepatocellular carcinomas (invasive). Neoplasms involving bile ducts were classified as cholangiomas (noninvasive) and cholangiocarcinomas (invasive). Skin neoplasms were either papillomas (noninvasive) or squamous cell carcinomas (invasive); no melanomas were diagnosed. In most studies, pectoral spines were used to age the fish according to methods described in Baumann et al. (1990).
Sediment PAH data were obtained by collecting three surface samples across the brown bullhead collection area using a petite ponar grab and analyzing the top 2–5 cm. In several studies, sediment data from other investigations were used.
The following biomarkers were analyzed: hepatic cytochrome P450, biliary PAH-like metabolites, and hepatic DNA adducts (Pinkney et al. 2001, 2004a, 2004b). In these studies, fillets from a subset of the fish were analyzed for organochlorine pesticides and polychlorinated biphenyls (PCBs).
Data analyses
Within each study, the raw tumor prevalence was summarized for each collection and location. Biological, chemical, and biomarker data were compared across locations with one-way analysis of variance or, if parametric assumptions were not satisfied after log transformation, Kruskal–Wallis tests (Sokal and Rohlf 1995). For the three studies with biomarker data, logistic regression was used to evaluate the relationship between the following predictor variables: length, weight, sex, age, K, HSI, tissue PCBs, tissue chlordane, PAH-like biliary metabolites, hepatic DNA adducts, hepatic cytochrome P450 activity, and the response variables (prevalence of liver and skin tumors). The procedures of Stokes et al. (1995) were used (see Pinkney et al. 2001, 2004a, 2004b for application).
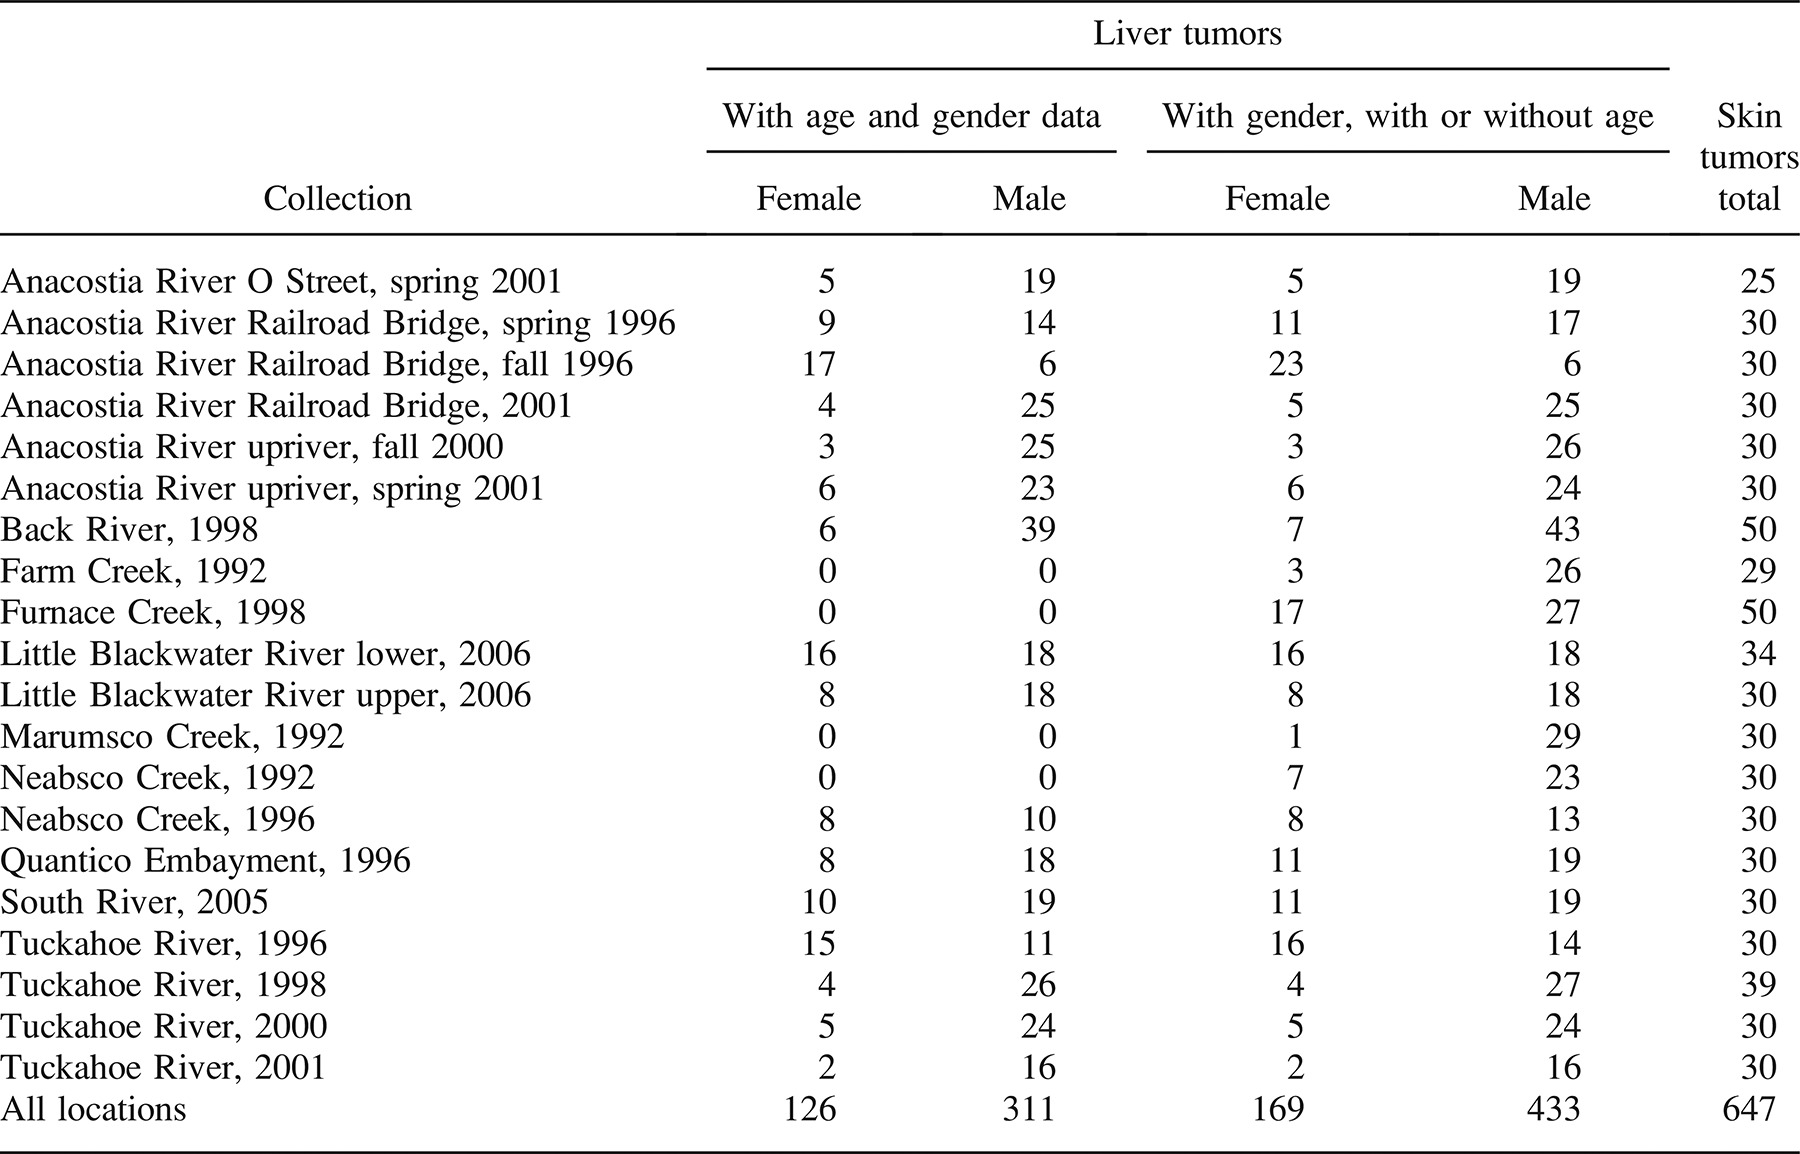
To analyze the entire database, logistic regression (Kutner et al. 2004) was used to determine which covariates best describe the prevalence of skin or liver tumors in 260-mm or larger fish. For the collections (Table 1) in which age as well as length, weight, and gender were collected, multiple regression models were estimated. For each model, the effect of each location was included as a constant term, as was gender. The remaining covariates were included as linear terms when needed. No interactions were estimated. Each model was evaluated using the Bayes information criterion (BIC; Schwartz 1978), defined as


The model with the lowest BIC can be considered the model that best fits the data with the least complexity. Models were fit to the liver tumor data and skin tumor data separately. Initially, only brown bullheads 260 mm or larger with age, length, weight, and gender recorded were considered for each model. If, for example, age was not included among the best set of covariates, then individuals lacking age data could be added to the data set (Table 1). Once the models were established, regression curves showing the influence of the covariates were constructed. Pairwise differences in geographic location for skin and liver tumor prevalence were determined by multiple logistic regression techniques and, in the case of liver tumors, by using the Firth correction (Heinze and Ploner 2003).
Results
Individual Study Findings
The raw pathological data for the 20 collections of brown bullheads 260 mm or larger and four collections of 150–225-mm brown bullheads are given in Table 2. For both skin and liver tumors, prevalence was greatest in the larger, older size-class of fish. For liver tumors, the highest prevalence was in the Anacostia River, ranging from 50% to 68%. The South River had the highest skin tumor prevalence of 53%.
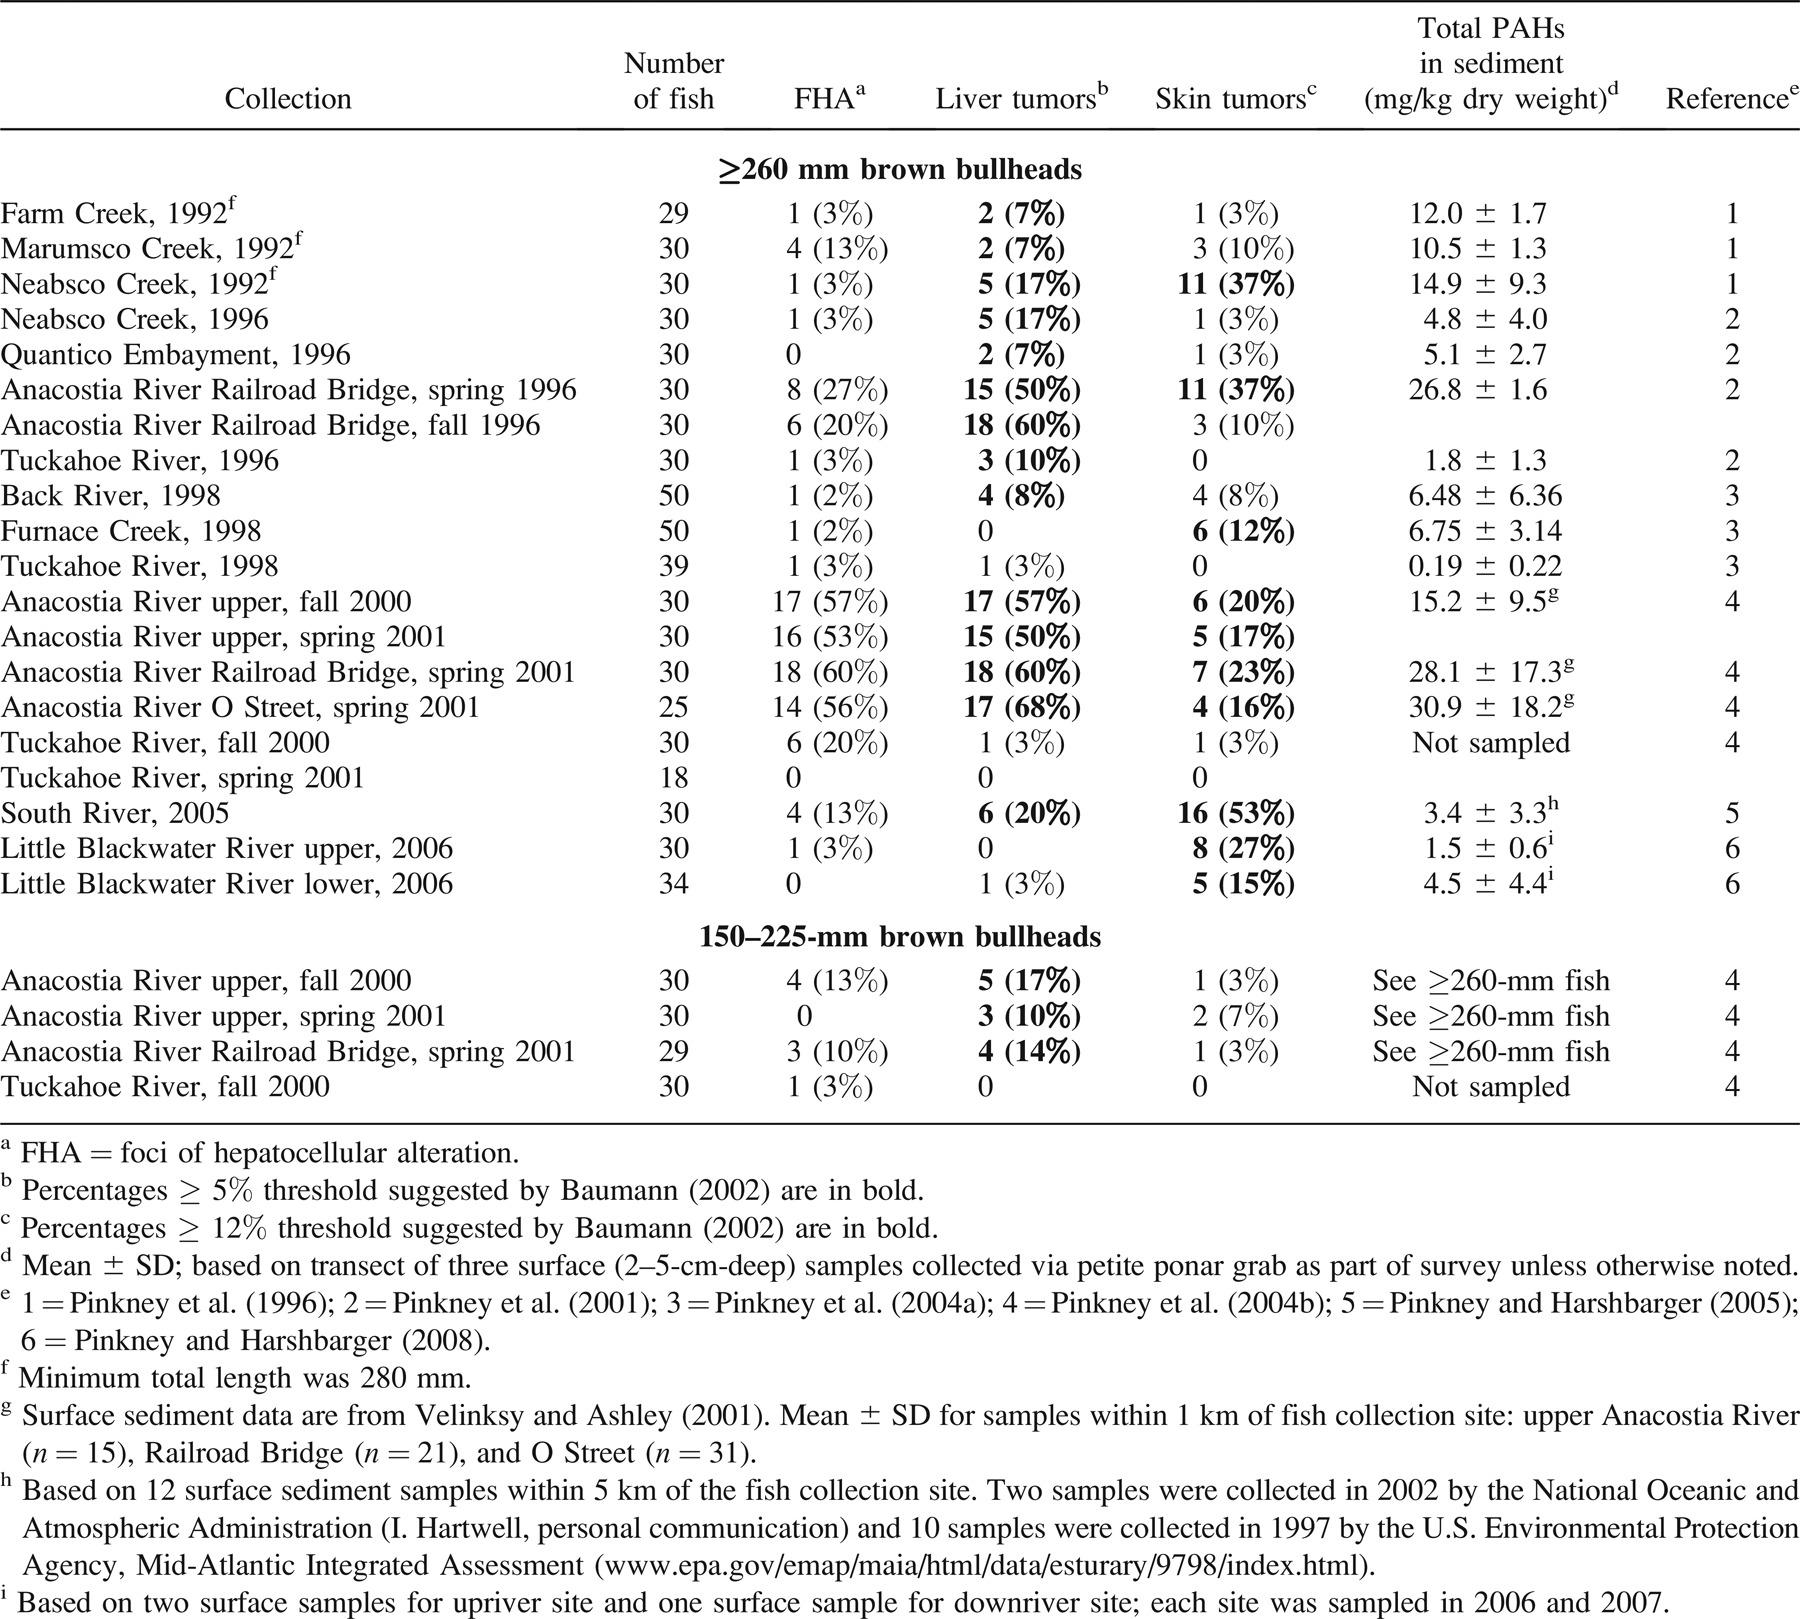
When the same river was surveyed more than once, there was great consistency in liver tumor prevalence, whereas skin tumors tended to be more variable. For example, in Neabsco Creek, skin tumor prevalence was 37% in 1992 and 3% in 1996, whereas liver tumor prevalence was 17% in both years. In the Anacostia River, skin tumor prevalence varied from 10% to 37%; liver tumor prevalence ranged between 50% and 68% and was usually between 50% and 60% (Table 2).
For the three studies that analyzed biomarkers, logistic regression indicated that the following predictor variables had significant positive associations with liver tumors: sex (being female), age, length, bile benzo(a)pyrene, bile phenanthrene, and HSI (Pinkney et al. 2001, 2004b); tissue total PCBs, tissue p,p′-DDE (Pinkney et al. 2004b); and K (Pinkney et al. 2004a). For skin tumors, the following predictor variables were significant: HSI (Pinkney et al. 2001, 2004b); age, bile benzo(a)pyrene, bile naphthalene, bile phenanthrene (Pinkney et al. 2004b); and length and weight (Pinkney et al. 2004a).
Logistic Regression Analysis of the Database
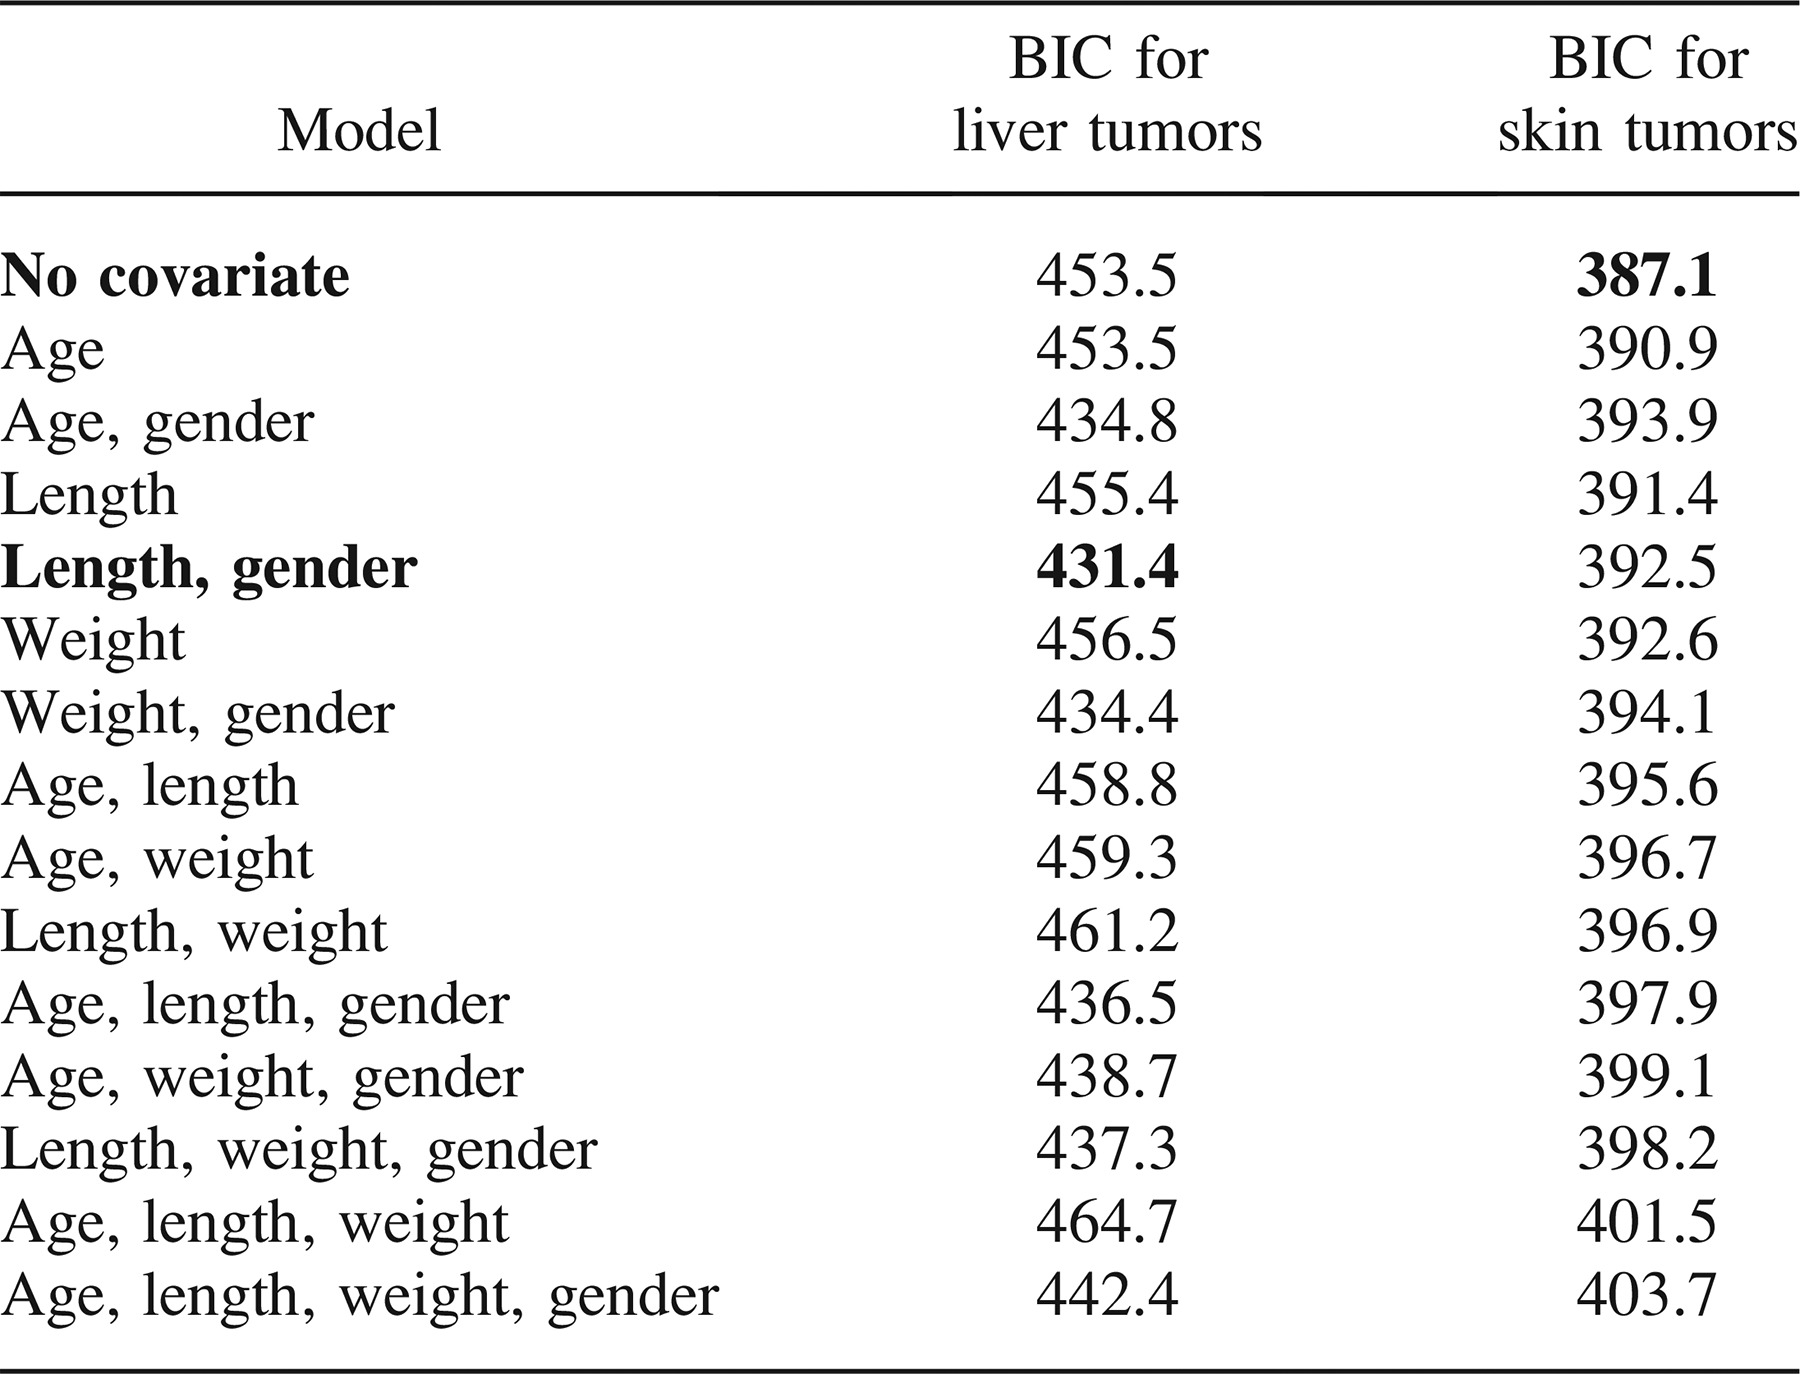
To analyze the entire database of 260-mm or larger fish, models representing 14 different combinations of covariates were fit separately to the liver and skin tumor prevalence data to determine which covariates best described the tumor prevalence data (Table 3). The database consisted of 437 aged brown bullheads from 16 collections (Table 1). For liver tumors, the set of covariates with the lowest BIC was the model that included only length and gender (Table 3). Since age was not included in the set of best covariates, additional data in which age was not determined were added to the data set. The new data set included four additional collections and 165 additional fish (Table 1). When the additional fish were included in the model, length and gender remained the best covariates (BIC range for the enlarged data set = 535.5–572.4). This larger data set, using length and gender as covariates, was examined for differences in season (e.g., Anacostia River Railroad Bridge site: spring 1996 versus fall 1996) and years (e.g., Tuckahoe River: 1996, 2000, and 2001) at a given location. Based on BIC, data could be combined across seasons and years of sampling for each location.
Compared with the Tuckahoe River reference location, all three Anacostia River locations had significantly elevated liver tumor prevalence (P < 0.001 for each; logistic regression with Firth correction). The Neabsco Creek location bordered on statistical significance (P = 0.055). Selected locations are graphed in Figure 3. Tumor prevalence in females was significantly greater than that in males (P < 0.001), as shown by the probabilities listed in Table 4 and graphed in Figure 4.
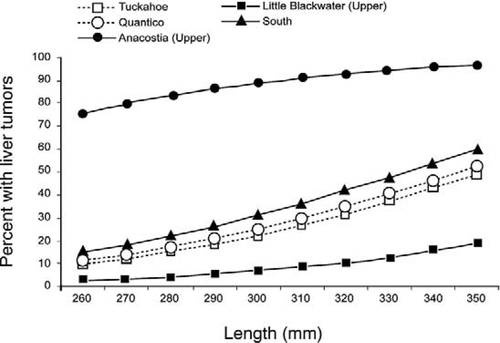
Liver tumor prevalence as a function of total length for female brown bullheads at selected Chesapeake Bay locations.
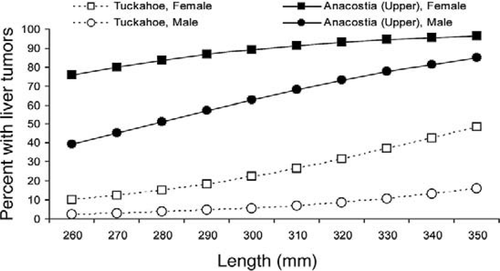
Comparison of liver tumor prevalence as a function of total length for male and female brown bullheads from selected locations.
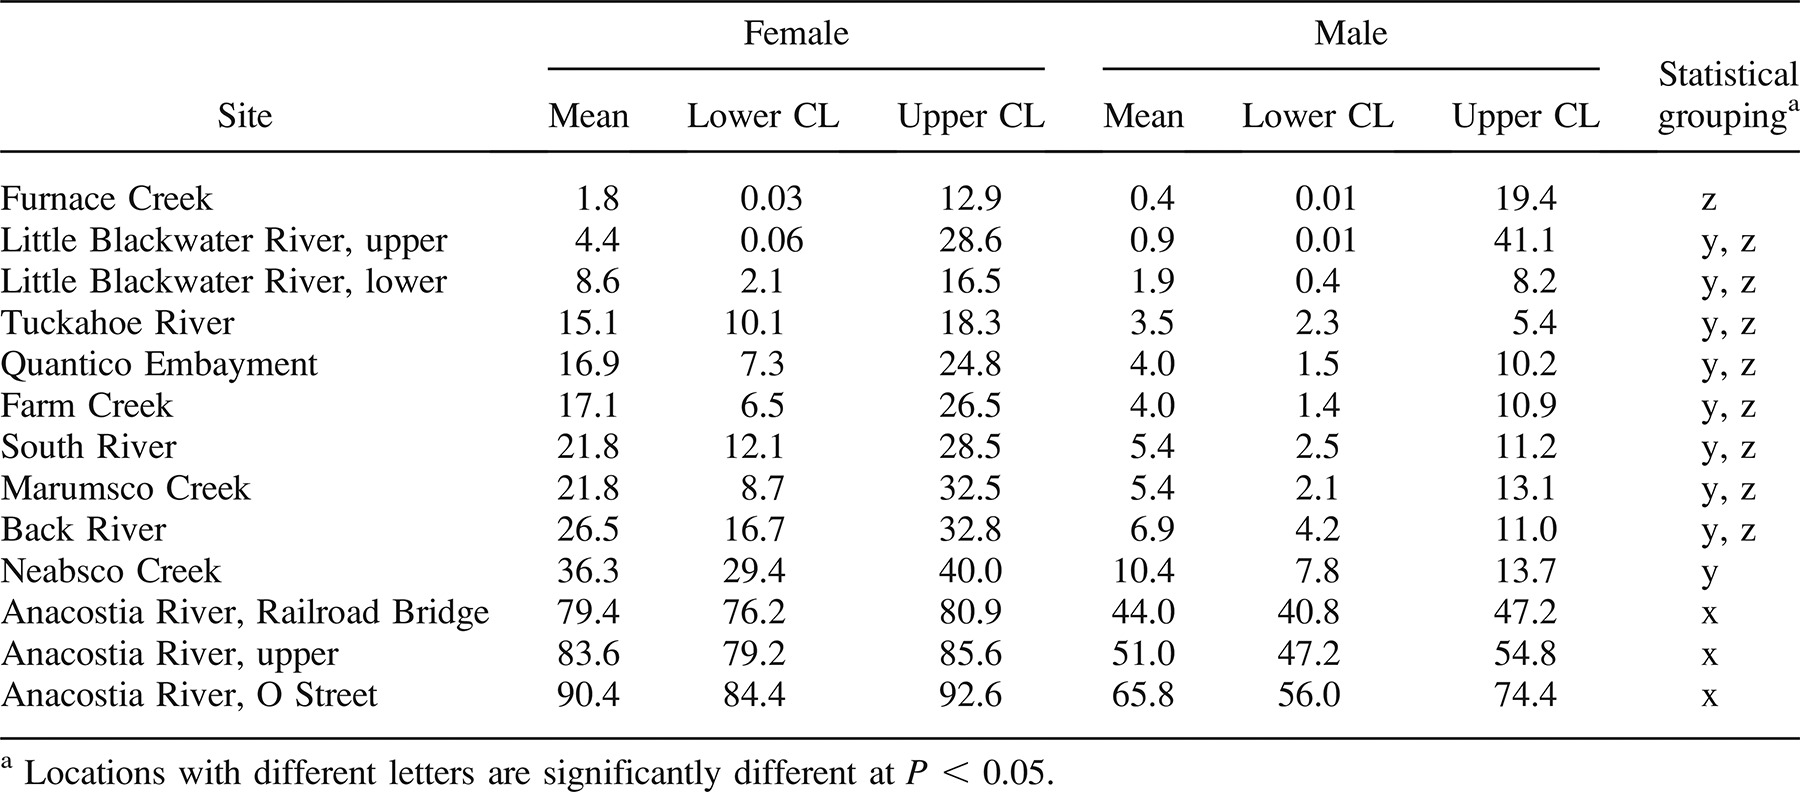
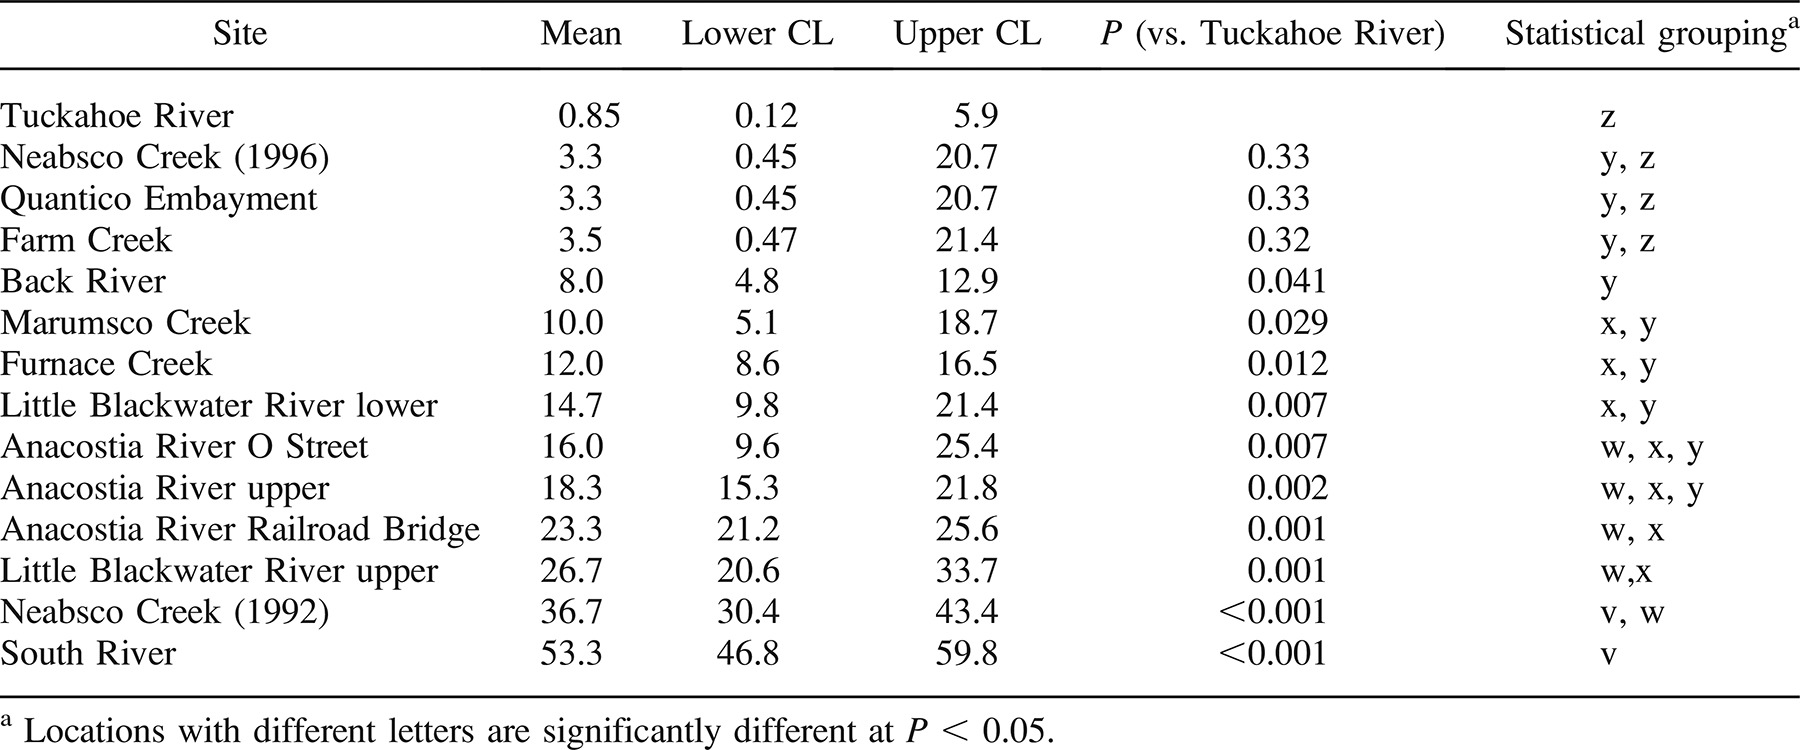
For skin tumors, BIC was lowest with the no-covariate model, so all of the 647 fish (Table 1) were included in the data set. Based on BIC, all locations could be combined across seasons and years except for Neabsco Creek, which had a great difference in skin tumor prevalence between 1992 and 1996. The probability of a brown bullhead having a skin tumor ranged from 0.85% in the Tuckahoe River to 53% in the South River. Using logistic regression, the following locations had fish with significantly elevated tumor prevalence compared with the Tuckahoe River site: Anacostia River (all sites), Little Blackwater River (both sites), South River, Back River, Neabsco Creek (1992), Furnace Creek, and Marumsco Creek (see Table 5 for P-values).
Discussion
Age, Length, and Gender
The risks of liver tumors in fish have been documented to increase with age (Baumann et al. 1990; Moore and Myers 1994). In the second Anacostia River study (Pinkney et al. 2004b), the effects of age on both liver and skin tumor prevalence were shown clearly. The 1–2-year-old brown bullheads had 10–17% liver tumor prevalence versus 50–68% in age-3 or older fish; 1–2-year-old fish had 3–7% skin tumor prevalence versus 16–23% in age-3 or older fish. In the logistic regression analysis for liver tumors, however, length and gender had a slightly lower BIC (431.4) than age and gender (434.8). This may be attributable to the rather narrow age range (2–7 years, with mostly 3–5-year-olds). Alternatively, it may result from using spines, which are less precise than otoliths and tend to underestimate the ages of larger fish (Maceina and Sammons 2006).
The lack of an age or length covariate for skin tumors in the 260-mm or larger fish was unexpected. Using similar methods, one of us (M.A.R., personal observation) found that otolith age was a significant covariate for both liver and skin tumors in brown bullheads from Lake Erie tributaries. The Lake Erie brown bullheads, however, had a greater age (2–15 years) and size (250–385-mm) range compared with the spine-aged Chesapeake Bay brown bullheads (2–7 years, 260–340 mm). Perhaps age (or length) is less of a factor in skin tumors (versus liver tumors) within the age (or length) range of the Chesapeake Bay database. A future analysis with otolith-aged brown bullheads is recommended.
Length versus prevalence curves for Anacostia and Tuckahoe River brown bullheads (Figure 4) show the higher prevalence of liver tumors in females versus males in both contaminated and reference areas. Gender effects on brown bullhead liver tumor prevalence were first reported by Baumann et al. (1990) and later by Pinkney et al. (2001). Pinkney et al. (2004b) reported a prevalence of 95% in age-3 or older Anacostia River females (18 of 19) versus 50% for age-3 or older Anacostia River males (48 of 95). Using rainbow trout Oncorhynchus mykiss, Nunez et al. (1989) first demonstrated that 17-β-estradiol promotes hepatocellular carcinoma in fish. Cooke and Hinton (1999) reported greater liver tumor prevalence in females of six fish species and theorized that endogenous estrogens serve as tumor promoters.
Relationship between Polynuclear Aromatic Hydrocarbons and Tumors
A threshold of 2.8-ppm total PAH in sediment for liver tumors in English sole Parophrys vetulus was proposed by Horness et al. (1998) using hockey stick regression. This analysis was based on 29 sediment–prevalence pairs from the U.S. West Coast. The Chesapeake Bay database has only 18 such pairs and includes sediment data from several laboratories using different analytical methods with different numbers of individual PAH compounds. The sediment total PAH concentrations, in most cases, were an average of three surface samples collected along the fish collection transect. Thus, the database was judged to be insufficient for hockey stick regression analysis. The total PAH concentrations in sediment samples near the collection locations (Table 2) ranged from less than 0.19 to 30.9 ppm. By plotting the paired data points (average total PAH concentrations and tumor prevalence), there appears to be a rapid increase in liver tumor prevalence when sediment total PAH concentrations approach 15 ppm, but no similar spike is apparent for skin tumors (Figure 5a, b). Given the patchy distribution of PAHs and the varied overlay of brown bullhead feeding sites with areas of high PAH concentrations, this analysis can only provide a rough approximation of PAH exposure. Nevertheless, the 15-ppm spike for liver tumors is consistent with calculations provided by P. Baumann (U.S. Geological Survey [USGS], personal communication), who analyzed the decline in liver neoplasm prevalence in Black River brown bullheads along with declines in sediment total PAH concentrations (Baumann and Harshbarger 1998). Baumann reported that when total PAH concentrations averaged less than 10 ppm, neoplasm prevalence dropped to background levels. On this basis, he recommended 10-ppm total PAH as a sediment remediation goal for cleanup of the Grand Calumet River (Indiana) Area of Concern.

Scatterplots of brown bullhead tumor prevalence (%) and sediment total polynuclear aromatic hydrocarbons (PAHs; mg/kg) in the Chesapeake Bay watershed: (A) liver tumors and (B) skin tumors.
From the Chesapeake Bay data set, the strongest evidence for a link between PAH exposure and liver tumors is from the Anacostia River studies (Pinkney et al. 2001, 2004b). The Pinkney et al. (2004b) paper relies on an intensive sediment chemistry survey (Velinsky and Ashley 2001). The average total PAH concentration within 1 km of each of the three brown bullhead collection locations in the Anacostia River ranged from 15.2 to 30.9 ppm based on 15–31 surface sediment samples per location. Brown bullhead exposure to sediment-bound PAHs was confirmed by biliary benzo(a)pyrene-like metabolite concentrations, which averaged 1.1–8.4 ppm in the Anacostia River versus 0.25–0.49 ppm in the Tuckahoe River reference location. Biliary PAH-like metabolites were identified as significant predictor variables for liver and skin tumors in the logistic regressions. Further evidence of response to PAHs was shown by hepatic DNA adduct concentrations averaging as high as 1,146 nmol/mol of DNA. The mean DNA adduct concentrations were 16–28 times higher in the Anacostia River compared with the Tuckahoe River (Pinkney et al. 2004b). Finally, a distinct DRZ in the Anacostia River brown bullhead DNA adduct chromatograms, which is diagnostic of polyaromatic compounds (Reichert et al. 1998), was only faintly visible in Tuckahoe River brown bullheads.
In other Chesapeake Bay tributaries, the PAH signal is weaker and the evidence for their role in brown bullhead tumors is uncertain. Most perplexing is the South River, with no industrial sources and average sediment total PAHs of only 3.4 ppm, where 53% of brown bullheads had skin tumors and 20% had liver tumors (Pinkney and Harshbarger 2005). Biomarker studies in these cases should include investigation of other types of DNA adducts, including those caused by alkylating agents, such as nitrosamines. In laboratory studies, alkylating agents have caused liver tumors in several fish species (Hawkins et al. 1995) and skin tumors in zebrafish Danio rerio (Beckwith et al. 2000).
Sampling Recommendations
The use of logistic regression to describe liver tumor prevalence as a function of length or age allows for the comparison of sampling locations regardless of the age or size structure of the sample. After the model parameters are estimated, tumor prevalence can be estimated for any age or length (Figure 3). This simplifies the sampling procedure in the field as a lack of fish in a given length- or age-class will not hinder the ability to compare locations. It also allows the effect of gender on tumor prevalence to be shared among locations, minimizing the need to consider gender when sampling.
Determining the sample size for multiple logistic regression analyses is difficult as there are no simple formulas such as those for two-sample t-tests. Simple simulations based on the data collected indicate that for studies with a limited number of samples to allocate over multiple locations and low tumor prevalence (less than 15%), higher power can be achieved by sampling reference or possible “baseline” locations more often than high-prevalence locations. As tumor prevalence increases, a balanced design in which samples are allocated equally between locations results in higher statistical power. Given the high tumor prevalence observed in the Chesapeake Bay area, a balanced design would result in a greater opportunity to detect difference among locations.
Expansion of the database should include exploration of alternate reference locations. Although the estimated skin tumor probability for a Tuckahoe River brown bullhead was only 0.85%, the liver tumor probability for a 280-mm female was 15.1%. We recommend a total sample size of at least 100 for a reference location. Both Little Blackwater River locations and Furnace Creek have lower estimated liver tumor probabilities than the Tuckahoe River. None, however, has a total sample size of over 100 fish, and all have estimated skin tumor probabilities significantly greater than that of the Tuckahoe River (Tables 4, 5).
Collections of 40–60 brown bullheads are often reasonable in terms of sampling and analysis time. Multiple collections over different years or seasons are encouraged to build the database and examine for possible temporal effects. The strict minimum size of 260 mm could be relaxed (but only to about 250 mm) by using logistic regression to generate prevalence versus length or age curves. Aging by both spines and otoliths is recommended.
Fish Tumors as an Environmental Indicator
Fish tumors are recognized as a Biological Use Impairment in the 1987 Protocol Amending the Great Lakes Water Quality Agreement of 1978 (Baumann 2002). In the Great Lakes, efforts are underway to refine the Beneficial Use Impairment by proposing specific methodologies for field and laboratory procedures, histopathological diagnoses (Blazer et al. 2006, 2007), and building a broad database from reference sites (P. Baumann, personal communication).
U.S. Environmental Protection Agency (USEPA; USEPA 2006) defined an indicator as “a numerical value derived from actual measurements of a pressure, ambient condition, exposure, or human health or ecological condition over a specified geographic domain, whose trends over time represent or draw attention to underlying trends in the condition of the environment.” Six criteria were used by the USEPA to select indicators for a National Report on the Environment: (1) importance (it makes an important contribution towards answering a question), (2) objective (it is developed and presented in an unbiased manner), (3) sound collection and quality assurance of data, (4) trends (data are available to describe changes or trends and the latest data are timely), (5) comparable across time and space and representative of the target population, and (6) transparent and reproducible (the data, assumptions, and statistical procedures are clearly stated).
The Chesapeake Bay brown bullhead database was evaluated against these criteria for suitability for indicator development. Criteria 1, 2, 3, 5, and 6 were fully met as described in this paper in the rationale for conducting tumor surveys, the random sampling, consistent laboratory methods and diagnoses (Blazer et al. 2006, 2007), and the statistical approach. The limited home range (Sakaris et al. 2005) and abundance at salinities up to about 8 g/L makes this species ideal for monitoring many Chesapeake Bay tributaries. Criterion 4, however, was only partially met. Although recent (2005 and 2006) data are included in the database, few locations (only the Anacostia and Tuckahoe rivers and Neabsco Creek) were sampled in multiple years, making it difficult to analyze trends.
Environmental managers should evaluate the current status of the brown bullhead database to determine its adequacy for designating tumor surveys as an indicator for the Chesapeake Bay Program. The database can be strengthened by sampling other Chesapeake Bay tributaries, including potential reference areas. Contaminated areas should be monitored to evaluate the status of the habitat and the success of any cleanup actions. A similar monitoring program has been applied using tumors and liver lesions in the mummichog Fundulus heteroclitus in the Elizabeth River, one of the Chesapeake Bay Regions of Concern (Vogelbein and Unger 2006).
Acknowledgments
We appreciate the assistance of Bob Foley, David Sutherland, Peter McGowan, Dan Murphy, Sheila Eyler, Mike Mangold, Peter Sakaris, Jorgen Skjevland, John Gill, Clif Tipton, and Steve Minkkinen in the field; Eric May, Craig Weedon, Larry Pieper, Ward Slacum, and Kathy Price in the laboratory; Kyle Hartman for aging the spines; Leslie Gerlich for graphics; and Elgin Perry for statistics. The comments of David Smith (USGS Leetown Science Center) and three reviewers are appreciated. Funding for the surveys was provided by the USFWS Division of Environmental Contaminants, the Anacostia Watershed Toxics Alliance, and the South River Federation. Reference to trade names does not imply endorsement by the U.S. Government.


