An Index of Biological Integrity (IBI) for Pacific Northwest Rivers
Abstract
The index of biotic integrity (IBI) is a commonly used measure of relative aquatic ecosystem condition; however, its application to coldwater rivers over large geographic areas has been limited. A seven-step process was used to construct and test an IBI applicable to fish assemblages in coldwater rivers throughout the U.S. portion of the Pacific Northwest. First, fish data from the region were compiled from previous studies and candidate metrics were selected. Second, reference conditions were estimated from historical reports and minimally disturbed reference sites in the region. Third, data from the upper Snake River basin were used to test metrics and develop the initial index. Fourth, candidate metrics were evaluated for their redundancy, variability, precision, and ability to reflect a wide range of conditions while distinguishing reference sites from disturbed sites. Fifth, the selected metrics were standardized by being scored continuously from 0 to 1 and then weighted as necessary to produce an IBI ranging from 0 to 100. The resulting index included 10 metrics: number of native coldwater species, number of age-classes of sculpins Cottus spp., percentage of sensitive native individuals, percentage of coldwater individuals, percentage of tolerant individuals, number of alien species, percentage of common carp Cyprinus carpio individuals, number of selected salmonid age-classes, catch per unit effort of coldwater individuals, and percentage of individuals with selected anomalies. Sixth, the IBI responses were tested with additional data sets from throughout the Pacific Northwest. Last, scores from two minimally disturbed reference rivers were evaluated for longitudinal gradients along the river continuum. The IBI responded to environmental disturbances and was spatially and temporally stable at over 150 sites in the Pacific Northwest. The results support its use across a large geographic area to describe the relative biological condition of coolwater and coldwater rivers with low species richness.
Introduction
We developed and tested a quantitative index of biological integrity (IBI) that is based on fish assemblages and that is applicable to rivers throughout the U.S. portion of the Pacific Northwest. First described by Karr (1981), the IBI was initially applied to Midwestern warmwater streams. Waters with biological integrity have “a species composition, diversity, and functional organization comparable to that of natural habitats of the region” (Frey 1977; Karr 1991). In an IBI, the components of biological integrity are measured along with abundance and individual health to assess the condition of fish assemblages (Karr et al. 1986; Simon 1999). Karr's original IBI consisted of 12 metrics that reflected taxonomic richness, habitat and trophic guild composition, and individual health and abundance. Since then, the IBI approach has been applied to warmwater streams and rivers throughout North America (Miller et al. 1988; Simon and Lyons 1995) and every continent but Antarctica (Hughes and Oberdorff 1999). However, the application of the IBI to coldwater rivers of the western United States has been limited (Simon 1999).
The IBI should be considered a family of related indices, rather than a single index, in view of all its permutations (Simon and Lyons 1995). Investigators have substituted metrics for the original 12 because of substantial differences in fish faunas in areas outside the Midwestern United States, while maintaining the ecological foundation of the original IBI. Until recently, metrics were typically selected on the basis of expert judgment, without evaluations of the empirical relations among metrics and between metrics and environmental variables (Hughes et al. 1998; Angermeier et al. 2000; McCormick et al. 2001). Angermeier et al. (2000) advised against building IBIs only with metrics exhibiting strong empirical relations, because such indices may lack the ecological foundation needed for detection of a broad range of human impacts. We believe both an ecological foundation and empirical relationships should underlie the construction of IBIs.
Three factors have hindered development of an IBI that is generally applicable to western coldwater rivers. First, coldwater rivers have much lower species richness than do warmwater systems. Selective extinctions in the Pleistocene are still a major factor shaping modern fish assemblages in the West (Minckley et al. 1986). In contrast, the Mississippi River drainage served as a refuge for fish, enabling them to avoid extinction and possibly leading to increased speciation. Pacific Northwest rivers typically have a fish assemblage consisting of only one to three species each of salmonids Oncorhynchus-Salvelinus-Prosopium spp., sculpins Cottus spp., suckers Catostomus-Chasmistes spp., cyprinids (dace Rhinichthys spp., redside shiner Richardsonius balteatus, and northern pikeminnow Ptychocheilus oregonensis), and lampreys Lampetra spp. In contrast, river reaches in the Mississippi drainage may contain 40–50 native species (Moyle 1994). A second complicating factor is that species richness in warmwater streams declines as physical and chemical habitat degrades (Karr et al. 1986). In contrast, as coldwater systems degrade, species richness is often increased by invasion of facultative coolwater or alien species (Li et al. 1987; Lyons et al. 1996). An additional complication is the homogenization of fish assemblages by extensive salmonid stocking, which further blurs the already depauperate western coldwater fish assemblages (Maret et al. 1997; Rahel 2000). Co-occurring native, wild, and hatchery stocks are difficult to distinguish in the field, largely because artificially propagated fish are not consistently marked. Likewise, anadromous and resident stocks of the same salmonid species are also difficult to distinguish in the field.
Despite these limitations, state water standards and the national Clean Water Act explicitly call for fish protection. Direct assessments of fish assemblages are more relevant to fish management than are surrogate approaches based on other assemblages (such as invertebrates) or abiotic criteria alone (Doudoroff and Warren 1957; Yoder and Rankin 1998). To be useful for water quality standards, an IBI should be applicable to at least three major biological conditions. These include nearly pristine waters where the natural fish assemblage, structure, and function are intact, and relatively high-quality waters supporting largely alien salmonids. Alien salmonids may fill a similar ecological niche and possess similar physical and chemical habitat requirements as natives. An IBI should also apply to waters with fish assemblage structure and function increasingly dissimilar to those of the natural physical and chemical habitats of the region. Biological condition typically changes along gradients from pristine to severely altered, and assessment tools have limited precision to delineate subtle changes in those gradients.
Fisheries resources and IBIs are commonly described as coldwater, coolwater, or warmwater (Armantrout 1998; Simon 1999). These classifications (or the similar classifications of temperate stenotherms, mesotherms, and eurytherms) may be real or arbitrary divisions along a temperature continuum (Hokanson 1977; Magnuson et al. 1979). In Pacific Northwest rivers, coldwater and coolwater fishes typically occur together (Li et al. 1987), and distinctions between coldwater, coolwater, and mixed assemblages may be unclear or artificial. Lyons et al. (1996) dealt with this overlap by describing coldwater, coolwater, and warmwater stream communities as those inhabiting systems with annual maximum daily average temperatures (MDATs) of less than 22°C, 22–24°C, and greater than 24°C, respectively. We did not have the summer-long, continuous temperature records necessary to calculate MDATs for most of our sites, so we did not use MDATs to distinguish fish assemblages. We use the term “coldwater assemblage” to indicate locations at which coldwater-classified individuals would be numerically dominant, or at least well represented, during the summer.
Methods
Data Sources
Fish data sets were located for rivers that were fourth order or larger, at a map scale of 1:100,000. Wetted widths of the rivers were 15–100 m, and nearly all were too deep to sample effectively by wading. We used data from the upper Snake River basin to develop the initial IBI (Maret 1997; O'Dell et al. 1998; USGS 2002a). Additional Snake River basin data from the Idaho Department of Fish and Game, the Idaho Department of Environmental Quality, Idaho State University, and Idaho Power Company were also compiled and reviewed. We validated our IBI with data from the U.S. Geological Survey's (USGS) National Water Quality Assessment (NAWQA; Cuffney et al. 1997; Mullins 1997; Munn and Gruber 1997; USGS 2002b) and the U.S. Environmental Protection Agency's (USEPA) Environmental Monitoring and Assessment Program (EMAP; John Stoddard, USEPA, unpublished data). Fish sampling procedures are described in Averill and Peck (1999) and Meador et al. (1993). Sites were boat-electrofished near shore for a distance of about 500–1,000 m, which included repeating geomorphic channel units (i.e., riffles, pools, and runs; NAWQA, 100 sites) or 100 channel widths (EMAP, 70 Oregon sites; Hughes et al. 2002). All collected individuals were identified to species and counted. Almost all data were collected during summer base-flow conditions. Data collected in different areas by different methods were analyzed separately, confounding methodological and biological condition effects (Figure 1). Sites included nearly pristine rivers in national parks and wilderness areas, least-disturbed reference rivers in national forests, rivers influenced substantially by basin agriculture, and rivers with extensive channel and flow modifications related to urbanization and agriculture.
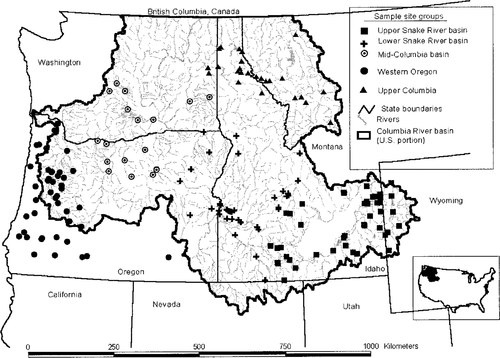
Sites used to develop and validate the Pacific Northwest IBI. Upper Snake River sites were used for index development; all others were used for validation
Species' origins and tolerances to generally degraded water quality were obtained from Zaroban et al. (1999). Those authors assigned general tolerances, gleaned from state fish books and their experience, that reflected how species distributions and abundances changed with increased temperature, turbidity, sedimentation, and nutrients. Rainbow trout Oncorhynchus mykiss were considered alien in systems above Shoshone Falls, Idaho; the falls historically limited the upstream distribution of rainbow trout in the Columbia−Snake River system (Behnke 1992). When distinguishable from wild fish, hatchery fish were excluded from counts.
Reference and Disturbed Conditions
To scale biometrics appropriately, an estimate of the natural or minimally disturbed (reference) condition is needed. The reference estimate can be obtained from the sampling of existing conditions in minimally disturbed rivers or from examination of historic natural conditions (Hughes 1995). The historical natural condition of rivers in the Columbia River basin was largely one of swiftly flowing rivers that supported coldwater and coolwater fish species. Rivers located in forested montane areas presumably supported coldwater fish assemblages. This assumption is corroborated by the condition of many such rivers in wilderness areas that remain minimally disturbed today. Further, observers in the late 1800s describe abundant steelhead trout and salmon in the middle Snake River, the Bruneau and Owyhee river drainages in northern Nevada, the Boise River, and Payette Lake. Bowler et al. (1993) reported that early explorers found high water clarity in the entire Snake River and that native American middens along the middle Snake River indicated the major importance of salmonids to the diet. Records for Oregon rivers from 1900 to the mid-1940s show that most of the fishes collected were salmonids (39–50%) and cottids (20–30%) (Li et al. 1987). As the pool of fish species shared among Pacific Northwest rivers is substantial (Li et al. 1987; Zaroban et al. 1999), the predominance of salmonids and cottids is likely typical of other river systems in the Pacific Northwest. The current and historical distributions of native trout in the interior Columbia River basin also support the concept of an historical coldwater fish assemblage for rivers in the basin (Behnke 1992). In addition, Columbia River tributaries traverse shared or similar ecoregions, which are areas of generally similar landforms, climate, soil, and vegetation (Omernik and Gallant 1986). This phenomenon implies that similar coldwater fish assemblages once inhabited rivers throughout the Pacific Northwest. Such a pattern is further endorsed by the fact that all the Pacific Northwest states base their legal use designations for water bodies on salmonids and salmonid protection.
The historical record describes a coldwater template for defining reference expectations but provides few details. To select and scale metrics and an index, we established expectations of current regional conditions and compared them with conditions at anthropogenically disturbed sites. Fish assemblage data collected from minimally disturbed sites in the upper Snake River basin were used to evaluate the range of reference metric conditions. Those data were compared with data from disturbed sites and were used to fit curves over the gradient of anthropogenic disturbance.
The percentage of agricultural land in the upper Snake River basin has been strongly associated with negative biological, chemical, and physical habitat changes. Land use is as important in shaping fish assemblages as are basin size, discharge, elevation, or ecoregions (Maret 1997). Schomberg et al. (1998) reported that riffle beetles nearly disappeared in agricultural basins. Lee et al. (1997) found that the percentages of riffles and pool tails covered with fine-grained sediment were highest in agricultural basins. Similarly, Wang et al. (1997) reported that IBI scores in Wisconsin streams declined sharply when basin agricultural land use exceeded 50%. Others showed continuous IBI declines with any increase in agricultural land use (Steedman 1988; Roth et al. 1995; Fitzpatrick et al. 2001). Moore et al. (1996) demonstrated that the number of federally threatened and endangered fish species correlated positively with the amount of irrigated agriculture in western counties. We considered basins with more than 15% farmland coverage disturbed. In less arid lands, such as those in the Midwestern United States and in Canada, 15% farmland coverage might not be considered a large proportion of agricultural use in a basin. However, in the Columbia River basin, irrigated agriculture is concentrated along rivers. The majority of the natural river flow is often withdrawn for irrigation and returned through agricultural drains as wastewater. The dependence on reservoirs and the riparian location of farmland amplify the influence of agriculture on rivers beyond that expected from the simple proportion of basin land use. However, any use of percentages is likely to oversimplify actual conditions. Some farmers may use management practices that result in lower aquatic impacts. In other cases, urbanization, grazing, or logging disturb basins. Despite the obvious drawbacks, we considered the percentage of basin agricultural land use to be a reasonable, preliminary predictor of anthropogenic effects on fish assemblages. The land use percentages for the upper Snake River NAWQA sites were calculated with 1:250,000-scale digital land use data (60-m resolution) for the drainage area upstream from each sample site. For supplemental, non-NAWQA sites in the upper Snake River basin, land use was calculated at the sub-watershed scale (USGS 12-digit hydrologic cataloging unit scale) for the drainage upstream of each site. Land use for EMAP sites was also determined from digitization of drainage basins.
Candidate Metrics
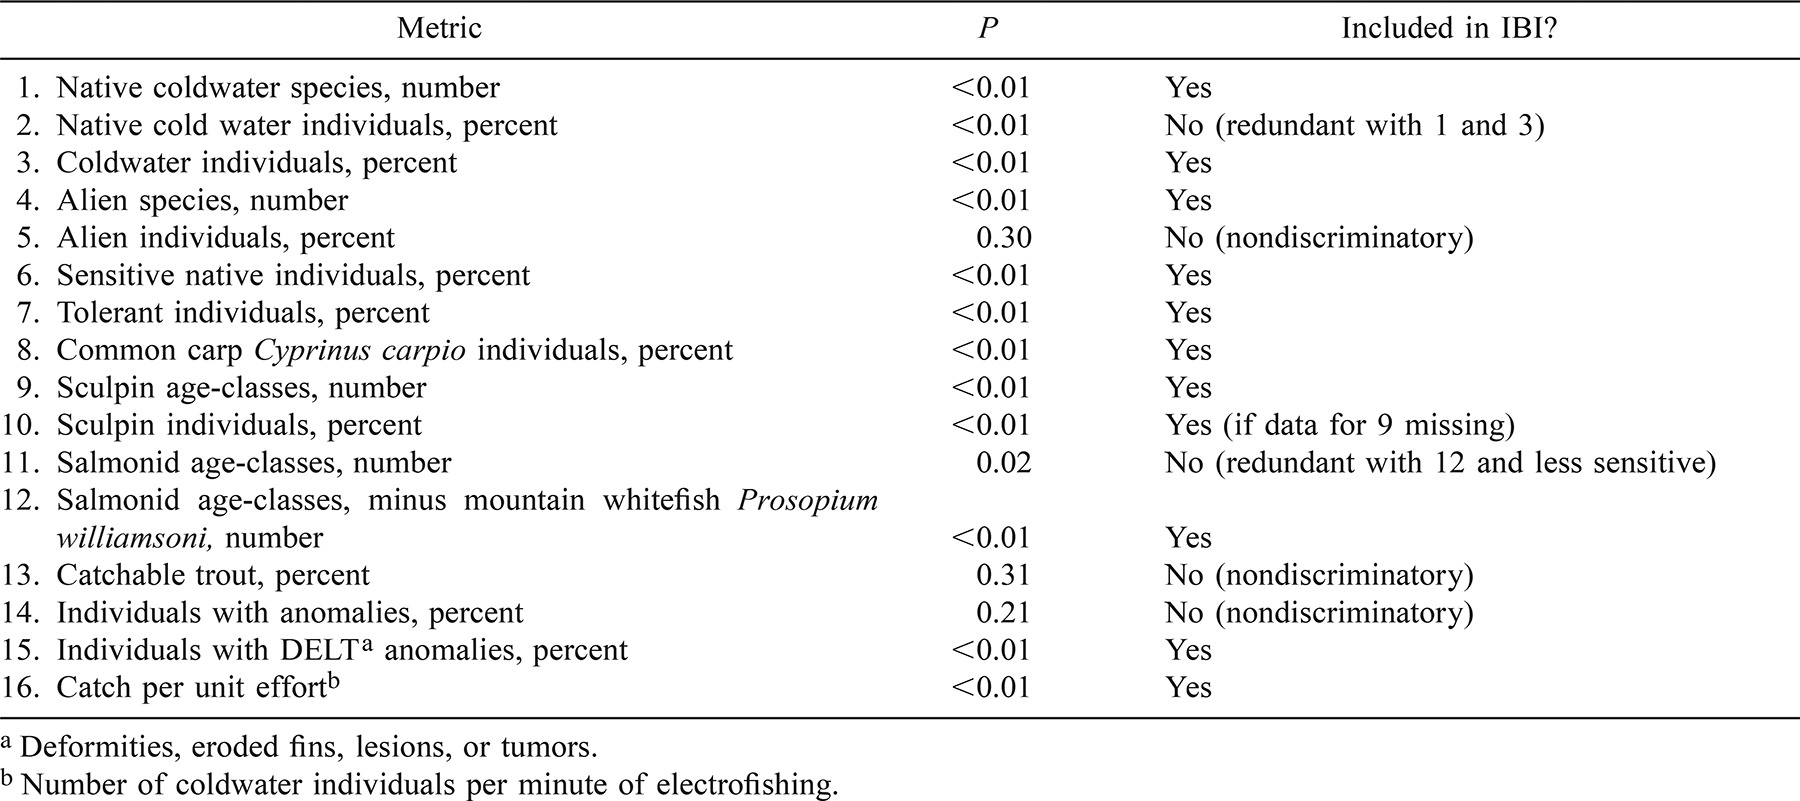
We examined 16 metrics used in other coldwater IBIs (Hughes and Gammon 1987; Fisher 1989; Robinson and Minshall 1992; Royer and Minshall 1996; Maret 1997; Mundahl and Simon 1999; Table 1). The following paragraphs describe the ecological basis of each metric, as well as the expected responses of the metrics to environmental degradation.
Number of native coldwater species
This metric is limited to native coldwater species in order to exclude the confounding effects of alien or tolerant native species, which were possible with Karr's (1981) original metric. Coldwater-adapted species were classified according to Zaroban et al. (1999), with the exception of the mottled sculpin Cottus bairdi, which we considered a coldwater species based on Bond (1963), Wydoski and Whitney (1979), Hendricks (1997), and Li et al. (1987). Fish assemblages are more stable in terms of species' presence and absence than in terms of abundance, and much of the abundance variability may result from natural disturbances (Erman 1986; Rahel 1990).
Percentage of native coldwater individuals
Like the previous metric, this one eliminates the effects of alien coldwater or tolerant individuals. We hypothesized that the percentage of individuals would be more stable than species richness if some species were rare.
Percentage of coldwater individuals
This metric reflects establishment of alien trout populations at a site. Alien trout may displace native trout but still require relatively high-quality habitat, and a low percentage of individuals belonging to coldwater species indicates degraded physical or chemical habitat. Because of widespread alien trout introductions, the metric provides responses in more areas than are possible with the percentage of native coldwater individuals alone.
Number of alien species
This metric reveals the severity of biological pollution by alien species and is measured by how many species are established, rather than by the number or percentage of alien individuals. Agreeing with Rahel (1990), we expected the presence of an alien species to be less variable than the percentage of alien individuals. Within species' historic ranges, it may be difficult to discern whether a particular population is indigenous or alien.
Percentage of alien individuals
This metric indicates the dominance of assemblages by alien individuals. However, it is possible to find a high percentage of alien individuals in otherwise minimally disturbed locations where fishery managers introduce “desirable” trout species.
Percentage of sensitive native individuals
General tolerances of environmental stressors by basin species were listed by Zaroban et al. (1999). Sites that resemble natural reference conditions will include sensitive native individuals; conversely, sensitive natives will be the first to decline when systems are degraded by humans. The percentage of sensitive native individuals metric reflects this phenomenon.
Percentage of tolerant individuals
The proportion of fish that thrive in or tolerate poor-quality physical and chemical habitat increases in degraded rivers. Some native cyprinids and catostomids, as well as many alien species, were considered generally tolerant by Zaroban et al. (1999). The percentage of tolerant individuals increases at environmentally degraded sites. Native tolerant species were uncommon at our reference sites.
Percentage of common carp individuals
Common carp are omnivorous and exceptionally tolerant of warm, turbid, silty conditions. With regard to Pacific Northwest rivers, we consider dominance by the common carp as an indicator of seriously degraded conditions. Even a numerically small percentage of common carp in an assemblage may comprise most of the fish biomass at a site (Royer and Minshall 1996; Maret 1997).
Number of sculpin age-classes
The number of sculpin age-classes indicates the availability of the unembedded cobble substrate required for cavity nesting and refuge. The sedentary life histories of sculpins result in adult home ranges of only 50–150 m2 (Hendricks 1997). Therefore, the presence of multiple sculpin age-classes reflects site conditions over the previous few years. Sculpin age-classes tended to decline with increasing proportions of fine sediments in mountain streams in central Idaho (Mebane 2001). Erman (1986) found that sculpin age-class distributions were relatively stable during long-term monitoring of a mountain stream, whereas abundances were more variable due to flow patterns.
Percentage of sculpin individuals
The mottled sculpin, Paiute sculpin C. beldingi, shorthead sculpin C. confusus, Shoshone sculpin C. greenei, slimy sculpin C. cognatus, torrent sculpin C. rhotheus, and Wood River sculpin C. leiopomus require well-oxygenated rubble or rubble−gravel substrate and are absent or rare in areas where fine-grained substrate or highly embedded cobble substrate predominate. Sculpin larvae and some sculpin adults burrow into cobble interstices (Finger 1982; Haro and Brusven 1994). Some freshwater sculpin species tolerate fine sediments and low dissolved oxygen, but these typically do not occur in our study area (Zaroban et al. 1999). The physiological needs of many sculpin species are generally similar to those of salmonids, but sculpins are much less vagile (Bond 1963). Hughes (1985) found that sculpins were rare or absent from Montana sites disturbed by metal mining. McCormick et al. (1994) reported that sculpins were absent from Colorado streams with elevated metals concentrations, although trout were present. Mullins (1997) reported that mottled sculpins were absent from areas downstream of municipally treated sewage discharges, although they were the most abundant species immediately upstream; salmonids showed no such trends.
Number of salmonid age-classes
This metric reflects the suitability and stability of conditions for salmonid spawning, rearing, and maturation. Age-class distributions frequently shift in response to stressors such as exploitation, recruitment failure, food limitation, or niche shifts (Munkittrick and Dixon 1989). The spawning success of most salmonids is reduced by excessive siltation (Chapman 1988; Maret et al. 1993). Salmonid age-classes declined with increasing proportions of fine sediments in mountain streams in central Idaho (Mebane 2001).
Number of selected salmonid age-classes
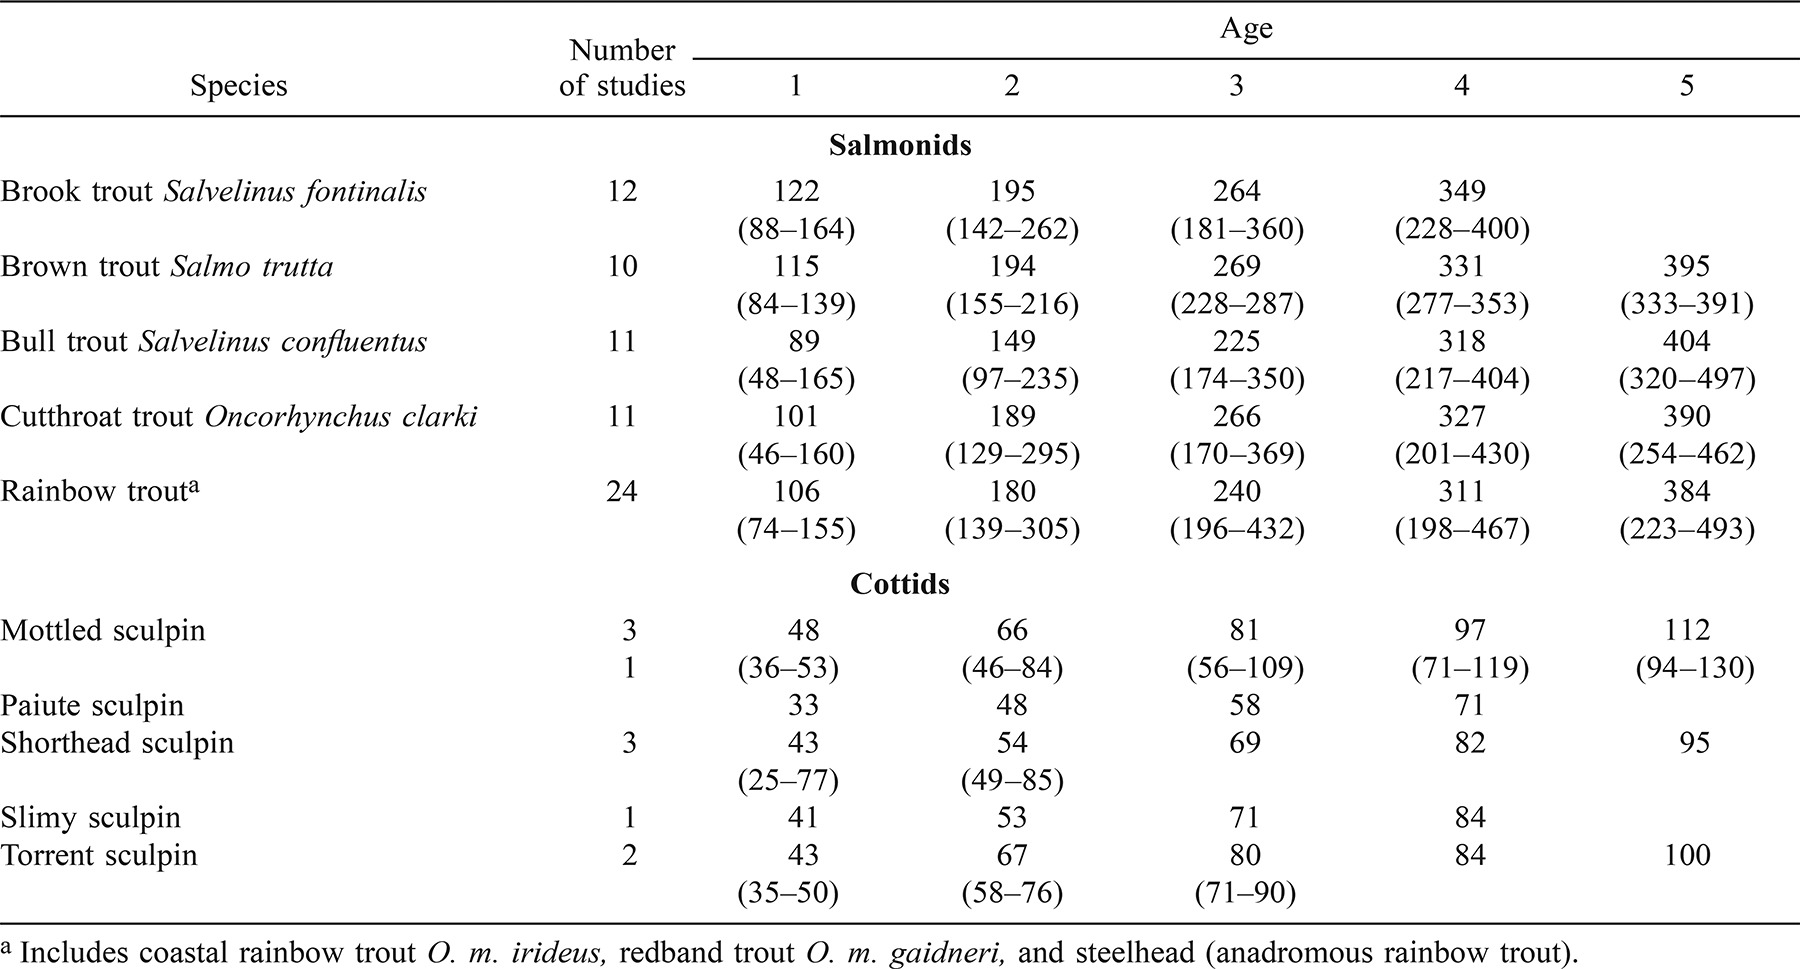
Mountain whitefish were abundant, and multiple age-classes were present at apparently degraded sites in which other salmonids were absent or rare. Thus, this species may be more resilient than other salmonids to warm temperatures or low intergravel dissolved oxygen. Mountain whitefish broadcast spawn over gravelly areas without building redds, and larval development occurs in quiescent river backwaters (Thompson and Davies 1976; Northcote and Ennis 1994). We included only the redd-building, gravel-spawning salmonid species (trout, char, and salmon) in this metric. Spawning success of trout, Salvelinus spp., char, and salmon is more sensitive to siltation than that of whitefish, because fine sediments embedded in gravels reduce interstitial spaces, intergravel dissolved oxygen, and egg and alevin survival. The surface layer of such embedded gravels may still be suitable for broadcast spawners like whitefish. Numbers of age-classes in samples were estimated from size-classes, based on length-frequency data and average length-at-age relationships (Table 2).
Percentage of catchable trout
The presence of relatively old individuals of generally intolerant species indicates the persistence of satisfactory habitat over the previous 3–5 years. The percentage of catchable trout also reflects the “fishable” goals of federal and state water quality policies (Hughes and Gammon 1987; Simon and Lyons 1995; Hughes et al. 1998). However, larger individuals are usually less sensitive to chemicals and low dissolved oxygen than are juveniles (Sprague 1995).
Percentage of individuals with anomalies
This metric assumes that fish are more likely to develop deformities, tumors, lesions, or less serious infections in degraded conditions. This metric was one of Karr's (1981) original metrics and is widely used (Simon and Lyons 1995; Hughes and Oberdorff 1999).
Percentage of individuals with DELT anomalies
Fish develop deformities, eroded fins, lesions, or tumors (DELT anomalies) when exposed to contaminated sediments or excessive concentrations of pathogens. The metric excludes parasitic infestations, which are often unrelated to water quality. Neoplasms of the skin or other epithelial tissues have been linked to environmental contamination. The etiologies of gross external pathological anomalies other than neoplasms are inconsistent and have not been closely linked to chemical contamination (Harshbarger and Clark 1990; Horness et al. 1998). Sanders et al. (1999) qualitatively associated DELT anomalies with pollution sources in Ohio rivers. Although crude, DELT anomalies indicate a serious problem in aquatic ecosystems.
Catch per unit effort of coldwater individuals
The metric involving catch per unit effort (CPUE) of coldwater fish presumes these fish should be more abundant at locations with favorable conditions for coldwater-adapted fishes. Relative abundance must be normalized to allow comparisons of different sizes of habitats and different fishing efforts. We chose electrofishing time, rather than area or distance, to normalize catch. Limiting the metric to coldwater-adapted individuals avoids the problem of increased total fish abundances in response to nutrient and thermal enrichment. Because electrofishing efficiency declines in larger, deeper rivers, the metric may be appropriately excluded if data from waters of markedly different sizes are being compared. Differences in gear would also require exclusion or modification of the metric. Populations of salmonids and sculpins may exhibit wide fluctuations that are unrelated to physical or chemical habitat changes (Erman 1986; Platts and Nelson 1988).
Metric Responsiveness and Redundancy
Using data from the upper Snake River Basin and a Mann–Whitney U-test of significance, we examined the ability of each candidate metric to discriminate between minimally disturbed reference sites and sites with over 15% of basin land use in irrigated agriculture. Metrics that passed the responsiveness screen were examined for degree of responsiveness, as indicated by box plot separation. When metrics were redundant, we selected the most responsive metric.
Metric and Index Variability and Precision
Metric and index variability was evaluated by examining coefficients of variation (CV, defined as 100 · SD/mean) and signal-to-noise (S/N) ratios. Because the CV is a measure of variability relative to the mean, a high CV among reference sites may suggest that a metric is too erratic to be relied upon for assessments. A low CV across a range of conditions indicates that the metric is unresponsive to changes. Variability at disturbed sites was higher than at reference sites, presumably due to unstable environmental conditions (Fore et al. 1994). Barbour et al. (1992) concluded that metrics with CV values greater than 100% at reference sites were usually rejected by analysis of variance as being unable to distinguish different types of streams and levels of disturbance.
Kaufmann et al. (1999) described the precision of stream habitat measurements by the ratio of among-site variance (signal) to within-site variance from replicated sites (noise). Metrics with S/N ratios less than 2.0 severely limited analysis by regression or correlation, while metrics with S/N ratios greater than 10 had insignificant error and distortion (Kaufmann et al. 1999). Hughes et al. (1998) used S/N ratios to select among candidate IBI metrics. We calculated the S/N ratios and the standard deviations of the noise for individual metrics and for the IBI from 35 sites that were sampled at least twice.
Metric Scoring and Index Construction
Most IBI metrics are scored as 1, 3, or 5. Like Minns et al. (1994), Hughes et al. (1998), and McCormick et al. (2001), we believe that a continuous scoring system is more amenable to statistical evaluation and graphical analyses when plotted against continuous stressor variables. We therefore standardized metrics by scoring them continuously from 0 to 1 and then scaled them as necessary to produce an IBI with scores ranging from 0 to 100. When 10 metrics were used, the 10 metric scores were summed, then multiplied by 10 to scale the IBI score from 0 to 100. Sites were excluded from analyses if fewer than 20 individuals were captured. Such sites probably indicated sampling inadequacy, because captures at even our most degraded sites exceeded that number.
Cumulative frequency distributions (CFDs) were used to characterize the distribution of candidate metric values and to identify minimum and maximum score values. Minimum scores were set at 0 for positive metrics, and maximum scores of 1 were set near the 95th percentile of scores for all sites, thereby reflecting a gradient of metric responses. The 95th percentiles of scores for all sites were similar to the 75th percentile of the reference sites. Lines or simple curves were drawn by eye between the ranges, depending on whether the CFD of a metric's values suggested a linear, threshold, or asymptotic response (Figures 2, 3). Because sites represented wide ranges of anthropogenic disturbance, those gradients were reflected in the CFDs of metric values. Equations that described the scoring curves were used to calculate metric and index scores. We also ensured that scores could not eclipse one another and that a maximum score in one metric would not prevent other metrics from attaining a maximum score (Suter 1993). For example, because 30% of coolwater individuals occurred at many minimally disturbed reference sites, we set the top score of the percentage of coldwater individuals at 70% or higher; otherwise it could not be achieved at many reference sites.
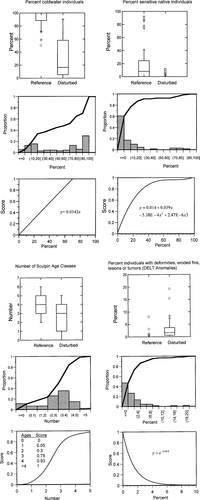
Metric scoring set by considering the range of values at reference (n = 29) and disturbed (n = 40) sites (top: box plots show medians and quartiles, whiskers 1.5× the interquartile distances from the nearest quartile, asterisks outliers [>1.5–3× interquartile distances], and open circles far outliers [>3× interquartile distances]) and the metric response pattern (middle: histograms and cumulative frequencies) over a range of minimally to highly disturbed conditions (middle). For metrics that increased with disturbance (e.g., anomalies), the scoring curve is the inverse of the response gradient. A smoothed curve or line (bottom) was drawn by eye to produce high scores for the main body of reference values (>70th percentile), while the slopes and shapes reflect the general pattern of values across the gradient of site conditions. Equations for the curves and lines were created by plotting points along the hand-drawn curves, selecting a mathematical model that could produce the curve shape (e.g., linear, exponential, polynomial, or sigmoid logistic), and using a curve-fitting function from a graphing program (DeltaGraph, SPSS Inc.).
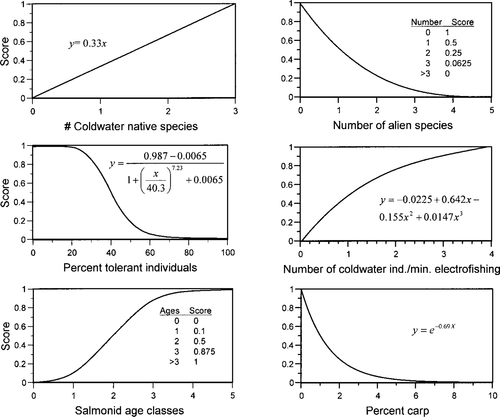
Scoring curves of IBI metrics not shown in Figure 2.
Metric Contribution to Index Score
Minns et al. (1994) demonstrated that individual metrics differed in their contributions to index scores in different ranges of IBI results (excellent to poor). Consequently, the relative sensitivity of index values to individual metrics was compared for the reference and disturbed sites separately. We examined the index's sensitivity to each metric by calculating a reduced index, which involved sequentially removing one metric and calculating the percentage difference between the reduced index of remaining metrics and the overall index. If all 10 metrics contributed uniformly, the differences would be 10%.
IBI Validation
Index responses to physical and chemical habitat variables and land use were initially evaluated for the upper Snake River basin study sites through use of scatter plots and Pearson's product-moment correlation coefficients.
To validate our IBI, we calculated it for fish data sets from other Pacific Northwest rivers (Figure 1). Unlike the upper Snake River basin, agriculture was not a major land use in some of these basins; instead, forestry, grazing, mining, and wilderness predominated. Therefore, in the interior Columbia River basin, we used the landscape assessment of Quigley et al. (1996) to rate sites. Subbasins (∼2,000–8,000 km2) were rated high quality if they contained well-connected (unimpounded), high-quality chemical and physical habitats that would support the full expression of fish life histories and dispersal mechanisms. Sites were rated moderate quality if they were fragmented by a few small dams or by dams with fish passage, if they had low levels of irrigated agriculture, or if they did not support full life history patterns and dispersal among basins. Because too few sites were rated as high quality, we combined the moderate- and high-quality groups. Sites with low quality landscape ratings were considered disturbed. These included basins with multiple large dams, dams lacking fish passage, and high levels of anthropogenic disturbance (roads, mines, logging, or grazing). In the John Day River of central Oregon, however, finer-scale landscape information indicated impaired aquatic habitat from intensive livestock grazing at many moderate-quality sites (Li et al. 1994). Those sites were considered disturbed instead of moderate quality. Like the upper Snake River sites, data for the 70 Oregon EMAP sites included quantitative basin land use, so sites with at least 15% agricultural, residential, quarrying/mining, or urban coverage were classified as disturbed.
Longitudinal Effects
Natural river communities gradually change longitudinally as river sizes and gradients change (Vannote et al. 1980; Li et al. 1987). In general, species are added to a system as the gradient lessens and as the water temperature and river size increase. As river elevation declines, fish assemblages change from simple coldwater trout–sculpin assemblages upstream into more diverse mesothermic and eurythermic assemblages downstream (Li et al. 1987; Rahel and Hubert 1991). This natural ecological pattern masks the impacts of human settlements and agriculture, which also increase with lower slopes and milder temperatures (Rathert et al. 1999; Hughes and Hunsaker 2002). Anthropogenic disturbance of rivers causes upriver shifts in the fish assemblage typical of downriver reaches (Rahel and Hubert 1991; Scott and Helfman 2001), although hypolimnetic releases from high main-stem dams do just the opposite (Ward and Stanford 1983). The discrimination of downstream anthropogenic effects from characteristics of the natural continuum is necessary to guide river management or restoration. Otherwise, subtle degradation might remain unnoticed because of natural longitudinal patterns, or misguided remediation efforts could attempt to create a trout river where none previously existed.
Another concern is that natural longitudinal change may limit the representativeness of metrics and indices relative to reference conditions. Although most Pacific Northwest rivers were historically inhabited by coldwater species, at some point before reaching the Pacific Ocean, the natural biological template likely differed from that described by our IBI. Likewise, the fish assemblage model described here would not pertain to headwater streams, which typically have an extremely low fish species richness of about one to two species (Platts 1979; Li et al. 1987). Our IBI is an empirical model, and neither very large rivers (higher than eighth order) nor headwater streams (lower than fourth order) were included in its development.
Opportunities to make comprehensive reference comparisons for rivers are limited due to the extensive history of human settlement and alteration. Fortunately, we were able to sample longitudinal effects on two of the largest minimally disturbed river sections in the USA: the Salmon River in central Idaho and the upper Snake River near the Wyoming−Idaho border. The Salmon River flows for 700 km from an elevation of 2,500 m to 300 m. The rugged topography and relatively harsh climate (short growing season and limited precipitation) have restricted permanent human settlement and disturbance in the Salmon River basin. Also, most of the land surrounding this river is publicly owned, resulting in reasonably sound long-term land management practices, although some irrigation, grazing, and logging occur (Minshall et al. 1992). Much of the basin area is managed as wilderness. The Salmon River is one of the few rivers of its size in the conterminous United States with no impoundments on it or any of its tributaries (although several downstream dams impede fish migration). The upper 300 km of the Snake River has been similarly protected by a harsh climate, and much of the basin is protected as managed wilderness and national parks, although two reservoirs occur between the three sample sites. For the Salmon River sites, MDATs were estimated from temperature data loggers located near the sample reaches (Donato 2002). Though not matching exactly in space and time with fish sampling, the temperature measurements allowed us to estimate relative temperature patterns along the river continuum. We raft-electrofished each reference river site for 1,000–1,300 m during summer base flow. This allowed us to assess the effect of river size on IBI stability and to evaluate the IBI's sensitivity to natural changes in fish assemblages along a river continuum. The longitudinal changes in the two reference rivers were compared with those in disturbed rivers of similar size.
Results and Discussion
Metric Responsiveness and Redundancy
Of the 16 metrics tested, 13 discriminated between the initial reference and disturbed sites, and three were redundant, leaving a total of 10 (Table 1). Nondiscriminating metrics were the percentages of alien individuals, catchable trout, and individuals with anomalies. The upper Snake River sites with the highest percentages of alien individuals (60–80%) were otherwise minimally disturbed locations where managers had introduced alien trout (Snake River at Yellowstone National Park, Wyoming). Although the catchable-trout metric did not discriminate between reference and test sites, both the salmonid and sculpin age-class metrics did, and these metrics better address the ability of sites to support multiple age-classes of sensitive species. Field crews often consider heavy parasite loads as anomalies, but parasites can be very common in sites with high-quality physical and chemical habitat, making the percentage of individuals with anomalies unresponsive. However, the percentage of individuals with DELT anomalies did discriminate among agricultural sites and reference sites; other studies have corroborated the finding of elevated DELT anomalies in seriously altered sites (Sanders et al. 1999).
Two redundant metrics (the percentage of native coldwater individuals and the number of salmonid age-classes) were rejected. The percentage of native coldwater individuals was redundant with the percentage of coldwater individuals and the number of native coldwater species. The latter metric was selected because fish assemblages are more stable in terms of species presence and absence than in terms of abundance (Rahel 1990). In addition, the percentage of coldwater individuals was included for its applicability to situations in which desirable alien trout may dominate otherwise relatively high-quality waters. The number of salmonid age-classes (including mountain whitefish) was redundant with the number of selected salmonid age-classes excluding whitefish. Because the latter metric was more sensitive to moderate disturbance, it was retained. A third redundant metric (the percentage of sculpin individuals) was retained as an alternative to the number of sculpin age-classes when length data were lacking. In the Spokane (Idaho and Washington) and Pend Oreille (Montana, Idaho, and Washington) river basins, the percentage of common carp individuals was omitted, and the index was calculated with nine metrics. Simpson and Wallace (1982) reported that common carp had not yet invaded the Spokane and Pend Oreille basins, and no common carp were captured at any of the 48 sites in those basins.
Metric and Index Variability and Precision
Among reference sites, raw values for the percentages of tolerant individuals and individuals with DELT anomalies had the highest average CVs (260% and 280%, respectively; Table 3). These metrics are highly variable because their mean values are very low, resulting in divisors near zero. Normalizing metrics through scoring curves greatly reduced the CVs of the most variable metrics and reduced the apparent variability in values occurring in asymptotic portions of the scoring curves. However, the metrics remained responsive to biological changes.
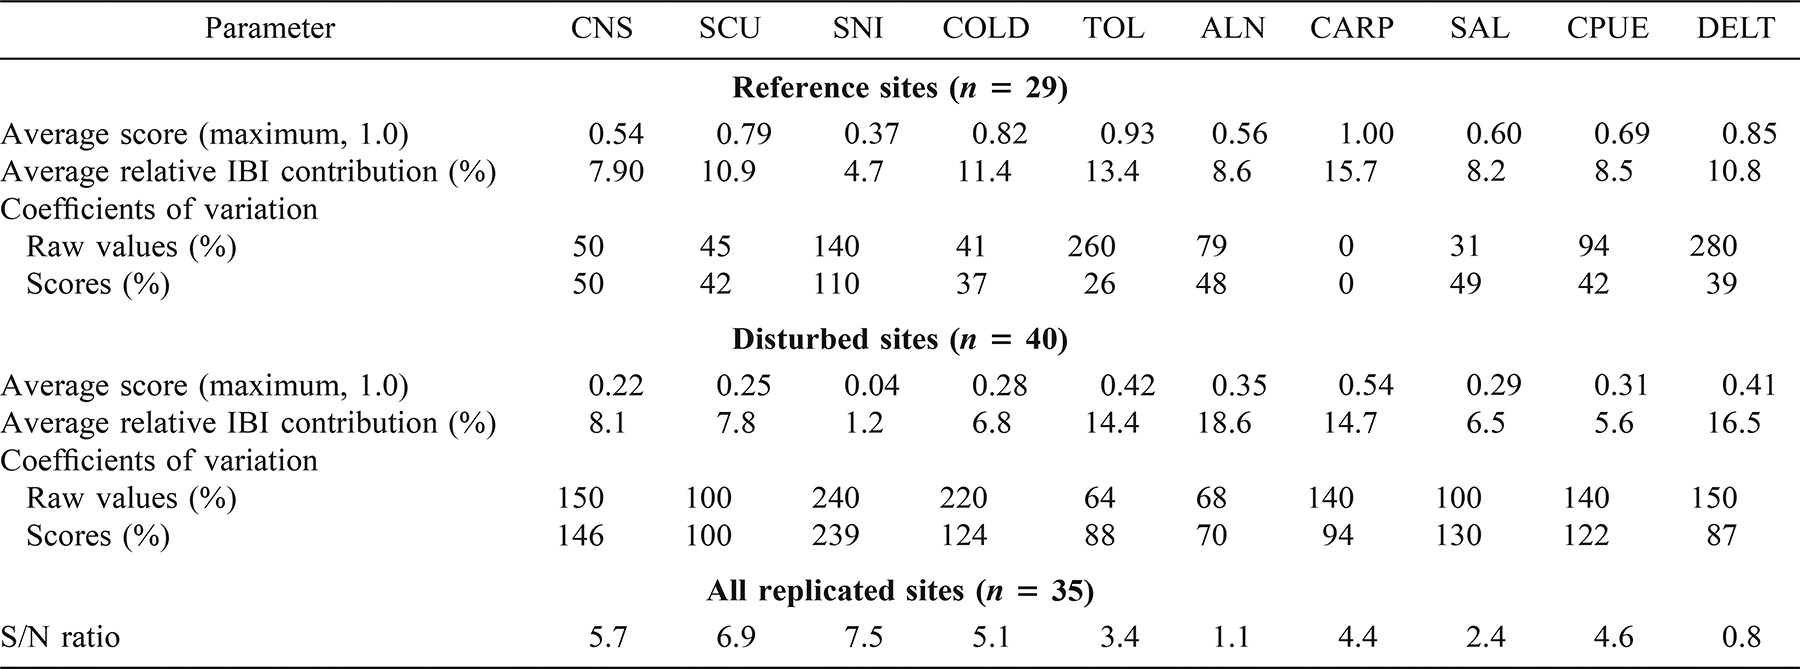
Signal-to-noise ratios for individual raw metric values ranged from 0.8 to 7.5 (Table 3). Low S/N ratios for the number of alien species and the percentage of individuals with DELT anomalies could constitute grounds for rejecting these metrics. However, we considered the potential for future establishment of alien species and for increased prevalence of anomalies to be ecologically important enough to justify retaining both metrics despite their low precision. Others have found these two metrics very revealing, especially for sites receiving urban and industrial effluents (Hughes and Gammon 1987; Sanders et al. 1999). The S/N ratio for the overall IBI was 8.0. The replicated sites in this paper included year-to-year and seasonal sampling in addition to measurement variability; thus, the noise is greater than would have occurred with only single-season and site measurement error, as described by Kaufmann et al. (1999). Another way to gauge IBI precision is by considering the replication variability of the noise itself. The SD of the noise for the IBI was 5.6, indicating that IBI score differences less than 6 are noise and therefore biologically insignificant.
If we assume that true site condition did not change between revisits and sampling crews, then IBI variation can be visualized as the deviation from a perfect 45° linear relationship in the plot of each IBI score against the mean IBI score for repeated visits (Figure 4). Differences at sites with high scores (>70) were lower than those at sites with low scores (SDs of 3.5 and 8.6, respectively; different at P < 0.01 based on the Mann–Whitney U-test). Fore et al. (1994) also found greater variability in IBI scores among low-scoring sites than among high-scoring sites, but Hughes et al. (1998) found just the opposite. Rock Creek, Idaho, with a mean score of 65, had a spread of 25 between visits. Sampling crews could not confidently distinguish hatchery fish from naturally reproducing fish at this site (Maret 1997). Hatchery supplementation of age-0 fish, juveniles, and catchable adults artificially inflates IBI scores in Rock Creek, which suggests caution in interpreting scores from highly managed waters. The most extreme difference in IBI scores was at a site on the South Fork of the Coeur d'Alene River, Idaho, which has experienced heavy-metal contamination and habitat structure degradation from a legacy of mining and channel alterations. When sampled during September low flows, the fish assemblage at this site was dominated by alien centrarchids and ictalurids; only a few native cutthroat trout and alien brook trout were present. When resampled during June runoff, the fish assemblage consisted of alien brook trout and native cutthroat trout only. The IBI scores of 64 in June and 20 in September reflect the dramatic shifts in the fish assemblage as species responded to seasonal conditions. Fish assemblage patterns may exhibit remarkable seasonal changes along the lengths of northwestern river systems, and highly migratory native fishes such as mountain whitefish, bull trout, and largescale suckers Catostomus macrocheilus may have annual ranges of hundreds of kilometers (Baxter 2002). Winter biomonitoring of Pacific Northwest fish assemblages is uncommon in biomonitoring, and data collected at times other than summer base-flow periods should be evaluated cautiously.

IBI scores versus mean IBI scores for sites sampled more than once. Open circles indicate replicate reaches sampled during the same summer; closed circles indicate interannual replicates. Close proximity to the 45° line indicates little temporal or measurement variance
Metric Contribution to Index Score
Among reference sites, individual metrics contributed 4.7–15.7% of the IBI scores; among disturbed sites, metrics each contributed from 1.2% to 18.6% (Table 3). The percentage of sensitive native individuals averaged the lowest contribution to the overall index score. High scores with this metric were infrequent for both reference and disturbed sites in the upper Snake River basin. In contrast, none of the reference sites were inhabited by common carp or were dominated by tolerant species; thus, all reference and many disturbed sites received high scores for these two metrics. Although disturbed sites had lower metric scores than did reference sites, the relative contributions of most metrics to the IBI were similar for both disturbed and reference sites.
IBI Validation
The IBI scores at reference sites were significantly higher (P < 0.01) than scores at disturbed sites in the index development data set (upper Snake River) as well as in the four IBI validation data sets (Figure 5). Overlap between scores from the reference and disturbed sites was minimal.

Ranges of scores for reference and disturbed (test) sites used to develop and validate the Pacific Northwest IBI. Upper Snake River sites were used for index development; all others were used for validation. All pairs were statistically different at P-values less than 0.01 based on the Mann–Whitney U-test. Box plots show medians and quartiles, whiskers the 95th percentiles. Sample sizes are shown for both reference and test sites.
Because our IBI was initially developed in the upper Snake River, IBI scores were negatively correlated with the percentage of the basin used in agriculture, as expected (Pearson's r = −0.75; Figure 6). Correlations of the IBI with basin areas in rangeland and forestland were weaker and were not statistically significant. The IBI scores were also negatively correlated with the percentage of river width covered by fine-grained sediments (r = −0.74), which, in turn, was significantly correlated with the percentage of agricultural land (r = 0.80; Figure 6). Similarly, IBI scores were negatively correlated with specific conductance, which was positively correlated with the percentage of agricultural land and the percentage of river width covered by fine-grained sediments but negatively correlated with the percentage of forestland.
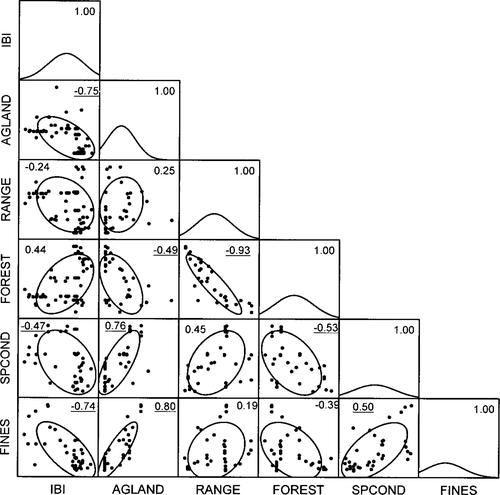
Correlations between the IBI, land type, fine sediments, and specific conductance in the upper Snake River basin. Values of Pearson's product-moment correlation coefficient greater than 0.45 (underlined) were statistically significant (P < 0.01). Confidence ellipses show approximately 1 SD of the sample means (0.68 probability). Variables are defined as follows: AGLAND, the percentage of land in the watershed of a sampled site that is under cultivation; RANGE, the percentage of rangeland (with livestock or wildlife); FOREST, the percentage of forested land; SPCOND, specific conductance; and FINES, the percentage of the substrate that is covered by fine-grained sediment
The IBI scores for Oregon EMAP sites declined with increased watershed disturbance (Figure 7). Although western Oregon rivers contain several species different from those in the upper Snake River drainage, our IBI was still useful for this region. However, the set of six sites with low total disturbance and low IBI scores (lower left of Figure 7) all have significant alterations that were not reflected in our geographical information systems land use data. The six sites represent large, mostly forested (Umpqua River) or rangeland (Sprague River) basins. However, near the two Sprague River sites, excessive grazing, irrigated agriculture in the riparian zone, channel incision, and lack of riparian woodland are common conditions that were not represented in the remote sensing data. One of the Umpqua River sites occurs in a narrow, urbanized valley along a freeway and rail corridor. The other three Umpqua River sites are located downriver from this site and below a shallow, warm reservoir and an area of irrigated agriculture. The substantial flow modifications and devegetation at and upriver of all six sites produce much warmer waters than would occur naturally, which favors dominance by warmwater aliens such as smallmouth bass Micropterus dolomieu (Umpqua River sites) and fathead minnow Pimephales promelas (one Sprague River site), or the native blue chub Gila coerulea (one Sprague River site) rather than sculpins and salmonids.
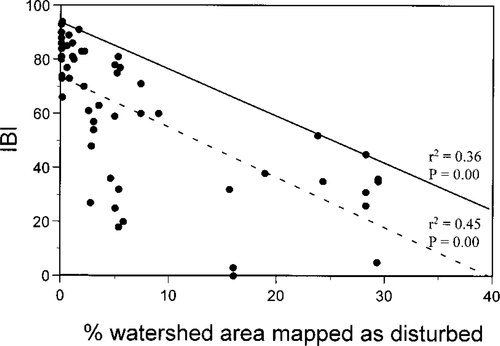
Linear regressions (dashed line) and 95th percentile regression (solid line) of IBI scores from Oregon rivers versus the percentage of basin area converted to agricultural, residential, and urban land uses
The three sites with IBI scores at or near zero (lower center of Figure 7) represent fundamentally altered river reaches in an agricultural valley. The two sites with 16% watershed disturbance are located in a channelized, riprapped reach of the Long Tom River, Oregon, 40–50 km downriver from a warm, eutrophic reservoir. These two sites suffer from water withdrawals for irrigated agriculture and dominance by alien fish species (83% of individuals; 60% of species), with only an occasional salmonid being observed in one remaining riffle. The site with 28% watershed disturbance (lower right of Figure 7) is the Portland, Oregon, ship channel of the lower Willamette River. The shorelines there consist of bulkhead in a major urban area, and the reach is a federally designated Superfund site. Forty percent of the individuals and species in this reach are alien fishes, and salmonids and sculpins are rare. If extensive agricultural and urban developments occur in watersheds with extensive riparian buffers and erosion controls plus minimal flow alterations, then the fish assemblages could yield high IBI scores despite high percentages of watershed disturbance (Steedman 1988). Though this combination did not occur at any of the sites in Figure 7, such situations potentially limit broad-scale land use comparisons based on fish assemblages.
We found that increased watershed conversions to agricultural, residential, or urban uses are associated with lower IBI scores (Figures 5, 7). However, local riparian, channel, flow, and chemical alterations can further reduce IBI scores, as explained above. Therefore, the figures depict both the linear regression of the center of the scatterplot and the quantile regression of the upper edge of the scatterplot. Examination of the upper boundary of the IBI response is based on the ecological concept of limiting factors. The assumptions of conventional correlation and regression analyses fundamentally conflict with the ecological concept of limiting factors, which are better displayed by regressing the upper edges of scatter diagrams (Scharf et al. 1998; Cade et al. 1999). A factor other than those graphed may be the active limiting constraint, and changes near the maxima rather than at the center of response distributions are better estimates of the effects expected when the graphed factor is the active limiting constraint. Consequently, quantile regression may provide a better estimate of expected effects, assuming that the graphed factor is the major constraint (Terrell et al. 1996; Dunham et al. 2002).
Longitudinal Effects
The IBI results were consistent along a longitudinal gradient for the two reference rivers (Figure 8; Table 4). Average scores for three sites along 230 km of the upper Snake River ranged from 79 to 84, and scores for the middle five sites encompassing 500 km of the Salmon River ranged from 82 to 95, despite marked changes in fish assemblages. Over the first 100 km downstream from the Salmon River headwaters, the fish assemblage consisted almost entirely of invertivorous cottids and salmonids; by 190 km, piscivorous cyprinids (northern pikeminnow) and omnivorous catostomids were added to the assemblage. At our lowest Salmon River site, the fish assemblage included alien smallmouth bass and common carp. Also, coldwater native species were scarce and cyprinids and catostomids dominated, resulting in an IBI score of 51 at the lower site (Figure 8). There were no significant anthropogenic influences between the sites at 526 km and 595 km downstream from the headwaters. The principal differences between the sites were a more open canyon at the lower site, yielding about a 0.6°C higher MDAT, plus a shorter distance to the impounded Snake River (150 versus 220 km downstream), with its reservoir of alien centrarchids and common carp. In 2000, the MDATs near the sites at river km 526 (dominated by coldwater individuals) and river km 595 (dominated by coolwater individuals) were 23.0°C and 23.6°C, respectively (Table 4). In 1999, the year when fish were sampled at the sites, MDATs were probably about 1°C cooler, based upon records from the Clearwater River at Orofino, Idaho, a nearby river of similar size. Interannual differences in MDATs at Pacific Northwest river sites with extensive temperature time series records often exceed 2°C (Don Essig, Idaho Department of Environmental Quality, personal communication). Thus, interannual differences at a site are often greater than the 2°C differences used by Lyons et al. (1996) to distinguish coldwater, coolwater, and warmwater fish assemblages. Still, there is remarkable similarity between the MDATs associated with dominance by coldwater or coolwater fishes at the Salmon River sites and Lyons et al.'s (1996) threshold of less than 22°C for the establishment of coldwater stream communities in Wisconsin.

Longitudinal changes in fish assemblage composition (pie graphs) and corresponding IBI scores (next to sample site markers) along the Salmon River, Idaho
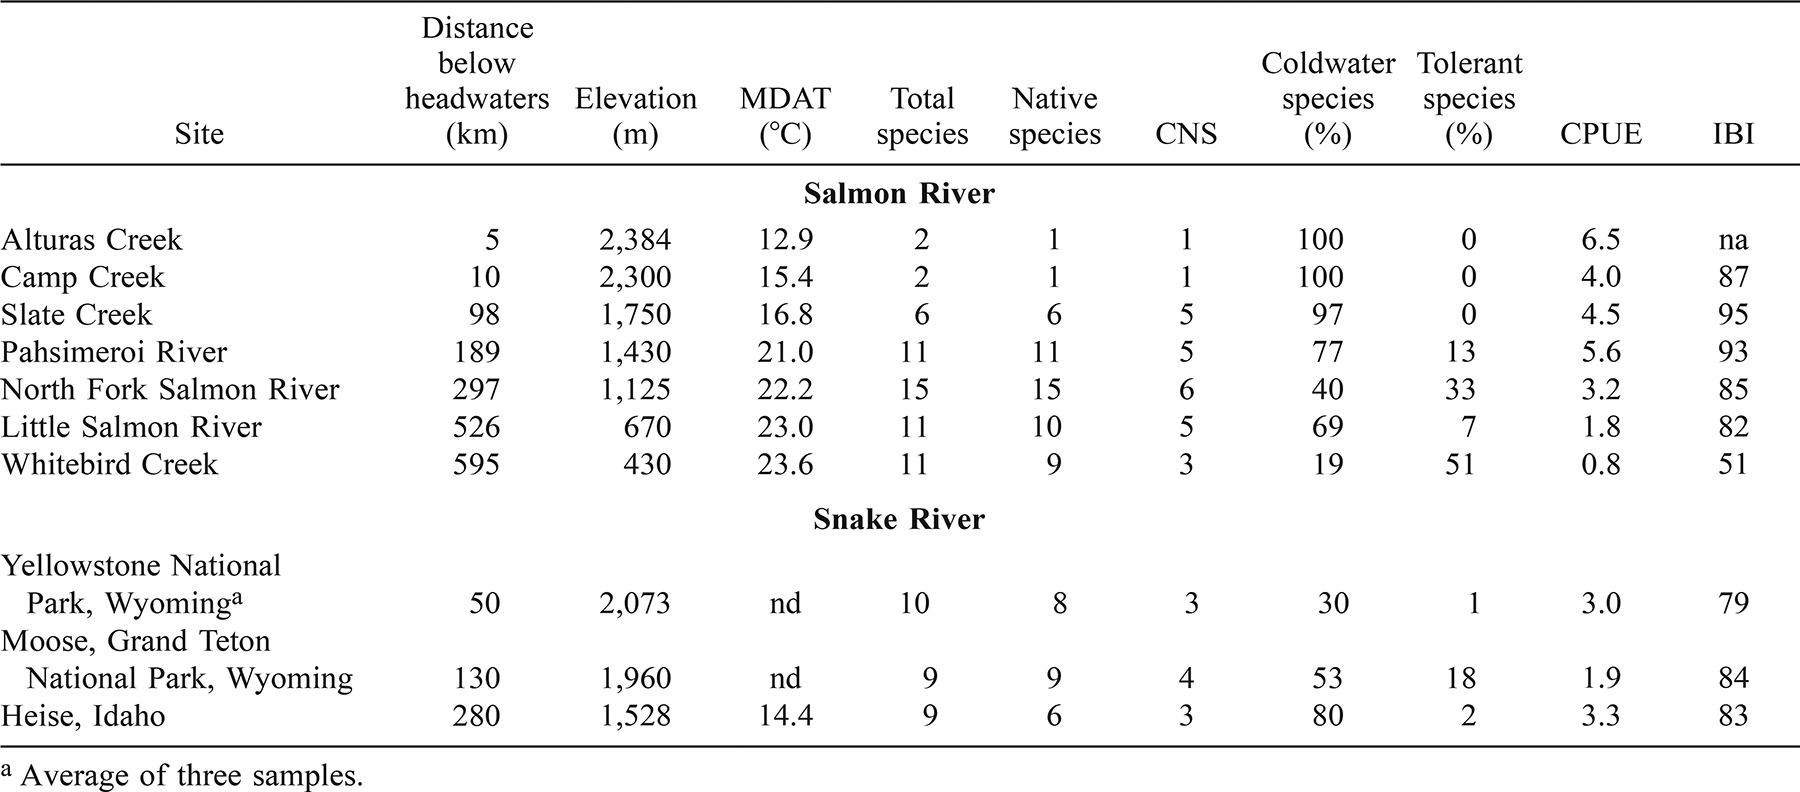
Because the metric scoring criteria accounted for a range of reference conditions, the effects on the IBI of natural longitudinal zonation and species additions were dampened, yet not to the point of missing significant unnatural effects. Ranges of IBI scores were much greater over longitudinal gradients in rivers with greater anthropogenic alteration (e.g., 13–55 for the John Day River, 21–87 for the Yakima River, Washington, 7–92 for the Boise River, 3–80 for the Willamette River, and 1–100 for the Spokane River).
Capacity to Distinguish Varying Levels of Biological Condition
The IBI delineated three gross levels of biological condition (Table 5). First, rivers with an IBI range of 75–100 had minimal disturbance, possessed or approached biological integrity, and hosted a diverse and abundant assemblage of species. At such sites, native coldwater fishes predominated, sensitive species were common, and where generally tolerant species occurred, their occurrence was infrequent. Second, rivers with an IBI range of 50–75 were somewhat lower-quality waters where socially desirable alien species were present, reflecting relatively high-quality physical and chemical habitats. Such sites usually existed in catchments altered by increased levels of logging, grazing, or agriculture. Native coolwater fishes were dominant, but generally tolerant species occurred more frequently at these sites. Sensitive species, sculpins, and anadromous salmonids were missing or reduced at the sites with intermediate IBIs. Third, rivers with IBIs lower than 50 were of poor quality: coldwater and sensitive species were rare or absent, and generally tolerant fishes predominated. Coolwater fishes still dominated, but less-desirable alien species such as common carp (a warmwater fish) and smallmouth bass often occurred at such sites. Low-IBI sites were found in highly altered channels or in close proximity to urban areas, irrigated agriculture, or extensive heavy-metal mines.
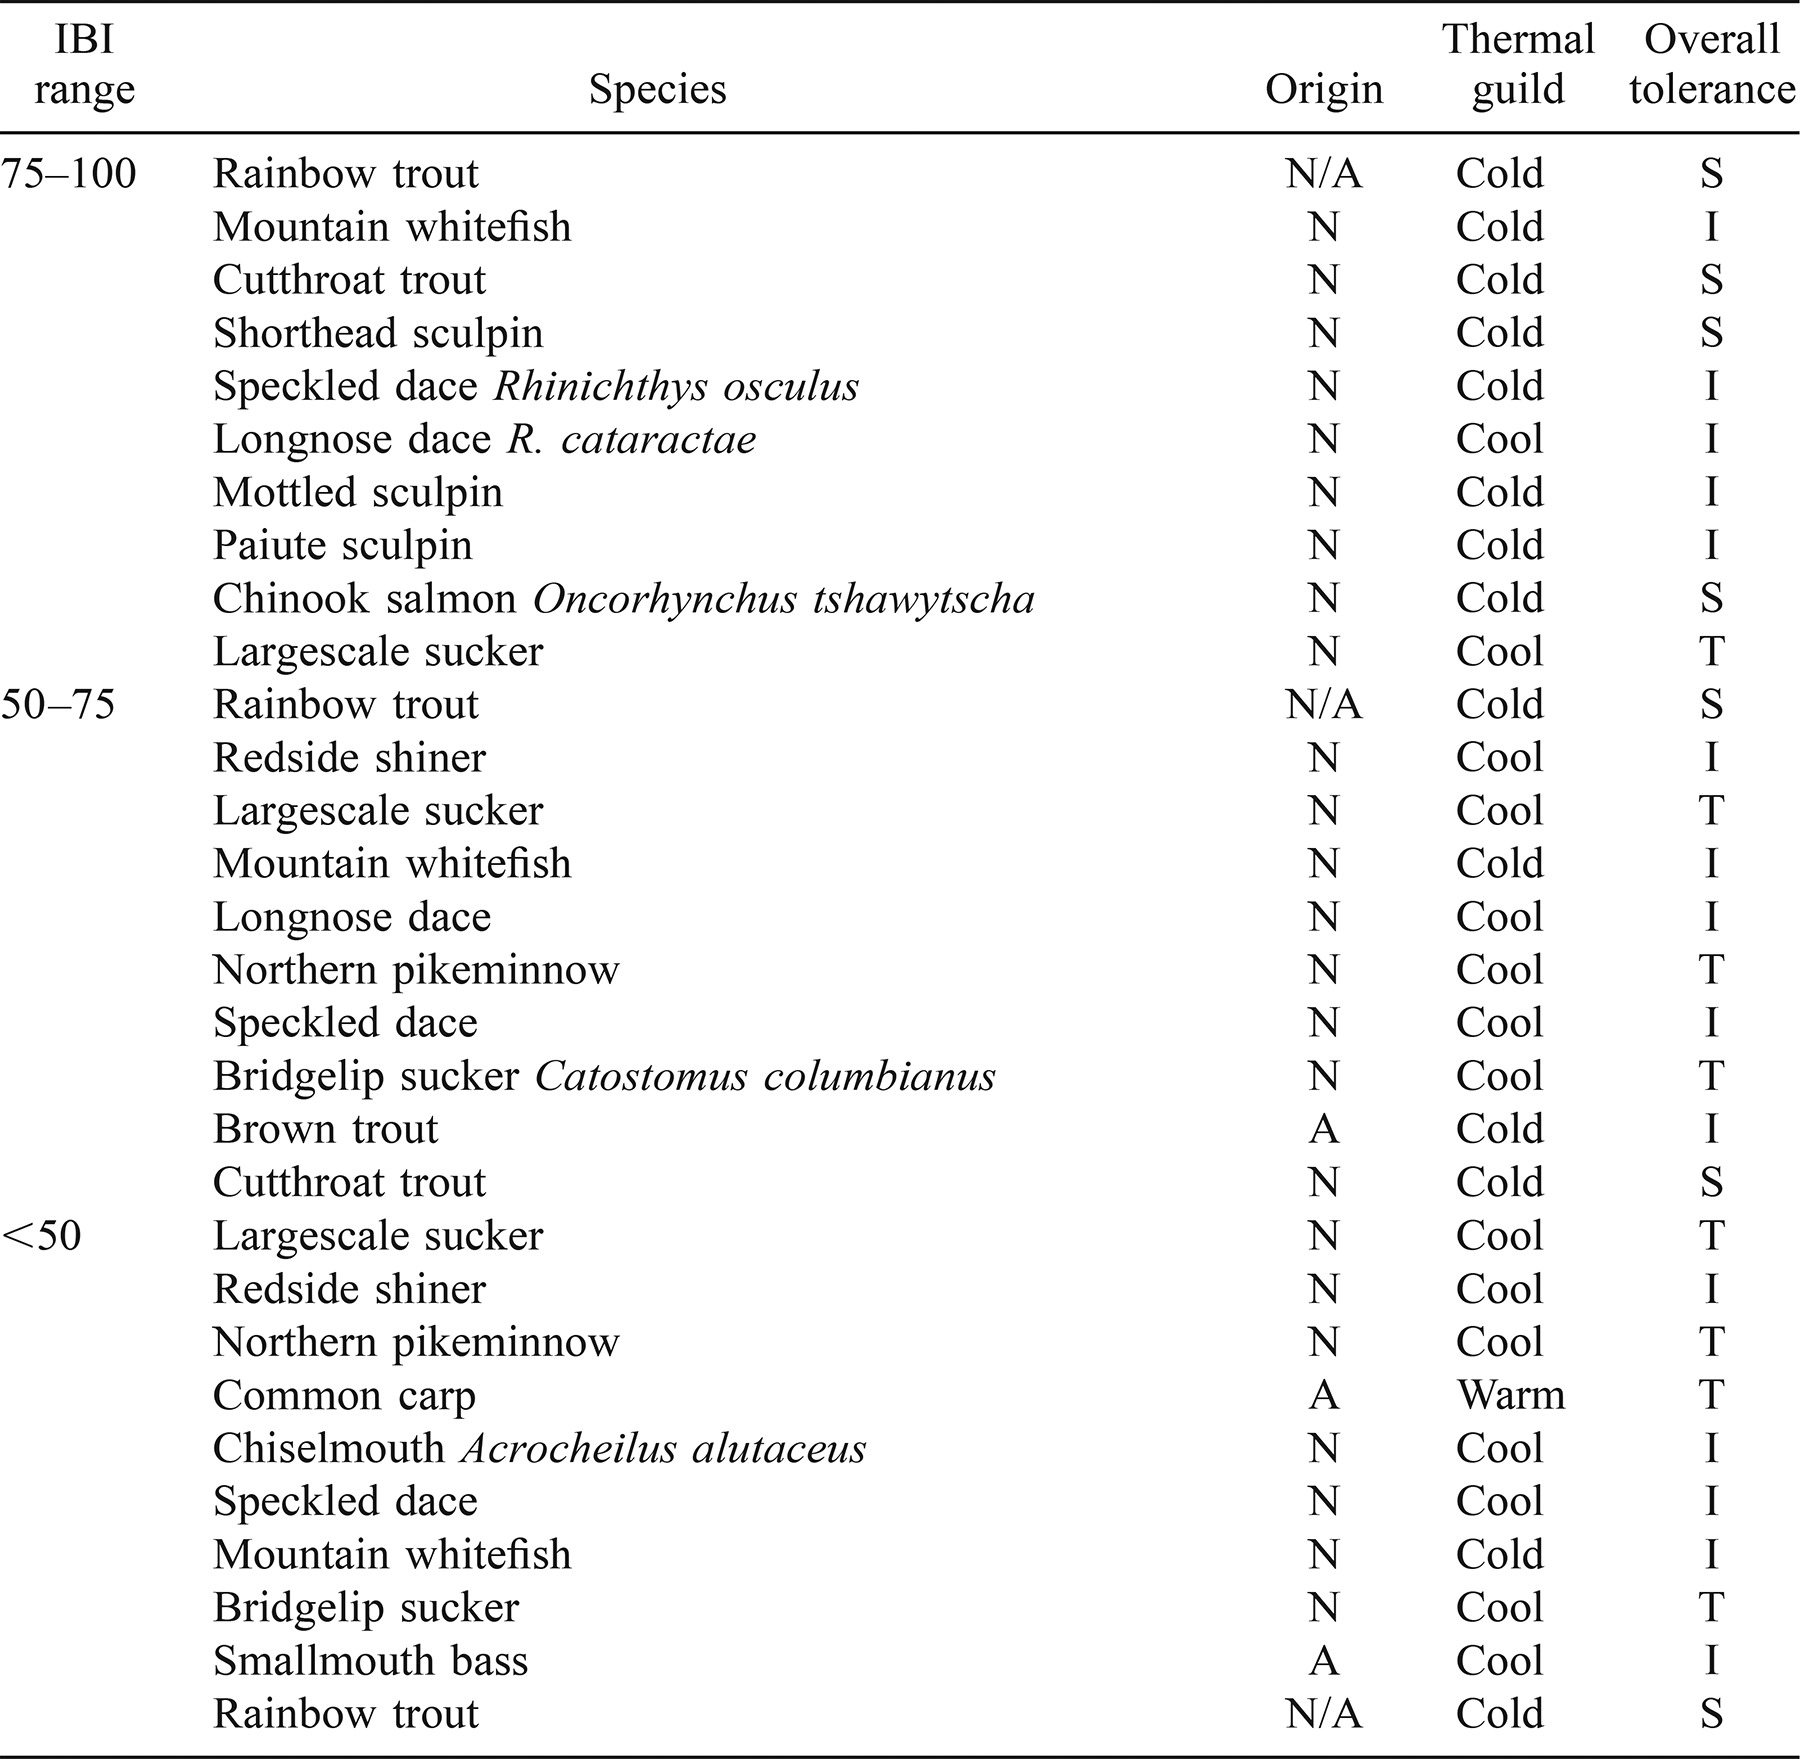
Our IBI appears useful for interpreting, comparing, and communicating the relative biological condition of Pacific Northwest rivers. The component metrics and the overall index results responded to different biological conditions in the developmental and validation data sets. The scoring criteria were developed over a wide gradient of reference and disturbed conditions. Our testing of IBI responses with independent physical and chemical habitat data from the IBI development sites, along with data from over 100 validation sites located throughout the Pacific Northwest, produced favorable results. The IBI scores changed more in response to anthropogenic effects than to natural longitudinal changes over distances of up to 525 river km. These results support use of this IBI as a quantitative measure of fish assemblage condition throughout Pacific Northwest rivers. However, a different IBI would be appropriate in Pacific Northwest waters that have reference conditions quite different from those of the reference rivers used to develop this IBI (e.g., small streams where only coldwater fish species are expected or large rivers [higher than seventh order] where coldwater species would be less common than in our reference rivers). This IBI or a similar one may also be applied in western rivers outside the Pacific Northwest as long as assemblages consisting of coldwater and coolwater fish species are expected in reference conditions. However, before modifying our IBI for use elsewhere, investigators must first evaluate the sufficiency of their sampling effort, reference site integrity, and native and alien species richness.
Acknowledgments
We thank Steve Brink, Scott Grunder, Michael Meador, William Mullins, and Mark Munn for sharing their fish assemblage data. The paper was greatly improved through reviews of an earlier version by Larry Brown, Linda Channel, Robert Goldstein, Michael Meador, and Thomas Simon, and through subsequent reviews by Robert Bramblett and two anonymous reviewers. Thomas Herron compiled the majority of the salmonid length-at-age relationships that we used. Jason Dunham gave statistical advice and assistance with quantile regressions. We are grateful for all the assistance and encouragement. The participation of Robert M. Hughes was supported by the USEPA via contract 68-D01-005 to Dynamac Corp., and the manuscript received USEPA review and clearance.


