Comment: A Review of the Hatchery Programs for Pink Salmon in Prince William Sound and Kodiak Island, Alaska
Recently, Hilborn and Eggers (2000) have asserted that hatcheries in Prince William Sound (PWS), Alaska, have caused a decline in the productivity of wild pink salmon Oncorhynchus gorbuscha in PWS and that hatchery fish to a large degree have replaced, not enhanced, pink salmon returns. Pink salmon catches in PWS are currently at historic highs, averaging 27 million fish per year over the past decade. Over 85% of the harvest is from a system of large hatcheries (Pinkerton 1994; McNair 2000). There is concern that hatchery production may have been deleterious to wild pink salmon in PWS, complicating management and the achievement of escapement goals and reducing productivity (e.g., Tarbox and Bendock 1996). Hilborn and Eggers estimate that more than 90% of the recent annual production would have been attained by wild stocks alone in the absence of hatchery production. We, however, find compelling evidence that hatchery fish have greatly increased the total pink salmon harvest in PWS and that Hilborn and Eggers's estimates of wild stock productivity in the hypothetical absence of hatchery fish are not credible. While countervailing trends in the abundance of wild and hatchery pink salmon in PWS superficially appear to support Hilborn and Eggers's arguments, careful consideration of the evidence indicates that the program has had substantial net benefits.
We address three central points of the Hilborn and Eggers paper: (1) that retrospective analysis indicates that the proportional increases in pink salmon production in PWS have been similar to those in regions of Alaska without major hatcheries, on the basis of which Hilborn and Eggers conclude there is no evidence from between-region comparisons that the large increases in the catch in PWS were due to hatcheries; (2) that, because wild stock productivity is correlated negatively with the magnitude of fry releases from hatcheries, wild stock fish would have produced more than 90% of the current record runs in PWS in the absence of hatcheries; and (3) that wild stock escapements (i.e., the number of reproducing wild salmon) have declined due to deleterious interactions with salmon released from hatcheries.
Proportionality Argument
Hilborn and Eggers retrospectively analyze the total returns from 1965 to 1997 of pink salmon from four regions of Alaska, Kodiak Island (KOD), PWS, southeast Alaska (SEAK), and the south Alaska Peninsula (SAP), to argue that increases in pink salmon production have been more or less proportional among regions. They summarize this analysis by dividing this period into approximately decadal periods: 1965–1975, 1976–1985, and 1986–1997 (Hilborn and Eggers 2000; Table 1). They selected these years because of the relationship between salmon catches and climatic conditions, which have been used to identify a “regime shift” in 1976–1977 from low productivity to high productivity for salmon in the Gulf of Alaska (Mantua et al. 1997; Downton and Miller 1998). The first period thus corresponds to low-production, “prehatchery“conditions, the second to high-production conditions when hatchery releases were increasing but were of lesser magnitude, and the third to high-production conditions when hatcheries in PWS were at full production.

Hilborn and Eggers argue that pink salmon have increased in PWS due to a climate regime shift in the Gulf of Alaska that has led to more favorable oceanic survival conditions. They submit that similar proportional increases have occurred among all four major pink salmon regions since the 1965–1975 period regardless of the extent of hatchery production. However, their comparisons actually indicate a wide range in proportional changes: 1.90 in KOD, 5.74 in PWS, 3.54 in SEAK, and 5.93 in SAP (Hilborn and Eggers; Table 1).
We took a longer view of the decadal fluctuations in pink salmon productivity to compare the several regions of Alaska. A previous high-production phase for Alaska salmon occurred in the 1930s and 1940s (Figure 1). Such fluctuations in historical catch data have been used as a proxy for total abundance (e.g., Beamish and Bouillon 1993; Downton and Miller 1998). We examined catch data from 1920 to 1999 (Byerley et al. 1999; ADFG 2000) for correlations of annual and 10-year moving average catches among regions and to compare the relative production among regions during periods of high productivity. We used moving averages to examine long-term trends that may be masked by short-term (in this case, annual) variability, and accounted for autocorrelation in assessing statistical significance (Pyper and Peterman 1998). We selected a 10-year moving average because Hilborn and Eggers compare periods of approximately decadal duration.
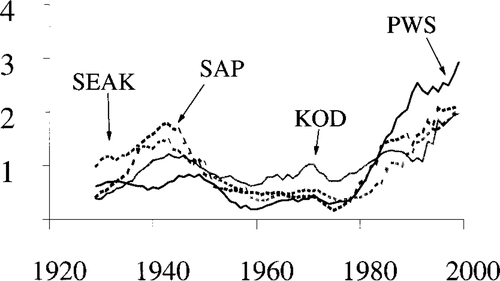
Ten-year moving averages of pink salmon catches in four regions of Alaska for the years 1920–1999, scaled by the average annual catch in each region for the entire time series. Averages are plotted for the last year of the 10-year average; SEAK = Southeastern Alaska, KOD = Kodiak Island, SAP = South Alaska Peninsula, and PWS = Prince William Sound. Data are from Byerly et al. (1999) and ADFG (2000)
We found that the historical variation of the harvest in PWS correlates significantly (P < 0.01) with that of other regions in both short and long term. Correlation coefficients were greater for the moving averages, indicating high correspondence for the long-term trend but with substantial interannual variation among regions. The percentages of variation explained (r2) in the temporal variation in PWS catch data by the 10-year moving averages for the other regions were 55% for SEAK, 64% for KOD, and 63% for SAP. In contrast, r2 values for the annual data were much lower: 32% for SEAK, 6% for KOD, and 21% for SAP.
This interannual variation results in differences in the timing of historical maximums and minimums (Table 1). Peak production in the high-production phase of the 1930s and 1940s occurred several years later in PWS than in the other three regions; historical minimums before the current production phase occurred in the 1950s in PWS and Kodiak, and in the 1970s in SEAK and SAP (Table 1). Hilborn and Eggers use an arbitrary time period as a basis for their comparisons of different phases in the regional long-term trends. The similarity of recent increases in SAP and PWS in their comparisons (Hilborn and Eggers; Table 1) is an artifact of the time periods they select.
The decade of the 1990s records the maximum peak of both the current production phase and the entire time series (Table 1). To determine whether the different regions have comparable productivity in different regimes, the appropriate contrast is between the current peaks and the maximum production of the prior high-production regime. When we compared the high production of the 1990s to the maximum catches of the prior regime, we found that PWS production has increased substantially more than that of the other three regions (Figure 2). Although the other regions have increased 1.2–1.6 times, PWS has attained a level 3.5 times its maximum in the previous high-production phase. Contrary to Hilborn and Eggers's conclusions, the increase in total abundance in PWS is disproportionately larger than in the other regions, indicating substantial enhancement by the hatchery fish. Also contrary to their conclusions, much of this increase has occurred since the 1976–1985 returns, and a substantial (30%) part of the increase during the 1976–1985 period was already due to hatchery production (Figure 2).

Ratios of average annual pink salmon catches in four regions of Alaska for the time periods 1990–1999 (upper panel) and 1976–1985 (lower panel) to the maximum 10-year average catch in the “early” (pre-1950) productive regime. Data are from Byerly et al. (1999), ADFG (2000), and McNair (2000)
We agree with Hilborn and Eggers that wild pink salmon production in PWS has changed disproportionately to that of other areas of Alaska. In the period 1976–1985, wild pink salmon catches were 1.3 times their prior historical (prior regime) maximums in PWS, compared with only 0.6 to 1.0 times in the other three regions (Figure 2). In the 1990s, catches of PWS wild stocks declined to 0.5 times their historical maximums, whereas catches in the other regions increased to 1.2–1.3 times their historical maximums. Two competing hypotheses could realistically explain these changes. Hilborn and Eggers hypothesize that large-scale hatchery production in PWS has caused the differential decline. This hypothesis does not explain the differentially greater increase of PWS wild stocks in the 1976–1985 period. The alternative hypothesis is that the changes in wild stock productivity reflect environmental variability and that the decrease in wild stock production would have occurred independently of the expansion of the hatchery program. In fact, average returns per spawner in PWS in 1976–1985 are by far the highest observed in any region, and even after declining in the later period are still the highest of any region (Figure 3).
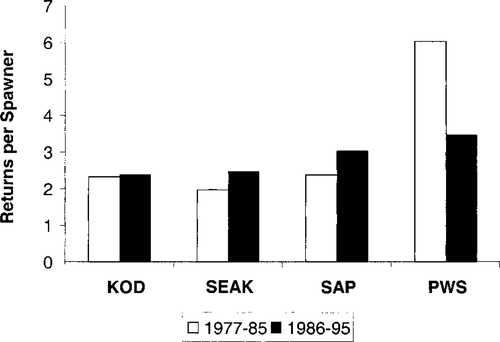
Annual average index of returns per spawner for brood years of pink salmon in two time periods and four regions of Alaska. Annual averages were computed by pooling total returns and total index escapements. Data are from Hilborn and Eggers (2000), Table 3
If we accept Hilborn and Eggers's argument that hatcheries have caused the reduction in wild stocks in PWS since the mid-1980s and assume that in the absence of hatcheries these stocks would currently be as productive (relative to the high-production phase of the 1930s and 1940s) as other regions of Alaska, we calculate that without hatchery production PWS wild stocks would have produced an average catch of 9.9 million in the 1990s. Actual catches in PWS in the 1990s have averaged 27.4 million, for a net gain of at least 17.5 million fish annually. If the changes in wild stock production in PWS have been due to ecosystem changes and are independent of the effects of salmon released from hatcheries, then the net gain from the pink salmon enhancement program is the actual catch of 23.7 million hatchery pink salmon.
Effects of Hatchery Releases on Wild Stock Productivity
Hilborn and Eggers use a Ricker model of pink salmon population dynamics to examine the historical effects of escapement (spawning stock size) and hatchery releases of fry on the production of wild pink salmon. This model establishes a statistical relationship of hatchery releases as an auxiliary variable affecting returns per spawner. Hilborn and Eggers use the model to simulate wild pink salmon production in PWS in the hypothetical absence of hatcheries. The effect of the auxiliary variable in the model is to decrease the productivity of wild spawners as hatchery releases increase.
The outcome of the simulation is not credible. The model produces simulated returns per spawner of wild pink salmon that are more than double the observed maximum for wild stocks in PWS (Hilborn and Eggers; Table 5). We compared the actual return per spawner data presented by Hilborn and Eggers with the return per spawners estimated by their model given observed escapements (Figure 4). Actual production in PWS for the 1977–1995 brood years did not exceed 11 returns per spawner and averaged 5.4 returns. For brood years 1977–1985, the maximum observed was 11 and the average was 7.0. This ratio is approximately concurrent with the period when catches of wild pink salmon in PWS had increased relative to their historical maximums to a level equal to that observed in any of the other regions to date (Figure 2). Data presented by Hilborn and Eggers (Figure 3, which was plotted from Hilborn and Eggers's Table 3) show that the productivity of 1977–1985 brood pink salmon in PWS was remarkably high, 2–3 times that observed in other regions of the state. Yet Hilborn and Eggers estimate that, absent hatcheries, there would have been 3 years of returns in excess of 20 returns per spawner, including 2 years in excess of 30 returns per spawner (Figure 4). The average simulated return per spawner in the absence of hatchery releases for the 1986–1995 brood years was 13.6 when Hilborn and Eggers used observed escapements in their simulation model. This level of productivity is far greater than the actual average historical returns per spawner observed in PWS and other pink-salmon-producing regions. Thus the wild pink salmon production estimated by Hilborn and Eggers in the absence of hatchery releases (17.5 million fish per year for 1986–1995 using observed escapements in their simulation) is unrealistically high.

Frequency distribution of returns per spawner of Prince William Sound pink salmon for the 1977–1995 brood years. Predicted returns are for the Hilborn and Eggers model assuming no hatchery releases and the observed escapement levels. Data are from Hilborn and Eggers (2000), Table 5
Examination of the Ricker α parameter for the simulation model also indicated that the model is unrealistic. In a survey of Ricker α parameters, Myers et al. (1999) found that the average for 52 pink salmon populations was 3.4, with an SE of 0.07. A simple Ricker model for the observed PWS returns from the 1977–1995 brood years, with no hatchery auxiliary variable, estimates α at 6.3, which is indicative of a very productive pink salmon stock. In the Hilborn and Eggers simulation, the hatchery effect becomes a constant C, and α is increased by C · α = α′, the “true” productivity parameter for the population in the absence of hatcheries. For Hilborn and Eggers's simulated results, α′ is 20.6, a value far above one leading to periodic cycles, chaotic dynamics, and even a high likelihood of extinction in a fluctuating environment (Ricker 1954; Fagen and Smoker 1989; Schaffer et al. 1986).
Bias in Hilborn and Eggers's simulation may result from the fact their model fits the data much better for the early “low hatchery release years” (1977–1985 brood years) than for the later “high hatchery release years” (1986–1995 brood years). The average absolute residual for the early period was 0.24; for the latter period it was almost three times as high at 0.64 (Figure 5). This trend indicates that some other factor may be having a large effect on the spawner–recruit relationship.
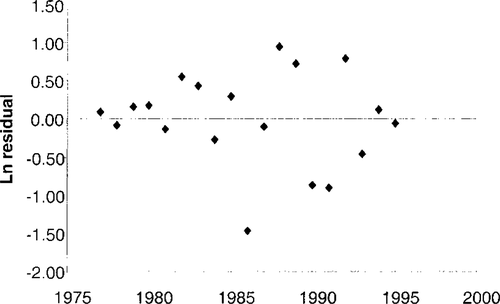
Time series plots of residuals from Hilborn and Eggers's population dynamics model for Prince William Sound wild pink salmon. Data are from Hilborn and Eggers (2000), Table 5
Another possible reason for bias in their estimate of stock productivity is their failure to consider the effects of measurement error, which can cause considerable positive bias in estimates of productivity (Hilborn and Walters 1992; Ludwig and Walters 1981). Measurement error in PWS escapement estimates is large both in observer counts and in estimates of stream life (Bue et al. 1998a). In addition, there is substantial measurement error in the allocation of catch between hatchery and wild production, especially prior to the representative tagging programs of hatchery fish that began in 1988. Allocations of catch in earlier years between production sources were essentially educated guesses.
Hilborn and Eggers further bias their simulation of PWS production in the absence of hatcheries by adding 18% to their simulated production. Their rationale for doing this is that it accounts for the increases in returns per spawner seen in other regions of Alaska over a period when returns per spawner declined in PWS (Hilborn and Eggers's Table 3; our Figure 3). We note that even during the “depressed” recent years, pink salmon in PWS have had higher returns per spawner than other regions. But more troublesome is that this adjustment in returns per spawner is double counting: it is added to simulated production that already has increased returns per spawner to unprecedented levels. Observed returns per spawner in PWS averaged 7.0 for the 1977–1985 brood years. Using observed escapements, the Hilborn and Eggers simulation model estimates returns per spawner of 13.6 for the 1986–1995 brood years, an increase of 94% over the 1977–1985 average. To add an increment of 18% on top of this increase is clearly inappropriate.
Escapement Declines
We disagree with Hilborn and Eggers's assessment that declines in average escapements of wild stock in PWS have been caused by increased hatchery production. We assert that the “decline” they identify was primarily due to the improved capability of ADFG to enact its management policy and manage escapements within their defined target ranges. Average escapements have been lower for recent years than for the 1977–1985 brood years, but they have also been closer to management goals in recent years. However, Hilborn and Eggers explicitly reject the proposition that management policy and improvements in management resolution have influenced the decline in escapements. They argue that a statistical relationship of escapement to total run strength is evidence that run strength, not managed harvest, is the determinant of escapements.
The cumulative escapement goal over all PWS management districts is 1.4 million pink salmon. Hilborn and Eggers (page 342) used an escapement goal of 1.8 million pink salmon for PWS. This apparent discrepancy is due to their recalculation of the goal to account for the different assumptions they used for stream life and the resultant expansion of aerial survey counts (Doug Eggers, Alaska Department of Fish and Game, personal communication). We used the published ADFG goals and index escapements because these represent the actual management target and outcomes.
From 1979 to 1985 (near the beginning of the hatchery era), escapements over several years were extraordinarily high, consistently exceeding the escapement goal range (Figure 6). The reasons for the high escapements are complex, but in large part they were a consequence of restricted harvests owing to conservative management (due, in turn, to the inability of managers to separate the hatchery and wild components of the catch), strikes by fishermen over price disputes in three seasons, and limitations on harvests imposed by processing capability as total runs increased in PWS. To provide better management resolution of hatchery and wild catch composition, ADFG and hatchery operators began representative marking of hatchery salmon with coded-wire microtags (Peltz and Miller 1990), which allowed the fishing fleet to target hatchery fish more effectively through improvements in time-area management. In the 1990s, coded-wire tagging was supplanted by mass marking of hatchery pink salmon with otolith thermal marks, which further improved discrimination between hatchery and wild fish in the harvest.
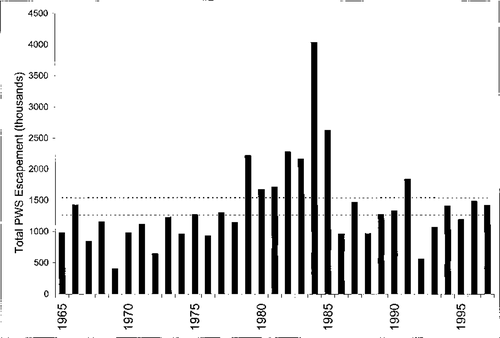
Prince William Sound (PWS) pink salmon cumulative escapements for the 1965–1997 brood years. Escapement data are from Morstad et al. (1998). The cumulative escapement goal ranges established by ADFG (Fried 1994) are indicated by the two horizontal lines
When we examine cumulative escapements in PWS relative to escapement goals, we find clear evidence that management success in PWS has improved during the “hatchery” era. Management objectives in PWS are actually expressed as a 10% range around a point goal (Fried 1994). Before the regime-shift years defined by Hilborn and Eggers and before any hatchery enhancement in PWS, cumulative escapements rarely fell in the escapement range; during the 1963–1976 brood years (1965–1978 return years), 3 of 14 (21%) escapements were within the range, and the 11 other escapements were below the range (Figure 6). During the 1977–1985 brood years (1979–1987 return years), which constitute the “good” years in Hilborn and Eggers's assessment of escapements, only 1 of 9 (11%) escapements was within the management range; 7 were above the range, and 1 was below (Figure 6). During the 1986–1995 brood years (1988–1997 return years), 5 of 10 (50%) escapements were within the management range, 1 was above the range, and 4 were below (Figure 6). An increasing ability to manage more precisely for escapement goals is also apparent from Figure 10 in Hilborn and Eggers (2000); in six of seven districts, the absolute deviations from the escapement goals have been less since 1986 than in previous periods, including the years of overescapement in the first half of the 1980s.
The impression given by Hilborn and Eggers is that consistently exceeding the PWS escapement goal in the early 1980s was good and that decline from these high escapements has been a negative impact of hatchery interactions. This argument contradicts the long-standing paradigm of pink salmon harvest management that overescapement of pink salmon triggers density-dependent reductions in returns per spawner. Hilborn and Eggers's analysis is actually an argument for higher escapement goals, not hatchery-induced escapement decline; certainly their production model indicates a higher maximum-sustained-yield escapement. Yet nowhere in their article do they advocate increasing escapement goals. Instead, they imply that the large investment and effort directed at meeting existing ADFG escapement goals through improving management resolution and the regulation of fishing effort have had no effect, and they conclude that escapement is simply an outcome of run size.
We are not surprised that Hilborn and Eggers find a significant relationship between run size and escapements. Harvest management is not perfect; it is difficult to balance the need to assess run strength and provide harvest opportunities for both hatchery and wild stocks with varying productivity with meeting district-specific escapement goals. Larger runs will tend to have larger escapements and smaller runs smaller escapements, resulting in a historical relationship between escapement and run strength. However, this statistical tendency should not be interpreted to mean that management efforts do not affect the realized escapements.
Alternate Explanations for PWS Wild Stock Declines
As Hilborn and Eggers note, the possibility exists that wild pink salmon stocks have declined in PWS from their high abundance in the early 1980s due to factors other than hatchery interactions. Climate change and oceanographic conditions may have caused differences in production cycles between regions; synchrony in the production history is not perfect, and substantial interannual variation occurs (Table 1; Figure 1). In PWS, hatchery survivals have declined over the time periods examined by Hilborn and Eggers, averaging 5.8% for the 1976–1985 brood years and 3.7% for the 1986–1995 brood years (Morstad et al. 1998). If we assume that hatchery survival is an indicator of wild stock survival, this 36% reduction in survival can explain virtually all of the reduction in returns per spawner for the latter years. The change in marine survival could have been symptomatic of density-dependent interactions with increasing numbers of hatchery fish, as proposed by Hilborn and Eggers. However, the reduction could also be a density-independent response to declines in zooplankton production in PWS. Since 1986, indices of spring zooplankton abundance have declined by 45% on average relative to the early 1980s when hatchery marine survivals and wild stock returns per spawner were high (T. Cooney, University of Alaska–Fairbanks, and D. Reggianni, Prince William Sound Aquaculture Corporation, personal communications). Because the combined abundance of hatchery and wild salmon fry has only a minimal predatory impact on PWS zooplankton (Cooney 1993), large fluctuations in zooplankton abundance probably have strong density-independent impacts on pink salmon growth and marine survival.
Changes in predator populations may also have affected the survival of pink salmon in PWS. Willette et al. (1999) found that Pacific herring and walleye pollock were the primary predators on juvenile salmon and that their predation rates on salmon were a function of the availability of large copepods. Pacific herring populations in PWS have fluctuated dramatically, experiencing large increases in biomass in the late 1980s and early 1990s followed by a collapse in 1993 (Marty et al. 1998). Hydroacoustic surveys have also indicated large increases in walleye pollock biomass in PWS (Bechtol 1999).
Another event in PWS during the “hatchery” era that could have affected wild stock productivity was the Exxon Valdez oil spill in 1989. A similar “before and after” comparison to the one Hilborn and Eggers used to argue that hatcheries have disproportionately depressed returns per spawner in PWS relative to other regions (e.g., Figure 3) can be applied to demonstrate that the oil spill caused the decline. Returns per spawner for the 1977–1988 broods averaged 6.5. For the 1989–1995 broods spawning after the oil spill, returns per spawner averaged 3.7, a 43% decline that was not observed in regions of Alaska not affected by the spill. Hilborn and Eggers point out that the maximum spill-induced losses estimated in the literature (Geiger et al. 1996) are too small to be detected on a PWS-wide basis. However, in the heavily-oiled Southwest District of PWS, Bue et al. (1998b) found elevated embryo mortality in oiled streams two generations after oiling. Heintz et al. (1999, 2000) showed that embryonic exposure to weathered oil not only results in elevated embryo mortality but also causes reduced growth and survival of individuals after incubation. Such indirect losses were a possibility that Geiger et al. (1996) specifically noted as a potentially large source of mortality not considered in their loss estimates. We agree that such effects might not be detectable in the aggregate production of pink salmon in PWS, but they would reduce returns per spawner on a site-specific basis and should be considered in comparisons of productivity among districts in PWS. We also note that simple time series comparisons can lead to simple, but not necessarily robust, conclusions.
How can we determine if declines in wild stock productivity in PWS are due to hatchery interactions or to some other ecosystem change? Both retrospective and empirical studies are needed. The retrospective population dynamics model of Hilborn and Eggers should be expanded to include a broad array of environmental variables. We are currently compiling historical data sets for such factors as temperature during different life history phases, spring zooplankton abundance, and predator populations in PWS to examine their effects relative to the magnitude of hatchery smolt releases on the productivity of the PWS wild stock.
The distribution of hatchery pink salmon in PWS provides an excellent opportunity for empirical research on the impacts of hatchery fish on wild stock productivity. The proportion of stray hatchery fish in streams in the Eastern and Southeastern districts of PWS is low, whereas in some streams in the western districts it is very high (Joyce and Evans 1999; Timothy L. Joyce, unpublished data). Similarly, the potential for interaction of wild and hatchery juveniles in nearshore marine habitats is much greater for wild populations in the western districts that are near hatcheries than for those in the Eastern and Southeastern districts. If straying and genetic introgression or competition in the marine environment have caused the decline in productivity, then very different responses in the different regions of PWS should be observable. A carefully designed study comparing spawning success, fry production, and marine survival between several wild populations exposed to different levels of interactions with hatchery fish could quantitatively address the degree of impacts.
Conclusions
Although Hilborn and Eggers have raised important concerns in their paper, their conclusion that hatchery pink salmon production in PWS has been a replacement rather than an enhancement of wild production is not justified and does not provide good guidance to policy makers. If Hilborn and Eggers were correct and their “best estimate” of a 2-million-fish increase in total production annually due to hatcheries were credible, then Hilborn's (1992) call for termination of the PWS hatchery program should be seriously considered. However, Hilborn and Eggers have greatly overestimated the potential for production by naturally spawning pink salmon in PWS and as a result have greatly underestimated net hatchery production. We estimated the net annual gain in the catch of pink salmon from PWS hatcheries to be 17.5–23.7 million, a range dependent on whether changes in productivity of PWS wild stocks have been due to interactions with hatchery fish or to ecosystem changes independent of the effects of pink salmon released from hatcheries. Thus, the situation is more complex than is implied by Hilborn and Eggers's overstatement of potential wild stock production; the enhancement program provides large benefits, but these benefits may have come with some degree of impact on wild stocks. Policy makers and managers need good information on the interactions of hatchery and wild fish to define better the impacts on wild populations, so that they can develop management policies that minimize the impacts while gaining the substantial benefits.


