Dorsal Coloration as an Indicator of Different Life History Patterns for Striped Bass within a Single Watershed of Atlantic Canada
Current address: North Carolina Division of Marine Fisheries, Post Office Box 539, Wanchese, North Carolina 27981, USA.
Abstract
The striped bass Morone saxatilis spawning within a single river system are generally considered to be members of a single population unit. For some rivers in Canada, however, fishers have reported different-colored groups of striped bass in the watershed during the prespawning and spawning seasons, which suggests the existence of population subgroups. We examined this “colormorph” phenomenon for a striped bass population in the Shubenacadie watershed of Nova Scotia, Canada. Spawning fish had three dorsal coloration patterns: green, which was indicative of fish from the ocean; black, which was indicative of fish that overwinter in a freshwater headwater lake; and mottled, which were fish of unknown origin. Body morphology appeared to be similar among the three groups. Although the age structures of the spawning populations revealed a wider range of age-classes among greenbacked fish, the growth aspects (e.g., length, weight, and length at age) were similar. We estimated that during the prespawning period, one-third of the population was actively foraging in the river; stomach contents suggested differences in diet among the morphs. Fatty acid analysis of gonadal material revealed significant differences between the green and black color types, indicating moderately long (months) separation and differences in feeding (i.e., ocean-based versus freshwater-based food webs). Otolith microchemistry analysis of strontium revealed that dorsal coloration at capture was indicative of long-term habitat separation. Whether these two groups are reproductively isolated is unknown.
Introduction
Throughout its natural range from Canada to the Gulf of Mexico, the striped bass Morone saxatilis exhibits a latitudinal difference in life history patterns (Setzler et al. 1980). Populations south of Cape Hatteras, North Carolina, are endemic riverine species; those north of Cape Hatteras are anadromous, spawning in freshwater or brackish streams during the spring and spending most of their adult lives in the ocean, undergoing extensive coastal migrations in the process. Juveniles tend to remain in fresh or brackish waters during the first year or two of life and then participate in coastal migrations as adults.
As a result of recent population declines, Canadian fisheries management agencies are increasing efforts to understand the life history of the striped bass inhabiting Canadian waters (Peterson 1991). However, few comprehensive studies have been conducted on specific populations. Recent monitoring has documented that only two spawning populations remain, one in the Miramichi River in northeastern New Brunswick (Robichaud-Le Blanc et al. 1996) and the other in the Shubenacadie River in Nova Scotia (Jessop 1995).
Commercial fishers on both river systems refer to two dorsal coloration patterns—black and green—as indicators of two different life history patterns occurring in the population. In the Shubenacadie watershed (Figure 1), adult striped bass that overwinter in the freshwaters of Shubenacadie Grand Lake (a large headwater lake) have a dark (black) dorsal coloration, and these fish migrate downstream to the spawning grounds in the spring. The adult fish migrating upstream from the ocean waters of Cobequid Bay (at the eastern head of the upper Bay of Fundy) during the spring spawning run have a green dorsal coloration (Rulifson and Dadswell 1995). Local fishers refer to these fish as “blackbacks” and “greenbacks,” respectively. The prespawning migration begins in May, and spawning activity usually begins the first week in June and terminates in late June when adult fish (presumably of both color types) migrate downstream to feeding grounds in the Bay of Fundy.

Map of the Shubenacadie–Stewiacke watershed, Nova Scotia, showing the entrance of the river into Cobequid Bay (the upper Bay of Fundy), the study site at the confluence of the Shubenacadie and Stewiacke rivers, and the Shubenacadie headwaters of Grand Lake near Halifax. Hatch marks indicate the present spawning location
The goal of our study was to determine whether the blackback−greenback phenomenon reported by local fishers represents two distinct groups of fish with different life history patterns spawning within a single river system. Fish were sampled from the commercial harvest and separated on the basis of visual interpretation of dorsal color type (differences are easily distinguished even to the casual observer). To find evidence of distinct groups within the population, the data were analyzed for differences in arrival time on the spawning grounds, sex ratio, age and growth, age structure, diet composition, the fatty acid profiles of selected tissues, and otolith microchemistry.
Study Site
The Shubenacadie River originates in Shubenacadie Grand Lake near Halifax, Nova Scotia, and meanders 81 km north before emptying into the terminus of the Bay of Fundy via Cobequid Bay and Minas Basin. A main tributary of the Shubenacadie River is the Stewiacke River, which enters the Shubenacadie approximately 37 km upstream of the mouth. The Shubenacadie–Stewiacke watershed is the largest in Nova Scotia, comprising nearly 2,800 km2 (Figure 1). This river system has a gentle gradient and therefore the tidal influence extends upstream approximately 64 km in the Shubenacadie River and 16 km in the Stewiacke River (Shubenacadie–Stewiacke River Basin Board 1981). The incoming tide arrives as a tidal bore, which is a very steep wave front that surges up the river and causes a change from low to high tide in approximately 1 h. Tidal ranges on the Shubenacadie River can be as much as 4 m on spring tides. Lynch (1982) presents a general description of tidal bores; a complete description of the Shubenacadie tidal bore and associated water quality is described in a companion study (Rulifson and Tull 1999; also see Tull 1997) .
Striped bass in this watershed spawn in the Stewiacke River approximately 3–6 km upstream of the confluence near the saltwater–freshwater interface (Rulifson and Tull 1999). During the study, the local commercial fishery consisted of a fleet of about 20 part-time gill-net fishers targeting American shad Alosa sapidissima and alewife A. pseudoharengus, also known as gaspereau. All fish caught were marketed through the local fish house located at the bank of the river.
Methods
Field examination
Fishery-dependent data on harvests by gill net were used to ascertain the age frequency and size distribution of the 1994 Shubenacadie spawning population. Because a variety of mesh sizes were used (83–127 mm stretch), sampling bias due to gear selectivity should have been minimal. The dorsal coloration of each fish was noted at the time of delivery to the fish house. Each fish was then measured to the nearest millimeter for total length (TL) and fork length (FL) and weighed to the nearest 0.2 kg. Scales for age analysis were removed from the left dorsal side of the fish between the anterior dorsal fin and the lateral line. Fish sold to the wholesale market were not processed further. Fish sold locally were processed by removing gonads, sagittal otoliths, and gastrointestinal tracts. Subsamples of ovaries and livers were frozen for fatty acid analysis.
Age analysis
Otoliths and scales were used to determine the age-class structure of both color types. Scales were mounted between two glass slides and read on a microfiche reader at 24× magnification. Two or more nonregenerated scales were read on three separate occasions for each fish. Scales that failed to have agreement in at least two readings were not used in age analyses. Because all fish were caught in the early spring (the onset of additional growth), the outer edge of each scale was counted as the last annulus. Otoliths were mounted on cardboard squares with Crystal Bond thermal plastic, cut dorsoventrally in the transverse plane into 1.0-mm sections with a Buehler Isomet low-speed saw fitted with a 0.006-μm Norton diamond grit wafering blade (Matheson 1981), and polished. Reflected light was used to view otoliths. As with the scales, multiple readings were made. Optimas software was used to make lateral measurements (to the nearest 0.01 mm) from the focus of the otolith to each ring (annulus). Rings that appeared opaque and continuous were recorded as an annual ring representing a year of growth.
Gut analysis
Approximately one-fourth of the harvested population was sampled for food habit analysis to determine whether diets differed between dorsal color types. Contents were removed from the gastrointestinal tract, separated into the lowest possible taxa, counted, and weighed.
Fatty acid analysis
Frozen ovarian tissue was analyzed for differences in fatty acids to provide biochemical evidence for the blackback–greenback phenomenon on a moderately long (months) time scale. Following Bligh and Dyer (1959), lipids were wet-extracted using a chloroform−methanol−water (2:2:1) solution. Neutral lipids and phospholipids were separated using a Suppelco LC-Si solid-phase extraction tube. Neutral lipids were eluted with a 5% solution of methanol in chloroform, and phospholipids were eluted with pure methanol. Phospholipids were separated using thin-layer chromatography (TLC) and a mixture of methyl acetate, isopropanol, chloroform, methanol, and 0.25% KCl as described by Chu and Ozkizilcik (1995). Phospholipids were viewed by spraying the TLC plates with 8-anilino-1-naphthalene sulfonate and examining them under ultraviolet light. Individual phospholipids were quantified by measuring the relative amounts of phosphorus. Individual spots were scraped off plates, and phosphorus was determined using Kjeldahl digestion and colorimetric analysis on an Orion Scientific Instruments Corporation autoanalyzer (EPA 1979). Quantities were measured to the nearest 0.01 μM. Identification and quantification of individual phospholipids was validated by placing known standards on the TLC plates parallel to the samples. Lipid fractions were then saponified and methylated in order to obtain fatty acid methyl esters, as described by Gallagher et al. (1984). A wide-bore capillary column made of boro-silicate glass was used to separate the fatty acids.
Samples were analyzed by a Varian 3740 gas chromatograph equipped with a flame ionization detector and an automated integrator recorder (Gallagher et al. 1989, 1991). Identification of individual fatty acids was carried out by comparing the retention time of the fatty acid to the retention time of a known fatty acid methyl ester standard. Also, logarithmic plots of retention times versus the number of carbon atoms were used to confirm identification. We then compared the fatty acid profiles and concentrations of individual fatty acids between black and green dorsal fish. Systat for Windows (Systat, Inc.) software was used for statistical analysis, which consisted of standard analysis of variance (ANOVA) and two-tailed t-tests with Bonferroni correction at a significance level of P ≤ 0.05.
Otolith microchemistry
The elemental composition of otoliths is indicative of the environments that fish experience over time, thereby providing a long-term record of life history (Gunn et al. 1992; Secor et al. 1994). This use of otoliths is based on two premises: (1) that the differences in water chemistry found in different water bodies (i.e., freshwater versus saltwater) are incorporated into the calcareous otolith matrix (Radtke and Shafer 1992; Secor et al. 1994) and (2) that otoliths are physiologically static accretions and are at no point reabsorbed (Campana and Neilson 1985).
Two methods were used to examine otolith microchemistry for differences in the patterns of strontium:calcium (Sr:Ca) ratio between color types. The first method was laser ablation inductively coupled plasma mass spectrometry (LA-ICPMS). In this technique, a high-powered, pulsed laser beam 10 μm in diameter is focused onto a particular section of an otolith. Once activated, the laser causes the photon energy to be converted into kinetic energy, vaporizing a portion of the otolith. The vaporized portion of the otolith is swept by argon gas into the plasma where it is atomized and ionized and subsequently analyzed by a mass spectrometer (Denoyer et al. 1991; Hall 1992). Target sample locations were the opaque and translucent zones in a linear transect between the otolith focus and outer edge. Up to 10 samples were taken for each otolith. Because of the experimental nature of the work and the limited number of samples (five blackbacks and four greenbacks, ranging from 7 to 10 years in age), the data for the two color types were plotted and compared visually for similarities and differences in the patterns of the 86Sr:48Ca ratios at corresponding annular and interannular locations on each otolith.
The second microchemical analysis was conducted with charged-particle-induced X-ray emission (PIXE), which is particularly well suited for rapid, nondestructive testing of solid samples for a broad range of elements. Because light particles such as the electron microprobe produce a relatively large bremsstrahlung X-ray background, protons are generally the probe of choice for their sensitivity in detecting elements with low atomic numbers, such as phosphorus, calcium, iron, zinc, arsenic, and strontium (Johansson et al. 1995). In addition, heavier elements can be readily identified using X rays excited from outer electronic shells (e.g., L X rays). For PIXE analysis, the sample is bombarded by a beam of “heavy” particles, generally protons or alpha particles, and the characteristic X rays induced by charged particle excitation of the sample atoms are detected by a high-resolution solid-state detector that can resolve X rays from the different elements in the sample. The intensity and energy of the detected X rays provide information on the type and quantity of atoms present in the sample.
The PIXE method was used in two different applications to identify microchemical signatures within the otolith (long-term life data) and on the external surface (days or weeks prior to capture). In the first trial, conducted at the University of Guelph, one black and one green sectioned otolith were subjected to a continuous PIXE microbeam starting at the focus and continuing to the outer edge; this generated a continuous record of Sr concentration over the life of the fish. In a second trial at East Carolina University, the convex surfaces of whole otoliths from all three color types were analyzed using a broad-beam PIXE system so as to summarize the general chemical signature of the outer several microns of the otolith surface (i.e., the recent record of overwintering habitat).
Results
Prespawning Migration Pattern
In 1994, striped bass arrived in the river system in large numbers early in the season (early May), probably as a result of a warm spring. Subsequently, a cold front delayed the potential for an early spawning and prolonged the period in which the adults were subjected to capture by the commercial fishery. Commercial catches of striped bass decreased during the spawning period as fish moved upstream into the protected spawning area where no commercial fishing was allowed.
Striped bass were landed commercially from May 5 to June 6, 1994. In all, 191 striped bass were sampled from commercial gill-net catches during this period, representing the largest 1-year data set assembled for this small population. Spawning activity was observed from June 2 to June 20 (Rulifson and Tull 1999). One-half of the harvested fish had black dorsal coloration, and 53 (28%) had green dorsal coloration. However, 41 fish (21%) had a third and unexpected dorsal coloration pattern, namely, a mottled appearance characterized by alternating patches of green and black. Mottled fish appeared to be a transition phase between the black and green color types.
The arrival of striped bass on the spawning grounds was analyzed by dorsal color type for two 14-d periods (Figure 2). The greatest number of fish (N = 146) were caught during the first 14 d of sampling (May 11–24) when commercial fishing intensity was highest. During this period, blackback fish made up the largest proportion of the sample (54%), followed by greenback (25%) and mottled (21%) fish. During the second period (May 25−June 7), only 45 fish were captured, with blackbacks and greenbacks more equally represented in the catches (40% and 38%, respectively) and mottled fish making up 22% of the total.
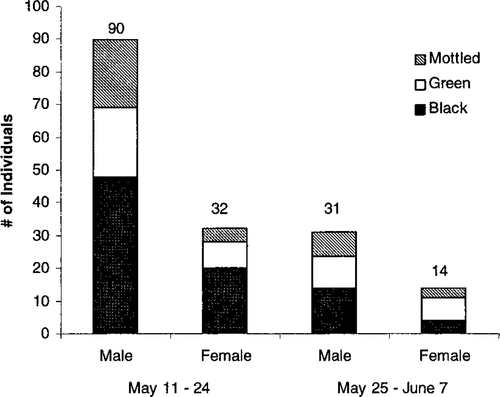
Catch distribution of striped bass in the Shubenacadie watershed by sex and dorsal coloration during early (May 11–24) and late (May 25–June 7) prespawning periods, 1994
Throughout both periods the male:female ratio was greater than 2:1 and the black dorsal coloration was more common in both sexes. However, the ratios of color types by sex changed between collecting periods. Females changed from a black: green: mottled (BGM) ratio of 63:25:12 in the first period to one of 29:50:21 in the second period. Male fish also showed a shift, but the black dorsal color remained dominant and mottled fish increased; the BGM ratio was 53:45:2 in the first period and 45:23:32 in the second period (Figure 2).
Age Determination
For fish less than 12 years old, there was good agreement between the ages determined from otoliths and scales, but disagreement occurred for fish 12 years and older. A total of 189 of the 191 scale samples were readable, and 115 otoliths were aged. There was a 90% agreement in ages derived by otoliths and scales, and when disagreement occurred it was never by more than 1 year. When using otoliths as the standard, 4 of 115 fish (3%) were overaged and 7 (6%) were underaged by using scales.
Age Frequency and Size Distribution
The striped bass landed during the Shubenacadie spring fishery ranged from age 4 (441 mm FL and 1.16 kg on average) to age 16 (1,020 mm FL and 11.18 kg; Table 1). The dominant year-classes were ages 4 and 5, which composed 50% and 30% of the overall catch, respectively. Male fish ranged in age from 4 to 15 years and females from 4 to 16 years.

Age-classes were not uniformly represented when the catch was separated by color and sex (Table 1). Male blackbacks had only three age-classes (ages 4, 5, and 6), whereas male greenbacks had four age-classes (4, 5, 9, and 15) and male mottled fish had five age-classes (4–8). Female blackbacks had seven age-classes (4–10), female greenbacks had eight age-classes (4–7, 9, 10, 11, and 16), and mottled females had five age-classes (4–7 and 15). Catches of female blackbacks were primarily of age-4 (39%) and age-5 (25%) fish. Greenbacks had higher percentages of older females in the overall catch, 18.8% for age-9 fish and 25.0% for age-7 fish. Mottled females were dominated by age 6 (50%). Because the age frequency distributions, particularly for the older age-classes, were affected by small sample sizes, the observed differences between color types should be considered cautiously.
Although the age-class structures were different among the three color types, the growth patterns based on back-calculated FLs were similar, suggesting that growth was not a criterion for separating the groups.
Food Habits
Prey items varied among dorsal color types (Table 2). During the study, approximately one-fourth of the entire catch (44 fish) were sampled and 14 (32%) contained food, suggesting that about one-third of the population was actively foraging during prespawning activity. Three species were exclusive to the stomachs of blackback fish: sticklebacks, Atlantic silversides, and American eels. The stomachs of greenback fish contained two species, alewives and flounders, which were not represented in the stomachs of blackback fish. Mottled fish were similar to greenbacks, with alosid species comprising the majority of the mean volume content for both color types. Postspawning adults were not examined.
Fatty Acid Analysis
Prior to statistical analysis, the fatty acid content of sampled fish was compared visually using gas chromatography plots of fatty acid profiles versus retention time. Without any prior knowledge of dorsal coloration, researchers separated fish into two groups based on the visual similarity of the plots (mottled fish were not tested). Each plot was then identified by dorsal color type. All but one of the fish were successfully separated into the black and green groups based only on visual identification of their fatty acid profiles. This simple exercise indicated that fish of the same dorsal coloration had similar concentrations of the different fatty acids. Additionally, cluster analysis of the fatty acid data placed the fish into two groups, blackbacks and greenbacks.
The dominant fatty acids in eggs and livers varied significantly between blackback and greenback female striped bass. The eggs of four blackbacks and four greenbacks were analyzed for fatty acid composition. The dominant fatty acids present in the phospholipid fraction of the eggs were, in decreasing order of importance, 22:6, 18:1 n-9/n-7, 20:5 n-3, 16:1 n-7, 16:0, and 18:0. More than 50% of the neutral fraction of the lipids was represented by 18:1 n-9/n-7, 16:1 n-7, and 17:1, in that order. Fatty acid 17:1 was seen only in the neutral fraction, where it made up over 9% of the lipids present. An independent-samples t-test of the phospholipid fraction showed that blackback striped bass had significantly (P < 0.05) higher levels of 20:4 n-6 than did greenbacks, while greenbacks had significantly higher levels of 20:5 n-3. Analysis of the liver fatty acid content of three blackbacks and three greenbacks also showed that the blackbacks had significantly higher levels of 20:4 n-6 while the greenbacks had significantly higher levels of 20:5 n-3 (Table 3). No other fatty acid in the phospholipid fraction differed significantly.
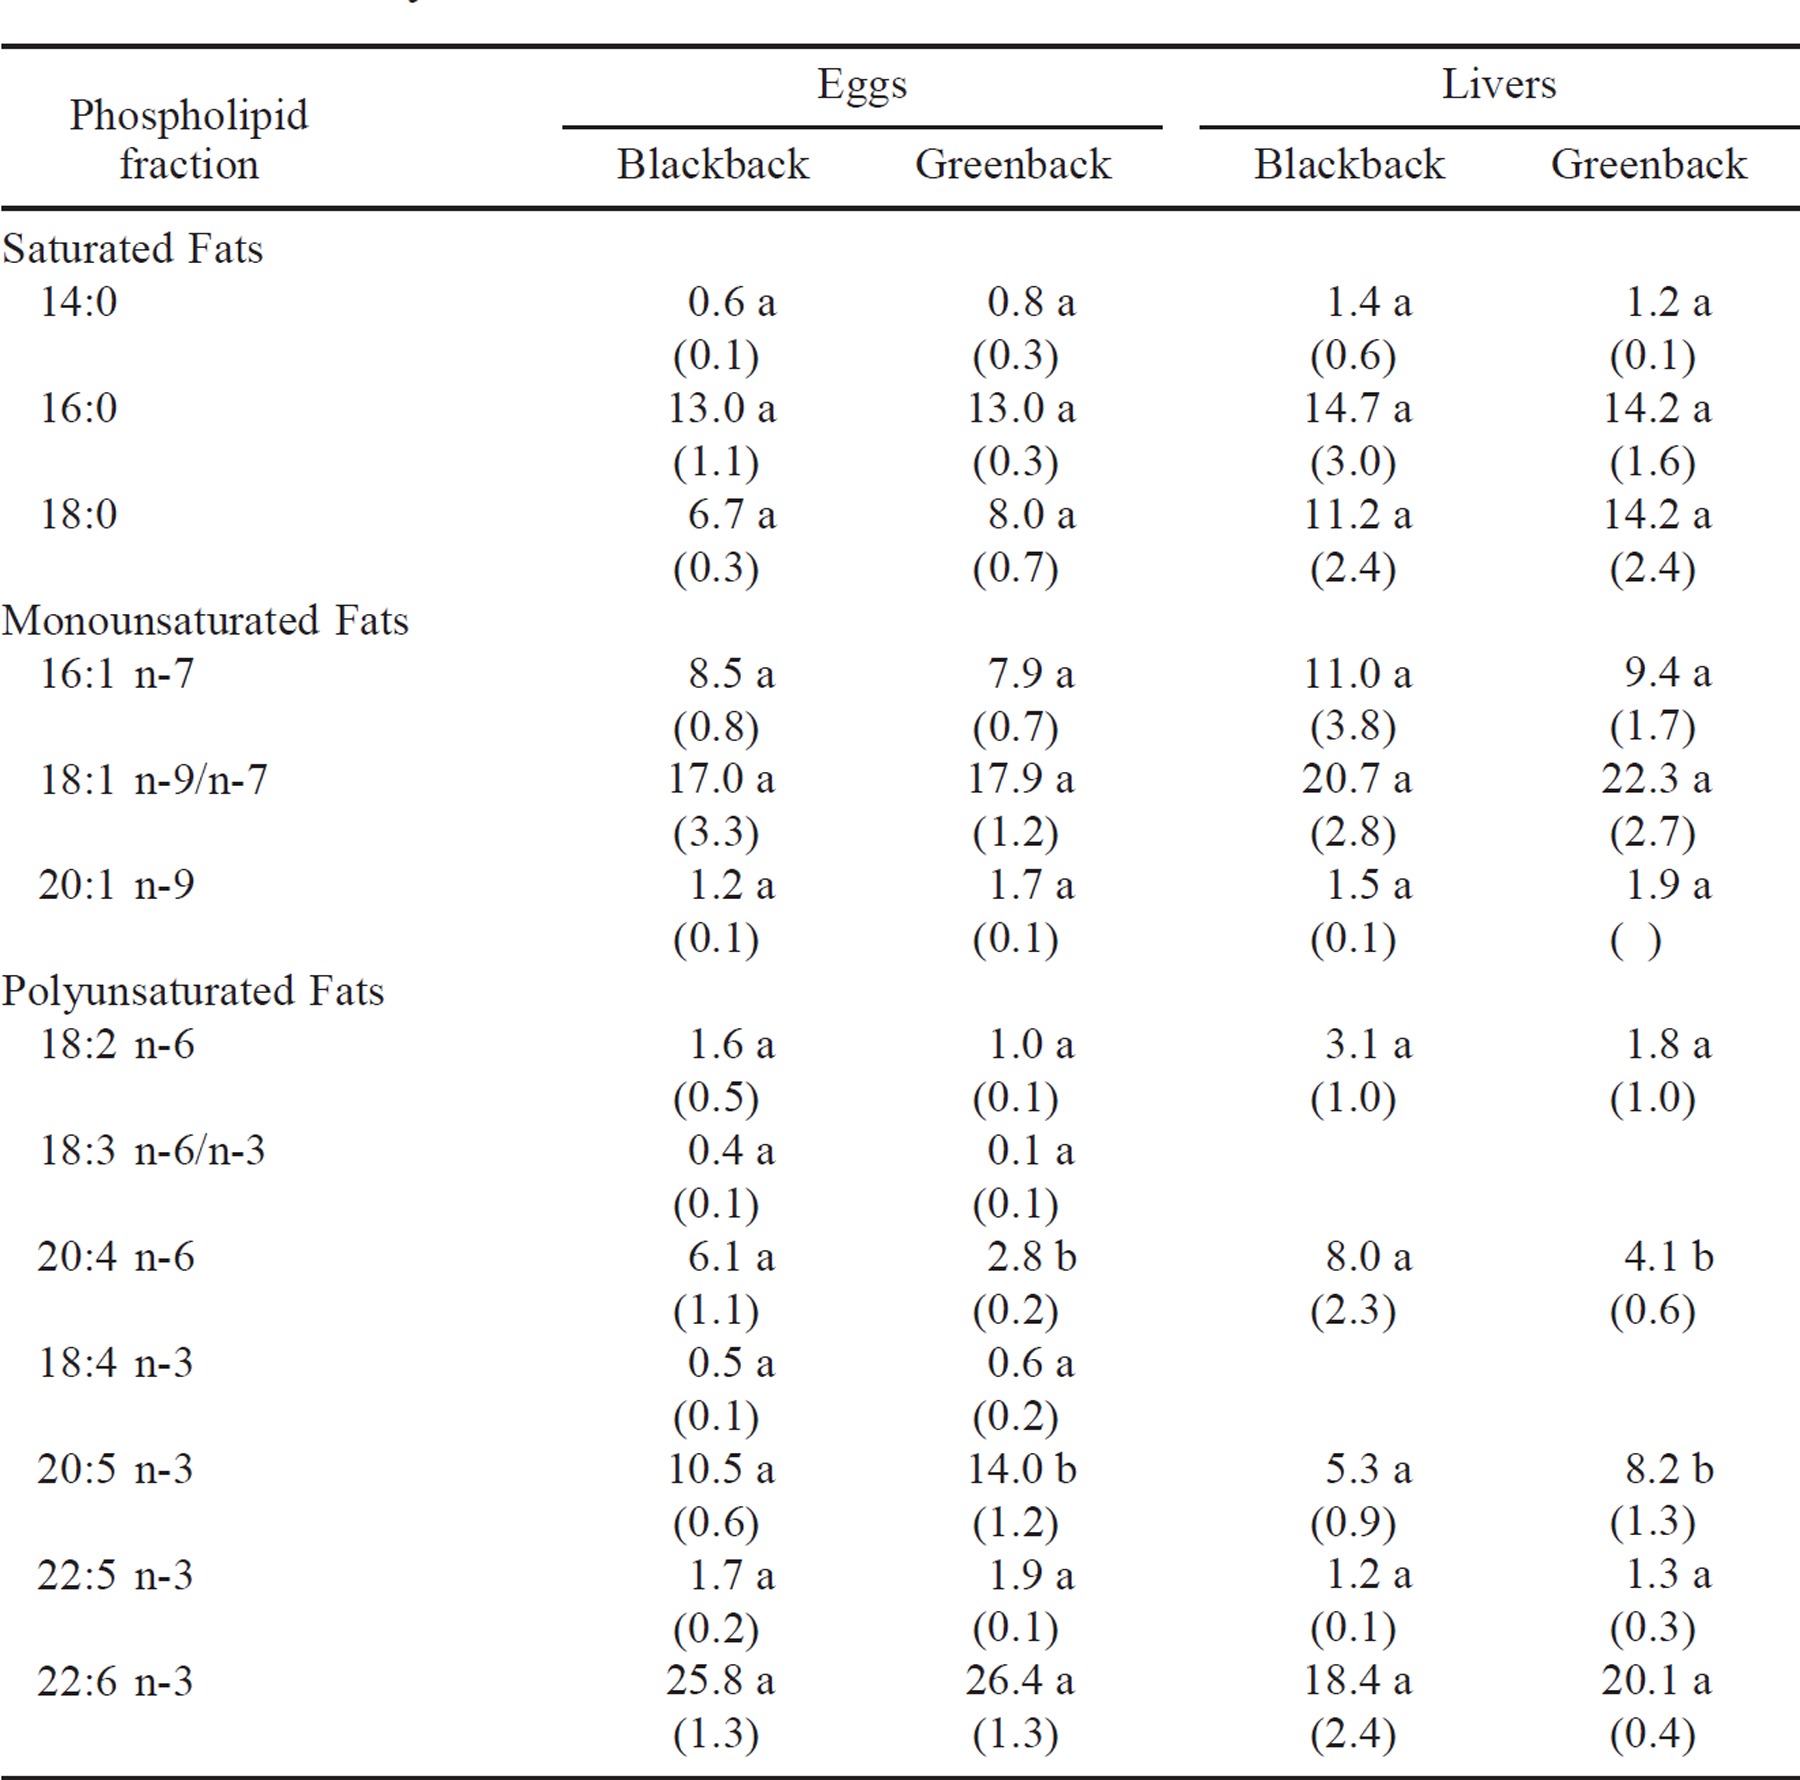
There were no significant differences in the concentrations of individual phospholipid groups based on dorsal coloration. The major phospholipid present in the eggs of blackback females was phosphotydlinositol (49%); other phospholipids included phosphotydlcholine (16%), phosphotydlethanolamine (15%), lysolecthin (12%), and sphingmylein (8%).
Otolith Microchemistry
Plots of the 86Sr:48Ca ratios obtained by laser ablation versus otolith location (age) showed that the patterns of Sr deposition varied between color types, therefore indicating long-term separation of habitats in this population (Figure 3). While otoliths show similar 86Sr:48Ca ratios when assayed in the focus and to some extent at age 1, a divergence begins thereafter, with greenbacks maintaining a high 86Sr:48Ca ratio relative to blackbacks. With the exception of three individuals, all fish exhibited this pattern. One blackback and one greenback exhibited an intermediate 86Sr:48Ca ratio when translucent zones were assayed, and one greenback apparently switched from a greenback to a blackback life history pattern at 3.5 years of age.
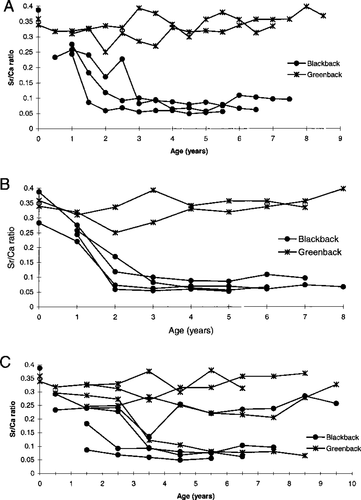
The strontium:calcium (Sr:Ca) ratios of selected blackback and greenback otoliths determined by laser ablation. Panel (A) includes opaque and translucent zones (N = 5), panel (B) only opaque zones (N = 6), and panel (C) only translucent zones (N = 8)
The PIXE analysis confirmed these long-term differences in habitat between color types, along with identifying overwintering locations. The PIXE microbeam test indicated fluctuating Sr levels in greenbacks associated with anadromous behavior (Figure 4), while the blackback otoliths exhibited a more stable and continuous Sr level indicative of long-term freshwater residency (Figure 5). The broad-beam PIXE analysis of the convex surfaces of whole otoliths showed an unexpected peak in arsenic in black-colored fish at an X-ray energy level of approximately 10.5 keV, which was not present in fish of green dorsal coloration (Figure 6). Freshwater lakes in Nova Scotia are known to contain naturally high levels of arsenic (R. Bradford, Fisheries and Oceans Canada, personal communication), which would be consistent with its incorporation into the otolith matrices of overwintering striped bass.
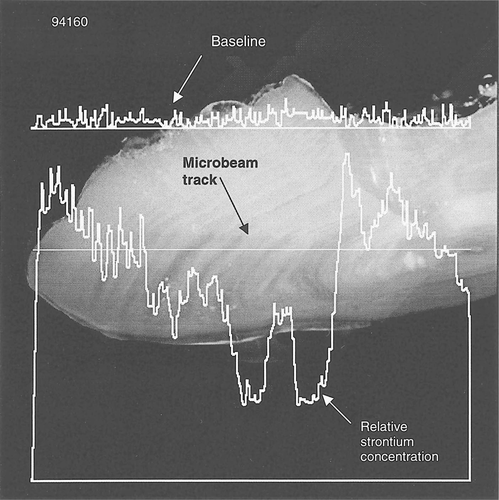
Continuous record of the strontium level in an otolith from a greenback fish (specimen 94160) determined by charged-particle-induced X-ray emission microbeam (photo and plot by J. L. Campbell, University of Guelph, and N. M. Halden, University of Manitoba)
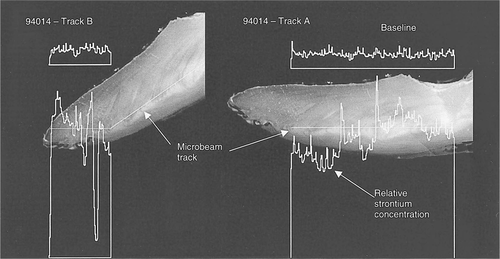
Continuous record of the strontium level in an otolith from a blackback fish (specimen 94014) determined by charged-particle-induced X-ray emission microbeam (photo and plot by J. L. Campbell, University of Guelph, and N. M. Halden, University of Manitoba)
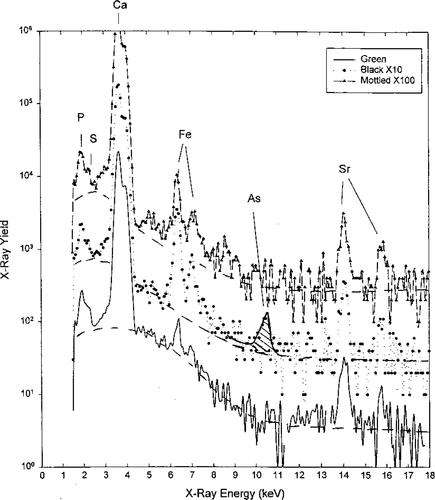
Proton induced X-ray spectra of the outer convex surface of three striped bass otoliths produced by charged-particle-induced X-ray emission broad-beam analysis (plot by L. Toburen, East Carolina University). Note the arsenic (As) peak for blackback striped bass at approximately 10.5 keV, which is not evident for the green or mottled color types. The proton energy was 2 MeV and the X rays were observed through a 0.5-mm polyethylene filter to reduce the count rate of low-energy X rays
Discussion
One might question whether coloration can be used as a discriminator of population sub-groups since fish can be observed to change color rapidly under stressful conditions. However, we believe that the differences in dorsal coloration patterns observed in this population represent transient external characteristics that may prevail in individuals for months prior to river migration and then for days or weeks during the river migration prespawning period. Color change in fish species occurs in two ways: (1) as a rapid physiological response caused by rearrangement of the pigments in the chromatophore cells and (2) as a slower morphological change caused by an increase in the net content of pigment or the number of pigment cells (Fujii 1969). Both types of color change can occur simultaneously. Fish kept in darkened tanks for extended periods typically develop increases in both the number of melanophores and the melanin content of the skin (Odiorne 1957). The presence of the black dorsal coloration type could be explained by the extended overwintering period in the darkly stained waters of Shubenacadie Grand Lake.
The mottled dorsal coloration pattern was unexpected and probably represents fish that are actively undergoing change in dorsal coloration. The slower morphological color change process could explain the patchy, alternating areas of dark and light observed on some fish. We speculate that the mottled fish were upriver migrants from the ocean because their food habits were similar to those of greenbacks and their otoliths did not exhibit the arsenic peak characteristic of blackback fish. How long this transition period lasts is unknown.
Differences in lipid profiles between the two dorsal color types confirmed long-term habitat separation prior to capture. Reiser et al. (1963) reported that freshwater and marine fish probably do not differ basically in their mechanisms for deposition, synthesis, and interconversion of fatty acids but that there are differences in fatty acid composition among groups. Kelly et al. (1958) and Stansby (1967) concluded that differences in fatty acid patterns between marine and freshwater fish were caused by differences in diet. Nettleton (1985) described how the fatty acid content in fish could be affected by factors such as season, diet, physiological status (i.e., spawning), and geographical habitat. A group of fish experiencing one set of these factors would produce a particular fatty acid pattern, thus indicating differences in its life history from that of a group experiencing a different set of factors. In our study, fish with green dorsal coloration had significantly more 20:5 n-3 and less 20:4 n-6 fatty acids than fish with black dorsal coloration. The fatty acid 20:5 n-3 and other long-chained omega-3 fatty acids (e.g., 22:6 n-3) are found in marine phytoplankton and zooplankton (Zuier 1985), thus indicating that greenback fish were consuming a marine-based food web for months prior to capture. One additional aspect of the lipid profiles was noted. The presence of large amounts of 17:1 in the neutral lipid fraction was unusual because low levels of 17:1 have been reported in cultured (0.6–0.8%) and wild (0.3–0.5%) striped bass (Jahncke et al. 1991). Low levels also were reported for several species by Karitaranta and Linko (1984). Other researchers (Eldridge et al. 1983; Chu and Ozkizilcik 1995; Harrell and Woods 1995) have not reported this unusual fatty acid in their studies.
Strontium patterns in the otoliths provided lifetime records indicating long-term seasonal habitat separation of the two dorsal color types after age 1. Secor and Rooker (2000) demonstrated patterns of change in the strontium:calcium ratio for young striped bass, American shad, and Atlantic sturgeon Acipenser oxyrinchus emigrating from oligohaline nurseries. Secor et al. (1995) demonstrated a sawtooth pattern of high and low Sr:Ca ratios with age that indicated movement between marine and freshwater habitats for spawning. However, in our study, the plots of the 86Sr:48Ca ratio over time for individual fish did not produce this sawtooth pattern. Blackback fish did exhibit low 86Sr:48Ca ratios consistent with overwintering in the freshwaters of Shubenacadie Grand Lake, while greenback fish exhibited high ratios indicating overwintering in ocean habitats. Interestingly, the 86Sr:48Ca ratio patterns for the spring spawning run and summer periods did not converge to suggest similar habitat occupancy. Instead, the spring–summer (translucent) portions of the otoliths maintained their respective high or low 86Sr:48Ca ratios, similar to that of the overwintering (opaque) regions.
Several different factors may explain this observation. One possibility is continued habitat separation even during the prespawning period. While blackback and greenback fish migrate into the same areas of the river in the spring to spawn, they may remain separated because they inhabit different salinity regimes. This is quite possible, as the tidal bore causes salt wedges to form readily and also provides a low-energy transport mechanism by which greenback fish can migrate upstream. A second possibility is that both color types do not spend enough time in similar habitats to cause a convergence in the corresponding 86Sr:48Ca ratios; fish may be on the spawning ground for less than 2 weeks before migrating into spring and summer feeding grounds. A third possibility involves the mechanics of microchemical analysis; spatial resolution of the laser ablation beam may not be capable of capturing a sample small enough and at the precise location required to assay the brief time window in which the fish are on the spawning grounds. A fourth possibility is that the minimal samples collected by LA-ICPMS were not adequate to show the full life history pattern of the fish. Each opaque and translucent zone was ablated only once; multiple ablations in each zone may have revealed a pattern more fully representative of the fish's migratory pattern.
Unfortunately, none of these pieces of evidence—diet, fatty acids, or otolith microchemistry—indicate whether these two groups are reproductively isolated despite spawning in the same region of the river. If both groups interbreed during spawning, then genetic differences in the progeny would be nonexistent and the morphs would merely represent phenotypic plasticity.
There is evidence to suggest some temporal separation in spawning between the two color types. The ratio of blackback to greenback fish was highest during the first 2 weeks of the study, while greenbacks, particularly females, increased in abundance during the last 2 weeks of sampling. Varying arrival times of striped bass at the spawning ground could be an indication that fish are migrating in cohorts (with dorsal color a fortuitous but transient clue), with perhaps a mixing of resident or native fish and transients or introgressors from another population. While the color composition of fish that we landed changed during the study, the male:female ratio of 2:1 remained unchanged. This ratio is similar to that found in a 1992 study on the same population (Rulifson and Dadswell 1995).
Additional studies are needed to more completely understand the multiple life history patterns of the Shubenacadie striped bass population. Tagging of striped bass during the spawning run could provide direct evidence of any differences in the life histories of blackback and greenback fish. Tank studies of fish, which would be very feasible if this population were selected as broodstock (Rulifson and Laney 1999), could test the effects of diet, salinity, and other factors on dorsal coloration.
The existence of multiple life history patterns in a single river may cause fishery management agencies to reassess management strategies based on the generally accepted paradigm of a single population with one migratory pattern. Further studies may be needed to establish whether these groups are genetically distinct and thus require additional management consideration.
Acknowledgments
We thank the many people who contributed to this project: R. Meadows, W. H. Stone and family, R. C. Covert, and the commercial fishermen of the Stewiacke and Shubenacadie rivers; East Carolina University (ECU) students K. Tull and W. H. Tarplee III for field assistance; ECU students R. A. Bass, J. Anglemyer, E. Haire, and K. Antkowiak for laboratory work; M. Gallagher of ECU for fatty acid analysis; C. S. Manooch III and J. Potts, National Marine Fisheries Service, Beaufort Laboratory, for otolith aging; S. Campana, Bedford Institute of Oceanography, for otolith preparation; Sam Wang, Elemental Research, Inc., North Vancouver, B. C., for LA-ICPMS analysis; J. L. Campbell, University of Guelph, and N. M. Halden, University of Manitoba, for PIXE microbeam analysis; L. Toburen of ECU for PIXE broadbeam analysis; and C. C. Coutant, R. Peterson, J. Waldman, and an anonymous reviewer for comments that improved the manuscript. We also thank B. M. Jessop of the Canadian Department of Fisheries and Oceans for his help in obtaining the necessary permission to conduct the study. The authors and students provided funding for this study, with assistance from the fishermen and ECU's Department of Biology and Institute for Coastal and Marine Resources.


