Predictive Value of Low BMD for 1-Year Fracture Outcomes Is Similar for Postmenopausal Women Ages 50-64 and 65 and Older: Results From the National Osteoporosis Risk Assessment (NORA)
Abstract
The relationship of low bone mass and fracture in younger postmenopausal women has not been extensively studied. In a large cohort of postmenopausal women ≥50 years of age, we found the relationship of BMD measured at peripheral sites and subsequent 1-year fracture risk to be similar between women <65 and those ≥65 years of age.
Introduction: Low bone mass and fractures are prevalent in older postmenopausal women. However, the frequency of low bone mass and fracture in younger postmenopausal women has not been studied extensively. There are very limited data regarding the association between BMD measurements and fractures in postmenopausal women who are between the ages of 50 and 64.
Materials and Methods: In the National Osteoporosis Risk Assessment (NORA) we studied the frequency of low bone mass and its association with fracture in women 50-64 years of age in comparison with women ≥65 of age. NORA enrolled 200,160 postmenopausal women ≥50 years of age who had no prior diagnosis of osteoporosis. Baseline BMD was measured at the heel, forearm, or finger. A 1-year follow-up survey requesting incident fractures since baseline was completed by 163,935 women, 87,594 (53%) of whom were 50-64 years of age. The association between BMD and fracture was assessed using logistic regression, adjusted for important covariates.
Results: Thirty-one percent of women 50-64 years of age had low bone mass (T scores ≤ −1.0) compared to 62% of women ≥65 years of age. During the first year of follow-up, 2440 women reported fractures of wrist/forearm, rib, spine, or hip, including 440 hip fractures. Nine hundred four women 50-64 years of age reported fractures, including 86 hip fractures, accounting for 37% of fractures and 20% of hip fractures reported in the entire NORA cohort. Relative risk for osteoporotic fracture was 1.5 for each SD decrease in BMD for both the younger and older groups of women.
Conclusion: Low BMD in younger postmenopausal women 50-64 years of age showed a 1-year relative risk of fracture similar to that found in women ≥65 years of age.
INTRODUCTION
LOW BONE MASS and fractures are known to be prevalent in older postmenopausal women.1-3 However, the frequency of low bone mass and fracture in younger postmenopausal women has not been extensively studied. There are very limited data regarding the association between BMD measurements and fractures in postmenopausal women who are <65 years old. The National Osteoporosis Risk Assessment (NORA) is a longitudinal observational study that includes over 200,000 postmenopausal women who range in age from 50 to 104 years who had baseline peripheral BMD measurements. In this report, we provide information about the frequency of low BMD and fractures in postmenopausal women 50-64 years of age who reported incident fractures in the year after BMD testing compared with the association between low bone mass and 1-year fracture risk in NORA women who were ≥65 years of age.
MATERIALS AND METHODS
Participants
NORA is an observational study of postmenopausal women in the United States that began recruitment in late 1997. Details of the design and initial results from the study have been published.4, 5 In brief, women who were at least 50 years old and at least 6 months past their last menstrual period, who had no previous diagnosis of osteoporosis, no BMD testing in the preceding 12 months, and no current use of bone-specific medications (calcitonin, bisphosphonate, or raloxifene) were eligible for participation. Use of hormone therapy (HT) with estrogen alone or with a progestin was allowed. Participants were recruited from the practices of 4236 primary care physicians in 34 states and the District of Columbia between September 1997 and March 1999. Physicians were identified based on having large numbers of postmenopausal women in their practices and not having in-office bone densitometry equipment. Approximately 17% of invited physicians agreed to consider participating, and 75-80% of this group did participate. Each physician office provided randomly selected names of up to 300 eligible women, of whom between 40 and 100 agreed to enter the NORA study. At baseline, participants completed a mailed set of questionnaires and had a peripheral BMD measurement (heel, forearm, or finger) at the physician's office. The questionnaires included demographic data and risk factors for osteoporosis, including personal and family history of fracture, lifestyle behaviors, and medication use. Baseline data were collected from 200,160 white, black, Asian, Hispanic, and Native American women. Approximately 12 months later, follow-up questionnaires inquired about fractures that had occurred since enrollment in NORA. Women who responded to the follow-up survey and who had complete information on age and BMD were included in this analysis. All study protocols were approved by the Essex Institutional Review Board, a national IRB, and informed consent was obtained from all participants.
BMD measurement
Each participant had BMD measured at a single peripheral site: heel, either single X-ray absorptiometry (SXA; Osteoanalyzer; Norland, Fort Atkinson, WI, USA) or ultrasound (US; Sahara; Hologic, Bedford, MA, USA); forearm, peripheral DXA (pDXA; Norland; Fort Atkinson, WI, USA); or finger pDXA (AccuDXA; Schick, Long Island City, NY, USA). The proportion of younger and older women measured on each device was similar.
Instruments were calibrated daily and in each new location. Testing was performed by licensed technicians who had completed training both by the equipment manufacturers and by the International Society for Clinical Densitometry. Quality assurance and quality control were maintained by staff at the quality assurance center at Synarc (Portland, OR, USA) who monitored scans according to a rigorous formal protocol.6 Quality assurance consisted of centralized training of technologists and random review of scan acquisition and analysis throughout the data collection phase. Scan quality was judged on correct patient positioning, the absence of preventable artifacts, and correct bone determination on analysis. The threshold for QA was 96% error-free. Quality control comprised daily internal calibrations used to detect instrument failure and to diagnose instrument problems.
Definition of low BMD
T scores were calculated from the young adult normal white reference databases as reported by the equipment manufacturers. The association of BMD per SD decrease with risk of fracture has been shown to be comparable whether calculated from the manufacturer's young adult reference database or from the mean BMD of the NORA cohort.7 We have previously reported that in the NORA population a T score of < −1 was associated with an increased risk of fracture and that each of the peripheral BMD measurements (heel, forearm, or finger) were similarly predictive of increased risk of fracture during the year after the baseline evaluation.7 Therefore, we calculated the relative risk per SD for each age group for all devices combined. In addition, BMD and relative risk were calculated for each age group by each device for overall osteoporotic fractures.
Incident fractures
Approximately 12 months after enrollment, each participant received a follow-up questionnaire that included questions about new fractures. If a participant reported four or more new fractures, these data were excluded from the analysis because these fractures were more likely to have been the result of major trauma rather than have been low trauma or fragility fractures. For these analyses osteoporotic fractures include self-reported fractures at wrist/forearm, rib, spine, or hip, a classification consistent with other reports.8-11
Data analysis
All analyses were conducted using SAS Version 8 software (SAS Institute, Cary, NC, USA). Women were dichotomized by baseline age into two groups: 50-64 years and 65+ years of age. T scores were used as a continuous variable and as categories (> −1.0, −1.0 to −2.0, or ≤ −2.0). The relationship of age and BMD with incident fracture and covariates were examined in bivariate analysis. Statistical significance of the relationship was tested using χ2 for categorical variables and Student's t-test for continuous variables.
Fracture incidence rates per 1000 person-years were calculated by age group and fracture type. Logistic regression models were used to estimate the effects of low BMD and age on incident fractures compared with women with BMD T scores > −1.0, while controlling for other potentially confounding variables. We estimated the relative risk of fracture associated with a 1 SD decrease in BMD in women 50-64 and ≥65 years of age using logistic regression analysis. To examine the differences in the ability of bone density to predict fractures in women of different ages, we tested for the significance of age and BMD interaction terms in logistic regression models. The relative risk associated with 1 SD decrease in BMD for overall combined osteoporotic fractures was estimated for each age group and BMD measurement device to determine the effect of the measurement device. Potential confounding variables were selected based on existing literature and significance in the bivariate analysis. All reported p values are from two-tailed tests of statistical significance.
RESULTS
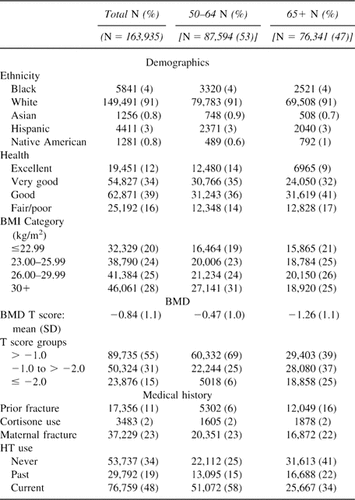
These analyses are based on 163,935 women who responded to the 1-year follow-up survey, including 87,594 (53%) women who were 50-64 years of age (mean, 57 ± 4.7 years) and 76,341 (47%) who were 65-99 years of age (mean, 72 ± 5.6 years). Table 1 shows the association of demographic and clinical factors and age group. Compared with the older women, the younger women were more likely to report excellent/good health and fewer prior fractures, to be current users of HT, to have higher body mass (body mass index [BMI] > 30 kg/m2), and to have higher T scores (all comparisons significant at p < 0.01). Overall, 31% of the younger women and 62% of the older women had low BMD defined as T score ≤ −1.0. As shown in Table 2, the frequency of low BMD varied by skeletal site and measurement device: heel tests yielded the smallest proportions of osteoporosis compared with women measured at the forearm and finger. These results were similar for women in the younger and older age groups measured on the same device.
A total of 2440 incident osteoporotic fractures were reported in the cohort within 1 year of baseline. Women 50-64 years of age reported 905 (37%) of the fractures, and women ≥65 years of age reported 1535 (63%) of all the fractures (Table 3). Although women 50-64 years of age had fewer fractures than women older than 65, they still accounted for more than one-third of the total osteoporotic fractures and one-fifth of the hip fractures that occurred within 1 year of baseline. The overall incidence rates (IR; per 1000 person-years) for all osteoporotic fractures combined and at each individual site were lower (approximately one-half the rate) for women 50-64 years of age than for women ≥65 years of age. However, when categorized by T score (Fig. 1), the incidence rates for all osteoporotic fractures were only 25-30% lower in younger women compared with older women within the same T score category, and the incidence of wrist/forearm fractures was only 10-14% less in younger versus older women. As shown in Fig. 1, the incidence of fracture increases as T score decreases in both age groups.

Incidence of fractures (fractures/1000 person-years) for all fracture sites combined and each individual fracture site according to T score group and age group.
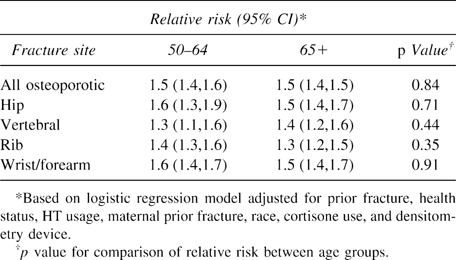
In multivariate analysis, accounting for the effects of BMI, prior fracture, health status, maternal history of fracture, race, HT use, and cortisone use, the relative risk for fracture for each SD decline in BMD was the same in the younger and the older women (Table 4). For all osteoporotic fractures combined, the relative risk for fracture was 1.5 for each 1 SD decrease in BMD for both age groups (p = 0.84 for comparison of RR between age groups). The same relationship of BMD to fracture risk between the two age groups is found for each individual fracture site as well (Table 4). Additional analyses were performed to calculate the BMD measurement device effect on the association of age and BMD per SD decrease. The RR was comparable between age groups within each device for all devices and across age groups and devices except for the finger AccuDXA (Table 2).
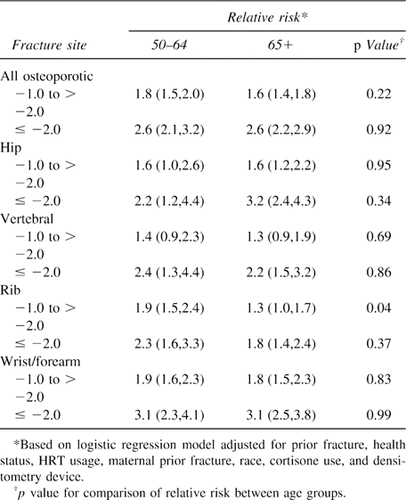
Table 5 shows the relative risk for fracture for BMD below T score −1.0 (−1.0 to −1.9 and ≤ −2.0) for women in each age group compared with all women with T score > −1.0. Again, the relative risk for fracture for women with low BMD was similar between the two age groups. Both younger and older women with T scores that were −1.0 to > −2.0 had a relative risk for osteoporotic fractures of 1.8 (younger) and 1.6 (older), and in both age groups, women who had T scores ≤ −2.0 had a relative risk for all fractures of 2.6 compared with women with T scores > −1.0.
DISCUSSION
It has been known for many years that the absolute risk for fracture increases with increasing age at the same level of BMD.12 The fracture incidence rates found in NORA are lower in postmenopausal women 50-64 years of age than in women ≥65 years of age; for all osteoporotic fractures, the fracture incidence for younger women was 8.4/1000 person-years compared with 16.5/1000 person-years in older women. Nevertheless, younger postmenopausal women experience fractures: 37% of the osteoporotic fractures and 20% of the hip fractures occurred in the younger NORA women, who made up ∼50% of the NORA population. Furthermore, NORA data reveal that younger and older women with a peripheral BMD T score < −1.0 are at a similar increased relative risk for fracture. To the extent that BMD is an important risk factor for fracture in older women, it is also important in women 50-64 years of age.
Our findings indicate a consistent pattern of a higher fracture incidence and lower peripheral BMD T score in both the younger and the older women for all fracture sites. In multivariate analysis controlling for differences in baseline characteristics between the two age groups, including prior fracture, health status, HT usage, maternal history of fracture, race/ethnicity, cortisone use, and densitometry device, we found that the relative risk for all fracture sites is very similar between the younger and older women for each 1 SD decline in BMD. For example, the relative risk per 1 SD decline in BMD was 1.6 (95% CI: 1.3, 1.9) for hip fracture and 1.5 (95% CI: 1,4, 1.6) for osteoporotic fracture in the younger age group compared with 1.5 (95% CI: 1.4, 1.7) and 1.5 (95% CI: 1.4, 1.5) in the older age group. Therefore, low BMD, regardless of age, is a strong predictor of fracture and should be considered in the clinical management of all postmenopausal women.
NORA is the first prospective study that includes a cohort of women <65 years of age that is large enough to compare the relationship of BMD and fracture risk within this age group and with women >65 years of age. Gardsell et al.13 did include women between age 50 and 60 in their study and observed that forearm BMC was a stronger predictor of fracture than age when both were included in the model. Other studies primarily focus on women ≥65 years of age, so that direct comparison of the magnitude of the relationship between BMD and fracture according to age is limited. Nevertheless, we found that the magnitude of the association between BMD and both all fractures and each individual fracture was similar to that found in previous studies.1, 3,7, 14, 15
It may be of concern that peripheral devices were used to determine BMD T scores in that T scores obtained by peripheral devices may not always be as low as T scores determined from central DXA devices.16, 17 The discrepancies between T score calculations among various BMD devices are well recognized and exist among different central DXA skeletal sites and devices as well.18-22 Thus, even among the three available central DXA devices, the same patient could have differing T scores at the spine depending on the DXA manufacturer.23 There are no published studies that compare the prevalence of low BMD across all of the central and peripheral devices done on the same population. Various studies have compared prevalence differences of peripheral versus central devices but most have only compared one or two specific peripheral devices. All comparisons show differences in prevalence as would be expected with the T scores calculated from individual young normal population databases.18, 24, 25 The prevalence found in this study could not be directly applied to what may be obtained through a central measurement device.
However, comparative risk prediction studies show similar risk prediction between peripheral and central devices.14, 22,26, 27 It is well established that both wrist and heel measurements are powerful predictors of both hip and non-hip fractures.14, 28 Although Miller et al.7 found differences in the prevalence of T scores > −1.0, ≤ −1.0 to −2.49, and ≤ −2.5 among peripheral devices, if the T score was < −1.0, women were at increased risk of fracture, and the magnitude of risks was comparable with those measured by a central device. Despite these site and device differences, it is important to note that low BMD T scores < −1.0 in postmenopausal women assessed by any BMD device, whether central or peripheral, at any site, are associated with an increased fracture risk.14
This study has several limitations. First, women who responded to the follow-up survey may differ from the 18% nonresponders in that women who had fractured may have been more (or less) likely to respond to follow-up than women who did not. In addition, nonresponders were more likely to be older, which may underestimate the fracture rates in the older age group. Second, fracture information was collected by self-report. However, others have found self-report of clinical fractures to be generally reliable.29-31 Because the majority of vertebral fractures are asymptomatic or at least unrecognized, NORA cannot address the value of risk factors or peripheral BMD to predict nonclinical spine fractures. Although it has been suggested that self-report of rib fractures may not be as reliable as other fracture types,30 calculation of RR/SD for overall osteoporotic fractures excluding rib fractures was not different than when rib fractures were included.
In conclusion, BMD testing in younger postmenopausal women 50-64 years of age provides information regarding the 1-year relative risk for fracture similar to that found in women >65 years of age. In both age groups, a peripheral BMD T score ≤ −2.0 was associated with a >2-fold increase in risk for osteoporotic fracture in the year after the measurement compared with women with T score > −1.0. Physicians can be confident that the predictive value of BMD on future fracture risk has a comparable relevance in both younger and older postmenopausal women. This information, coupled with information about other risk factors for fracture, including age, should assist in decision-making regarding the management of postmenopausal women with low bone mass.
Acknowledgements
NORA was funded and managed by Merck & Co., Inc.


