Does calprotectin level identify a subgroup among patients suffering from irritable bowel syndrome? Results of a prospective study
Abstract
Background
Irritable bowel syndrome is a multifactorial disease. Although faecal calprotectin has been shown to be a reliable marker of intestinal inflammation, its role in irritable bowel syndrome remains debated.
Objective
The aims of this prospective study were to select a subgroup of irritable bowel syndrome patients and to characterise those patients with high faecal calprotectin by systematic work-up.
Methods
Calprotectin levels were determined by enzyme-linked immunosorbent assay test in consecutive irritable bowel syndrome patients fulfilling Rome III criteria in whom normal colonoscopy and appropriate tests had excluded organic disease. Calprotectin levels were compared in irritable bowel syndrome patients, healthy controls and patients with active and quiescent Crohn’s disease. When the calprotectin level was higher than 50 µg/g, the absence of ANCA/ASCA antibodies and a normal small bowel examination were required to confirm irritable bowel syndrome diagnosis. Additional explorations included assessment of irritable bowel syndrome severity, anxiety and depression, impact on quality of life, glucose and fructose breath tests, rectal distension test by barostat and quantitative and qualitative assessment of inflammation on colonic biopsies.
Results
Among the 93 irritable bowel syndrome patients (73% women; 66.7% with diarrhoea) recruited, 34 (36.6%) had reproducibly elevated calprotectin. Although they tended to be older than those with normal calprotectin (P = 0.06), there were no other differences between the two groups. When elevated, calprotectin was correlated with age (P = 0.03, r = 0.22).
Conclusions
Elevated faecal calprotectin was observed in one third of patients in this series, without any significant association with a specific clinical phenotype (except age) or specific abnormalities.
Introduction
Irritable bowel syndrome (IBS), according to Rome III criteria,1 is characterised by chronic abdominal pain or discomfort associated with transit disorders (constipation, diarrhoea or both). These chronic symptoms impair patients’ quality of life and lead to a significant burden of the disease, with frequent recourse to health care resources and recurrent periods of absenteeism, both inducing high economic and social costs.
The successful relief of IBS symptoms remains a clinical challenge as existing therapeutic options often yield disappointing results. One explanation is the fact that IBS is a multifactorial disease. In addition to visceral hypersensitivity,2 motor disorders,3 brain–gut axis dysfunction, enhanced intestinal permeability4 and gut dysbiosis,5 stress and psychological disorders may further worsen symptoms.6 Thus, selecting treatments to target pathophysiological abnormalities remains under discussion. Recent pathophysiological studies in a subgroup of IBS patients have highlighted the existence of a low-grade mucosal immune activity in the intestine, particularly when IBS was post-infectious. Such an inflammation provides arguments to consider drugs with intestinal anti-inflammatory properties as a possible therapeutic option. Recent randomised controlled trials have already tested the effect of prednisone and mesalasine in IBS patients but gave disappointing results, partly explained by the fact that only a subgroup of patients could benefit from this type of treatment.7, 8
Calprotectin is a calcium binding protein accounting for 60% of the cytosolic protein content of neutrophils.9 Accumulation of neutrophils at the site of inflammation in the gastrointestinal tract results in the release of calprotectin into faeces where it is stable and resistant to bacterial degradation. The faecal calprotectin rate is correlated with the excretion of indium labelled granulocytes.10 In inflammatory bowel disease (IBD), a clear relationship has been demonstrated between the magnitude of calprotectin elevation and the extent of intestinal inflammation. A meta-analysis of 670 patients has shown that calprotectin had a 93% sensitivity and 96% specificity for the diagnosis of inflammation.11 A faecal calprotectin level of 50 µg/g of faeces, discriminated organic from non-organic intestinal disease with 84.4% sensitivity and 94.5% specificity, in 405 symptomatic patients referred for colonoscopy.12 Screening the calprotectin level is now indicated as a non-invasive test to identify persistent occult inflammation among IBD patients in clinical remission.13 The use of the calprotectin level as a biomarker of intestinal inflammation could represent an interesting targeted therapeutic approach not only to rule out IBD, but also to identify potential IBS candidates for an anti-inflammatory treatment.
The aims of this work were: (a) to assess then compare faecal calprotectin levels in IBS patients, healthy controls and patients with both active and quiescent Crohn’s disease; (b) to identify an association between high calprotectin levels and other pathophysiological abnormalities to determine whether the calprotectin level could be a useful marker for indicating anti-inflammatory treatment in IBS patients; and (c) to compare the characteristics of patients with and without high calprotectin levels.
Materials and methods
Patients
This prospective study recruited new consecutive IBS patients according to the Rome III criteria1 and referred to the gastroenterology department of our tertiary care centre. Clinical examination and standard biological tests including CRP were normal. Total colonoscopy and additional tests when necessary had excluded organic disease.
When the faecal calprotectin level was higher than 50 µg/g, a negative search for ANCA/ASCA antibodies and a normal exploration of the small bowel (by wireless capsule endoscopy, computed tomography enteroclysis or magnetic resonance enterography) were required to confirm IBS diagnosis. Finally, a minimum 1 year clinical follow-up was required to exclude cases of IBD.
We then compared results between the IBS patients, 15 healthy subjects without any digestive symptoms and 35 patients with Crohn’s disease, including 20 with active and 15 with quiescent disease.
Ethics and patients’ consent
The research was performed according to the Declaration of Helsinki. All patients gave their informed consent. The use of informatics data was declared to the CNIL (no. 817.917).
Methods
Clinical assessment
IBS clinical phenotypes were determined by validated self-questionnaires. IBS severity was assessed by the IBS symptom severity score (IBS SSS)14 and transit disorders were characterised using the Bristol stool scale.15 Patients were questioned about a possible history of acute gastroenteritis prior to the onset of IBS suggestive of post-infectious IBS and about a possible worsening of IBS symptoms due to stress. Levels of anxiety and/or depression were assessed using the hospital anxiety and depression scale (HADS).16 The validated gastrointestinal quality of life index (GIQLI) assessed quality of life.17
Colonic biopsies
A left-side colonoscopy, without anaesthesia, was performed for sampling in order to detect inflammatory stigmata. After two enemas performed the day before then the morning of the endoscopic procedure, seven colonic biopsy samples were taken in the descending and sigmoid colons. Samples were analysed by standard histology in the pathology department of our tertiary care centre.18 Intraepithelial lymphocytic infiltrate and colonic sub-epithelial collagen band were systematically assessed in order to eliminate microscopic colitis. Colonic inflammation was assessed both with qualitative and quantitative criteria after having excluded IBD with the ‘PAID’ scheme.19 Inflammation was quantified by our standardised method and scored 0, 1 or 2 for no, moderate, or mild inflammation, respectively. In the presence of inflammation, the cellular infiltrate was then analysed by immunohistochemistry. Monoclonal mouse anti-human CD3 (clone F7.2.38, reference M7254; DAKO, France) and polyclonal rabbit anti-human CD117 (c-kit) (reference A450229; DAKO, France) were used to identify T cells and mast cells, respectively. Then, the extent of T-cell and mast cell infiltrates was quantified (Figure 1 ) using a scale ranging from 0 (rare or absent), to 3 (severe).
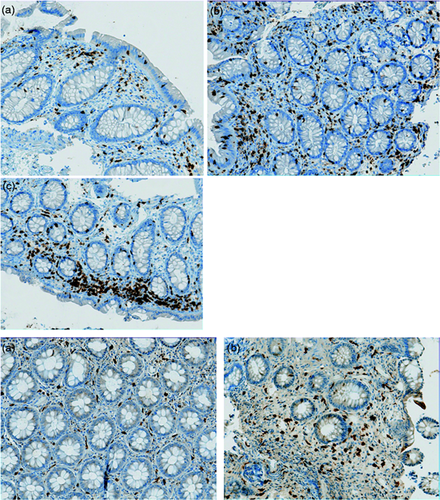
Figure 1: Immunohistochemistry on colonic biopsies. (Magnification X20)
Upper panel: Semi quantitative assessment with CD3 of T Cell infiltrate. A: Moderate, B: Mild and, C: Severe.
Lower panel: Semi quantitative assessment with CD117 of mast cell infiltrate. A: Moderate, B: Mild.
Faecal calprotectin
Faecal calprotectin levels were determined by an enzyme-linked immunosorbent assay (ELISA) test (Bühlmann Labs, Schönenbuch, Switzerland) on 50–100 mg of faeces. Sample collections were stored in plain tubes without chemical or biological additives, between 2℃ and 8℃ up to 6 days. Dosage was realised on 50–150 µL of faeces extract. Calprotectin offers a dynamic range from 10 µg/g to 1800 µg/g. The test allows for the selective measurement of calprotectin antigen by sandwich ELISA. A monoclonal capture antibody highly specific to calprotectin heterodimeric and polymeric complexes, respectively, was coated to the microtitre plate. Calibrators, as well as control and patient extracts, were incubated at room temperature for 30 minutes. After a washing step, a detection antibody conjugated with horseradish peroxidase detected the calprotectin molecules bound to the monoclonal antibody coated on the plate. After incubation and a further washing step, tetramethylbenzidine was added (promoting a blue colour) prior to a stopping reaction (yellow colour). Absorption was measured at 450 nm.
Barostat-assisted distension test for visceral sensitivity assessment
A rectal distension test with an electronic barostat-distender assembly (Distender II; G & J Electronics, Toronto, ON, Canada) was performed to assess visceral sensitivity.20 Distensions were performed automatically from 0 to a maximum pressure limit of 40 mmHg using basic isobaric distensions according to the methods of our department, previously described.21 We chose 40 mmHg as the upper rectal distension limit as a pain threshold above this value has been shown to exclude a diagnosis of IBS in 90% of non-IBS cases.22 Patients were asked to report their painful sensations on a 0–10 visual analogue scale (VAS) during the last 30 seconds of each step. The balloon was progressively distended until pain was reported or the last distending step was reached (40 mmHg). Distensions were stopped when the patient scored a painful sensation of at least 3 on a 10-point VAS.
Breath tests for detection of small intestinal bacterial overgrowth and fructose malabsorption and intolerance
Diet prior to breath tests
A strict diet was followed in the 48 hours prior to the breath tests in order to reduce intestinal gas production that could distort the results of the tests. This diet excluded bread, biscuits, cheese, fruits, vegetables, dairy products, fermented drinks, sodas, honey, marmalade, candy, chocolate, ice cream and pastry. In the evening prior to the tests, dinner was exclusively composed of rice and meat.
Glucose breath test
Both hydrogen (H2 ) and methane (CH4 ) were measured before the glucose load in order to verify compliance with the recommended diet. Then, patients ingested 75 g of glucose dissolved in 250 cc of sterile water. End-alveolar breath samples of expired air were collected every 15 minutes for 2 hours. The test was considered positive if one of the following results occurred: (a) baseline H2 or CH4 levels above 20 ppm despite good compliance with the diet; (b) peak of H2 or CH4 above 20 ppm after glucose intake; (c) increase of H2 or CH4 levels above 10 ppm in two samples by comparison with baseline levels.
Fructose breath test
Previous in vitro and animal studies have suggested that intestinal inflammation may impair sugar absorption. Therefore, we searched for fructose malabsorption, a condition that may promote IBS-like symptoms.23
The fructose breath test was performed in patients with a negative glucose breath test to avoid false positive results.
When the glucose breath test was positive, patients received antibiotic treatment with quinolone or metronidazole for 10 days per month during two successive months. A second glucose breath test was then performed. The fructose breath test was only carried out in patients in whom the control glucose test was negative.
The fructose breath test was performed with the same gas analyser as for the glucose breath test. Patients ingested 25 g of fructose dissolved in 250 cc of sterile water then end-alveolar breath samples were collected every 30 minutes for 5 hours. Both H2 and CH4 levels were calculated. The test was considered positive in the case of a rise in H2 and/or CH4 levels above 20 ppm.24 In, addition, during the whole test, patients were asked about the onset of abdominal pain, bloating and even diarrhoea.
Statistics
The normality of the quantitative variables was assessed using the d’Agostino–Pearson omnibus test. A chi-square test was used for qualitative analyses and Mann–Whitney and t tests were used to analyse quantitative variables with Graphpad Prism 5 software. A P value lower than 0.05 was considered significant.
Spearman non-parametric correlation was used to correlate non-parametric data.
Results
Patients
Ninety-three IBS patients were included. They were 41 ± 13.9 years old, predominantly women (73.1%), with a mean body mass index (BMI) of 24.0 ± 5.4. IBS characteristics are described in Table 1. The mean IBS SSS was 258 ± 111.3, impairing their quality of life (GIQLI score 70.9 ± 19.1). Mean HADS scores for anxiety and depression were 10.3 ± 4.8 and 6.7 ± 4.2, respectively.
| IBS characteristics | n = 93 (%) |
|---|---|
| Subtype | |
| • Diarrhoea | 62 (66.7) |
| • Constipation | 14 (15.0) |
| • Alternating | 16 (17.2) |
| • Undetermined | 1 (1.1) |
| Post-infectious IBS | 25 (26.9) |
| Disease duration (years) | 6.9 ± 7.3 |
| Worsening of symptoms by stressful events | 46 (49.5) |
| Nocturnal pain | 14 (18.3) |
| Breakthrough pain | 8 (8.6) |
- Results are presented as number (percentage) and mean ± standard deviation.
- IBS: irritable bowel syndrome.
Prevalence of IBS with high faecal calprotectin levels
Stool samples were always analysed after less than 72 hours of storage. Mean faecal calprotectin was 90.5 ± 180 µg/g and a subgroup of 34 patients (36.6%) had levels higher than 50 µg/g (Figure 2 ). No patient with abnormal levels had diverticular disease or colorectal adenoma or was taking medications (mainly non-steroidal anti-inflammatory drugs) known to increase the faecal calprotectin level.20 No patient developed IBD during 1 year follow-up.
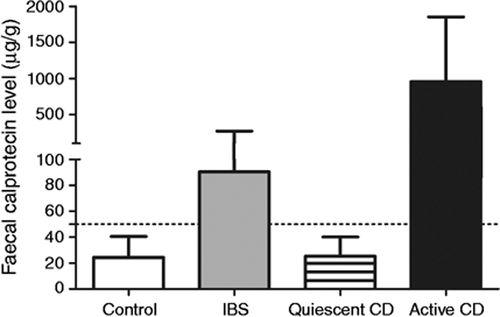
Calprotectin levels according to control subgroup: control, active and quiescent Crohn s disease compared to IBS population.
In the control group without digestive symptoms, the mean faecal calprotectin level was 24.3 ± 16.1 µg/g (P < 0.01). In Crohn’s disease, the mean level was higher for active lesions (958.4 ± 892.4, P < 0.0001) but levels were lower for quiescent disease, compared to IBS patients (25.2 ± 14.8, P < 0.002). The results are presented in Figure 2.
Faecal calprotectin levels according to the IBS subtype are given in Figure 3.
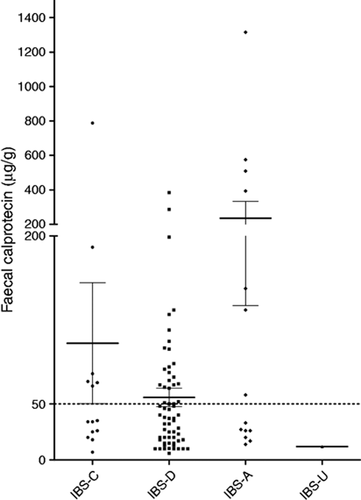
Faecal calprotectin distribution according to IBS subtype.
The figure represents faecal calprotectin distribution according to IBS sub-type. Lines represent mean and error bars standard error of the mean. The dotted line indicates the upper limit of the normal values.
IBS: Irritable Bowel Syndrome. C: Constipation. D: Diarrhoea. A: Alternating. U: Undetermined.
Results of systematic evaluation of patients
In our IBS population, 13.4% and 30.6% of patients tested had abnormal levels on the glucose breath test and the fructose breath test, respectively. Stigmata of qualitative histological colonic inflammation were found in 46.3%. The results of the test evaluation in patients with high and normal calprotectin levels are presented in Figure 4.
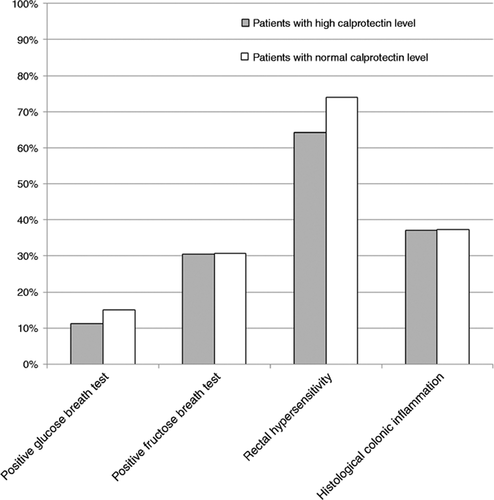
Results of tests in IBS patients with high and normal faecal calprotectin levels.
Results are presented as abnormal in percentage for small intestinal bacterial overgrowth, fructose malabsorption, rectal hypersensitivity and histological inflammation.
Comparison between IBS patients with and without high faecal calprotectin levels
Characteristics of both groups of IBS patients are detailed in Table 2. IBS patients with elevated calprotectin levels tended to be older than those with normal levels (44.2 ± 12.3 years vs. 39.3 ± 14.6, P = 0.06).
| Characteristics | High faecal calprotectin level n = 34 (%) | Normal faecal calprotectin level (n = 59) (%) | P value |
|---|---|---|---|
| Age | 44.2 ± 12.3 | 39.3 ± 14.6 | 0.06 |
| Gender (male/female) | 12 (35.3)/22 (64.7) | 13 (22.0)/46 (78.0) | 0.16 |
| BMI | 23.5 ± 4.6 | 24.2 ± 5.8 | 0.86 |
| Subtype | 0.84 | ||
| • Diarrhoea | 22 (64.7) | 40 (67.8) | |
| • Constipation | 6 (17.6) | 8 (13.6) | |
| • Alternating | 6 (17.6) | 10 (16.9) | |
| • Undetermined | 0 (0.0) | 1 (1.7) | |
| Post-infectious | 9 (26.5) | 16 (27.1) | 0.95 |
| Disease duration (years) | 7.6 ± 8.1 | 6.4 ± 6.7 | 0.46 |
| IBS SSS | 268.9 ± 110.4 | 252.1 ± 113.2 | 0.62 |
| Worsening of symptoms by stressful events | 16 (47.1) | 30 (50.8) | 0.94 |
| Nocturnal pain | 7 (20.6) | 10 (16.9) | 0.66 |
| Breakthrough pain | 3 (8.8) | 5 (8.5) | 1.00 |
| GIQLI score | 73.3 ± 17.4 | 68.9 ± 20.6 | 0.51 |
| HADS score for anxiety | 9.1 ± 5.0 | 11.0 ± 4.6 | 0.17 |
| HADS score for depression | 6.6 ± 4.0 | 6.8 ± 4.3 | 0.82 |
- Results are presented as number (percentage) and mean ± standard deviation.
- IBS: irritable bowel syndrome; BMI: body mass index; GIQLI: gastrointestinal quality of life index; HADS: hospital anxiety and depression scale; IBS SSS: IBS syndrome severity score.
Patients with abnormal calprotectin levels had neither abnormal glucose (P = 0.73), abnormal fructose breath test (P = 0.98), nor rectal hypersensitivity (P = 1.0).
Histological findings
Microscopic colitis was excluded in all biopsies. Histological examination found inflammation in 46% of the patients, with mononuclear infiltrate and mixed infiltrate in 74% and 26% of cases, respectively, but without any difference between patients with or without abnormal calprotectin levels (P = 0.73). Semi-quantitative histological criteria for colonic inflammation were not different in cases of elevated calprotectin levels (P = 0.66).
In the 19 patients with inflammation, the mean density of T cells was 2 ± 0.8 with no difference according to the calprotectin level (P = 0.85). Similar results were obtained for mast cells, with a mean intensity of 1.4 ± 0.6 (P = 0.45). The calprotectin level was not correlated with the extent of T-cell or mast cell infiltrates quantified by immunohistochemistry (r = 0.11 with P = 0.66 and r = 0.07 with P = 0.76, respectively).
Correlation between elevation level of faecal calprotectin and clinical assessment in patients with abnormal levels
In this subgroup of patients, the highest levels were observed in the oldest patients (P = 0.03, r = 0.22). The correlation between a high faecal calprotectin level and other quantitative data are presented in Table 3.
| Faecal calprotectin level (µg/g) | ||
|---|---|---|
| P value | R | |
| BMI | 0.65 | 0.06 |
| Age (years) | 0.03 | 0.22 |
| Disease duration (years) | 0.31 | 0.12 |
| IBS SSS | 0.63 | 0.07 |
| GIQLI score | 0.44 | −0.13 |
| HADS score for anxiety | 0.13 | −0.22 |
| HADS score for depression | 0.98 | −0.00 |
- P < 0.05 is considered significant.
- IBS: irritable bowel syndrome; BMI: body mass index; GIQLI: gastrointestinal quality of life index; HADS: hospital anxiety and depression scale; IBS SSS: IBS syndrome severity score.
Discussion
At variance with previous papers in which the faecal calprotectin level aimed to differentiate IBS from IBD, we quantified calprotectin levels in IBS patients and tried to correlate these levels with histological inflammation to identify a subgroup of IBS patients for whom an anti-inflammatory intestinal treatment could be discussed. In this series of 93 IBS patients mainly with moderate to severe disease (mean IBS SSS: 258 ± 111.3) with a significant negative impact on quality of life (mean GIQLI score 70.9 ± 19.1), 36.6% of patients had an elevated level of faecal calprotectin. This level was higher than the upper limit of the normal values taken into account in most published studies12 and was confirmed in our control group of healthy volunteers. Levels in IBS patients were also higher than those calculated in quiescent IBD. This subgroup of IBS patients with elevated calprotectin tended to be older than patients with normal levels, with a positive correlation between age and abnormal calprotectin levels. In contrast, no significant association was observed between high faecal calprotectin levels and other pathophysiological abnormalities.
The characteristics of our IBS population were comparable with those reported in previous series (predominance of women, median-aged patients) with the exception of over-representation in the IBS with diarrhoea subgroup. The high prevalence (around 25%) of probable post-infectious IBS in this series could contribute to this over-representation. The discomfort related to IBS with diarrhoea, its impact on patients’ quality of life and the difficulties of managing both diarrhoea and pain could be additional explanations for this over-representation in a referral centre.
The determination of the calprotectin level was the milestone of our work. For this, only one sample of faeces was analysed. This can be criticised. However, Tibble et al. have shown in 22 patients a significant correlation between the result of a single stool analysis and the 4-day faecal expression of calprotectin.25 In a recent study in 98 patients with Crohn’s disease in clinical remission, a 3-day determination of faecal calprotectin levels showed low variability across samples allowing clinicians to use a single sample.26 Another possible weakness of our study lies in the lack of confirmation of abnormal calprotectin levels by second sampling in all patients, but this control was obtained and the elevation confirmed in patients with abnormal calprotectin levels closest to the upper limit of the normal range.
One important objective of our work was to demonstrate an association between elevated calprotectin levels and anomalies of other pathophysiological tests. Breath test and rectal distension by barostat are validated tests for the detection of fructose malabsorption and visceral hypersensitivity, respectively, which are prevalent in IBS patients. The choice of a breath test to detect a possible small intestinal bacterial overgrowth (SIBO) could be criticised, even though we selected glucose and not lactulose for this breath test in order to limit the false positive rate related to accelerated transit in the small bowel promoted by the lactulose itself rather than a SIBO.27 In our series, the percentage of patients with a possible SIBO was lower than in other reports.28 One of our pre-study hypotheses was that elevated calprotectin could be explained by SIBO. Indeed, elevated calprotectin levels similar to those obtained in the present study have been reported in systemic sclerosis, a pathological condition in which SIBO is highly prevalent. In a recent study, we were able to show that faecal calprotectin greater than 275 µg/g was predictive of SIBO in a cohort of patients with systemic sclerosis.29 However, in our present cohort of IBS patients, we were unable to demonstrate such a link between SIBO and elevated calprotectin, as SIBO and high calprotectin levels were only associated in three patients. This result is in accordance with Gasbarrini’s findings, both in adults30 and children, suggesting that SIBO is not associated with intestinal subclinical inflammatory changes mainly involving the neutrophils. We also speculated that elevated calprotectin would be found more frequently in hypersensitive patients, due to the role of inflammation on enteric sensitive neurons. We were unable to confirm this hypothesis.
The last point is that colonic biopsies did not allow an explanation of abnormal levels. Such a paradoxical result highlights some additional weaknesses of this study: (a) colonic biopsies were performed in only 80% of patients, as some patients refused a new examination after a previous one that had diagnosed IBS; (b) biopsy samples were taken only in the left colon and we cannot conclude as to possible inflammation in the right colon or even in the small bowel despite normal imaging; and (c) biopsy samples were taken routinely, mainly involving the mucosa, but deeper biopsies are needed to study mast cells.31 Neither the quantification of standard inflammation nor the qualitative evaluation of mast cells and T cells by immunohistochemistry were able to explain the elevated levels of calprotectin found in a subgroup of patients. Unfortunately, we were unable to measure the production of inflammatory cytokines. Therefore, the reason for elevated calprotectin levels in more than one-third of our IBS patients, including 17% with levels higher than 100 µg/g, remains unclear. One explanation could be increased intestinal permeability. The positive correlation between calprotectin and age is an indirect argument for such a hypothesis.32 In addition, a recent study has demonstrated that in quiescent IBD, IBS-like symptoms related to persistent subclinical inflammation were associated with increased colonic paracellular permeability and could be related to tumour necrosis factor alpha, which was significantly increased in quiescent IBD with IBS-like symptoms in this study.33 However, intestinal permeability was not studied in our series due to the lack of a simple and validated test.34 As it is well established that foods, particularly FODMAPs and wheat proteins, can play a central role in triggering inflammation in IBS, it would be interesting to verify whether the raised level of faecal calprotectin can be reverted to normal by dietary interventions such as low FODMAPs and/or gluten-free diet.35
In conclusion, we confirmed our hypothesis that faecal calprotectin was abnormally high in a subgroup of our IBS patients. However, we were unable to explain this high level with quantitative and qualitative analysis of colonic inflammation. Therefore, according to the results of our study, a high faecal calprotectin level cannot be the sole selection criteria to indicate an anti-inflammatory treatment in this subgroup of IBS patients. Further studies are needed to understand this elevation better.
Acknowledgements
The authors are grateful to Elodie Colasse (Pathology Department, Rouen University Hospital) for technical assistance. The authors are indebted to Nikki Sabourin-Gibbs (Rouen University Hospital) for her help in editing the manuscript.
Declaration of conflicting interests
The authors declared no potential conflicts of interest with respect to the research, authorship, and/or publication of this article.
Funding
The immunohistochemistry analysis in this work was supported by a FARE grant provided by the French Gastroenterological Society.


