Progressive Collapse of Steel Structures Under Blast Loads Considering Soil-Structure Interaction
Abstract
This study focuses on the effect of soil-structure interaction on the occurrence of progressive collapse due to an external blast. Therefore, a 3-story fixed base steel moment-resisting frame structure was first modeled and subjected to an external blast load. Then, the same structure was modeled considering soil-structure interaction. In another stage of this study, the effect of plan irregularity on progressive failure resulting from the explosion was investigated, assuming the presence or absence of soil-structure interaction. The direct simulation method and alternative load path method are all employed to simulate the progressive collapse process of steel frames using the commercial finite element program LS-DYNA. The results of the numerical simulations demonstrated that the presence of soil-structure interaction, significantly influences the response of the structure to the blast and this interaction increases the likelihood of progressive failure occurring even at symmetric and asymmetric structures. It was also shown that silty sand soil yields more critical conditions than other types of soil in the event of failure after the occurrence of an explosion in the structure.
1. Introduction
Structures may be exposed to natural disasters, such as earthquakes, storms, floodwaters, fires, and man-made extreme hazardous events, including blasts and clashes, during their operational lifespan. Conventionally, structures are designed to withstand potential incidents that may occur throughout their lifetime. Nevertheless, severe events such as extreme changes in air pressure (blasts) or accidental collisions (vehicles or airplanes impacting buildings) that are not considered in the design of a structure may lead to catastrophic failures such as progressive collapse [1, 2].
The term “progressive collapse” is used in structural engineering to describe the spread of an initial local failure, similar to a chain reaction, that ultimately leads to the partial or total collapse of a building. The defining characteristic of progressive collapse is that the final failure is significantly larger than the initial local failure [3]. In other words, progressive collapse begins with the removal of the local carrying loads of one or more load elements in the structure and then continues with the occurrence of additional failures in other elements of the structure that are not directly influenced by the primary local failure [4–6].
The occurrence of progressive collapse in structural engineering and the development of suitable methods to prevent this phenomenon have been the focus of research for several decades. Progressive collapse gained significant attention after the collapse of the Ronan Point Apartment Tower in London in 1968. This event marked the emergence of progressive collapse as a new problem in engineering [7, 8]. There are other well-known incidents related to progressive collapse: the bombing of the Alfred P. Murrah Federal Building, which resulted in the deaths of 168 people and the complete destruction of the building [9]. The 2001 aircraft impact on the World Trade Center (WTC) towers, causing irreparable damage and the total collapse of both high-rise towers, is a notable incident of progressive collapse [10]. The fire in the Windsor Tower that started on the 21st floor of the tower and spread from the 11th to the 28th floor and burning for 20 h, led to a progressive collapse of part of the structure [11]. Similarly, a fire caused the complete destruction of the Plasco Building in 2017, a commercial structure, which collapsed progressively after burning for 3.5 h [12].
Following the WTC event, there has been a remarkable increase in studies on progressive collapse. The findings of these studies have been reflected in new guidelines, such as those issued by the US General Services Administration [13] in 2003 and the Department of Defense in 2005 [14]. These authorities have presented several methods to address progressive collapse, including the alternate load path analysis [15, 16] method and the enhanced local resistance (ELR) method, and many studies have been conducted to use these appropriate methods to deal with the phenomenon of progressive collapse [17–22].
After identifying the primary methods for preventing progressive deterioration, the important and fundamental concepts of civil engineering science were integrated with the subject of progressive collapse, subsequently becoming the focus of articles worldwide. The effect of blast on structures has been one of the basic topics that have always been discussed in all engineering sciences and in recent times. Blasts have become a common threat to specific structures and the frequency of these incidents is rapidly increasing. Detonation can cause the collapse of a part or even the entire structure. Studies have shown significant variations in blast loads due to factors such as detonation point, charge shape, explosive material, temperature, and pressure [23, 24]. McConnell and Brown discussed the modeling of blast load effects on steel structures that lead to progressive collapse. They incorporated equations for different conditions, including columns with varying sections, lengths, and explosion charges [25].
In recent years, there has been a growing emphasis on studying the impact of blast on high-rise structures. Sideri et al. conducted a finite element analysis on two steel moment-resisting frame systems and a steel frame with a reinforced concrete rigid core to examine the effects of blasts [26]. Their research revealed that moment-resisting frame systems significantly enhance the structural resilience against blast events.
Ding, Song, and Zhu [27] investigated the probability of progressive collapse in steel frame structures due to terrorist attacks involving vehicle-borne improvised explosive devices. The results of this study demonstrate that the reliability assessment framework provides an accurate prediction of the failure risk of structures against blast loads compared with the direct Monte Carlo simulation method. On the other hand, the dynamic response of a structure depends on numerous characteristics of its surrounding soil, and the effect of these characteristics on the behavior of the structure has been a constant study of researchers [28, 29]. The dynamic response of a structure relies on the ground movement and the soil environment surrounding the foundation. This phenomenon is known as soil-structure interaction. Therefore, considering the effects of soil-structure interaction can fundamentally alter the dynamic response of a structure compared with a similar structure not taking this effect into account [30–32].
The effects of blasts on structures vary, depending on their altitude position. Several studies have examined the effect of surface blasts on ground structures, assuming the existence of soil-structure interaction [33]. The impact of surface detonations on buried structures, assuming soil-structure interaction, is currently a prominent topic in the field. Notable research in this area includes the work of Ma et al. [34]. In addition, studies have been conducted on the effects of underground detonations on structures, with these investigations reaching conclusions based on the assumption of soil-structure interaction [35, 36].
Buildings may have different geometrical configurations, such as irregularities in plan and height. These factors play a crucial role in the performance of structures. Although an irregular structure may be designed in accordance with regulations, it may exhibit different behavior compared with regular structures under natural events or human-made incidents like explosions. Therefore, the investigation of these structures behaviors has been a subject of interest for researchers these years [37, 38].
The studies mentioned above have highlighted the significance of understanding the progressive collapse phenomenon in order to mitigate risks and hazards. Numerous research projects have been conducted to investigate the impact of soil-structure interaction on the seismic response of structures, as well as the effects of blasts on structures. However, the evaluation of progressive collapse in steel structures under blasts, while considering the interaction between soil and structure, is a novel and intricate issue. In this particular study, the LS-DYNA software was utilized to model the effects of a blast on asymmetric and symmetric steel moment-resisting frame structure, both with and without soil-structure interaction, and a 3-story steel frame, with the direct simulation method and alternative load path method used as examples to simulate this procedure. Then, three different types of soil were used for the substructure to investigate the effect of the soil type on the occurrence of progressive failure after the blast.
2. Finite Element Model of Steel Frames
In this research, the structures are assumed with two types of connection to the ground. A structure with a completely rigid connection to the ground, named model without SSI, and a structure that is placed on a type of soil and the interaction between the soil and the structure is effective in the behavior of these structures that is called model with SSI. Both of the structures, soil, and interaction between them have been modeled in LS-DYNA software.
2.1. Structure Modeling
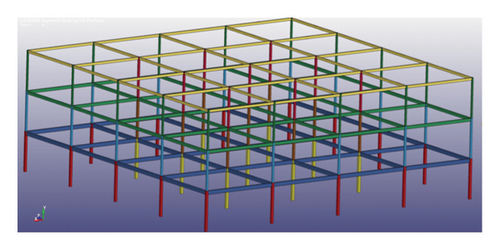
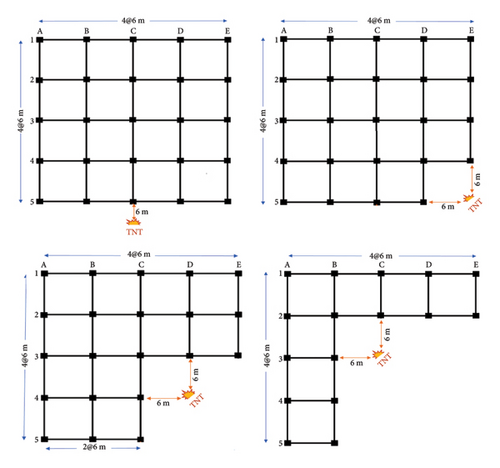
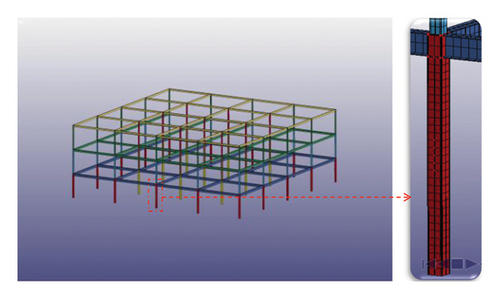
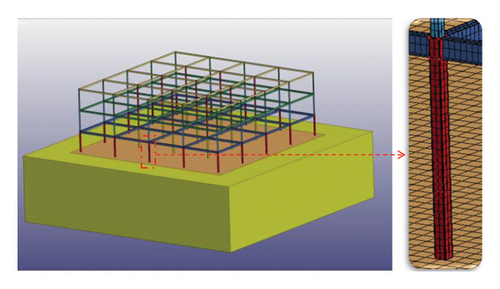
The buildings considered in this study are seismically designed symmetric and asymmetric steel frames with three stories. Each story has a height of 3.2 m and there are four bays in each direction, with a span length of 6 m. Figure 1 shows an aerial view of the symmetric steel frame. The standard floor plans of symmetric and asymmetric steel frames are presented in Figure 2. It is evident from this figure that three distinct levels of irregularity have been incorporated into the structural plan to assess the impact of different plan types on analysis. By systematically removing one, two, and three spans, irregularities of 25%, 50%, and 75% are introduced into the structural plan, respectively. Subsequently, all of these structures with varying plans were subjected to an external blast, the precise locations of which are delineated in Figure 2.
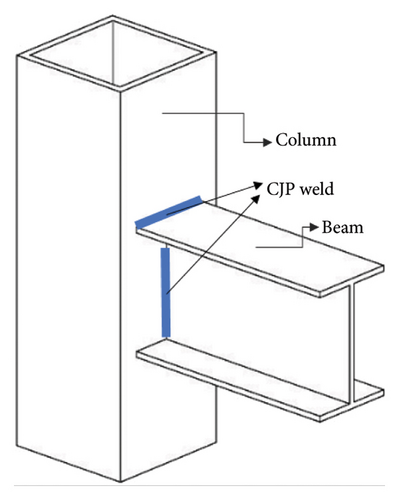
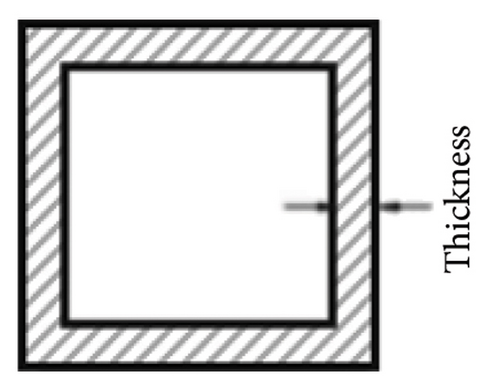
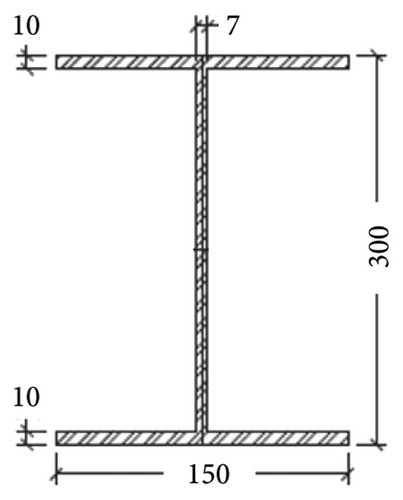
The numerical modeling in this study uses moment-resisting connections with fully welded connections, as shown in Figure 3. In addition, the effect of the secondary beam as a lateral constraint for the frame beams is taken into consideration. The columns of the steel frame utilize box sections, while the beams are made from the I section. These beams are joined together through the use of three steel plates. For instance, the I300 section has dimensions of 300 × 150 × 7 × 10 (I300-section depth × 150-flange width × 7-web thickness × 10-flange thickness). In the case of box sections, the first and second numbers indicate the section width, while the third number represents the section thickness (Figure 3).
The steel sections used in the structure (Table 1) and the rebar used in the foundation of the structure are St 37 and AIII and the basic parameters of the steel and concrete materials are shown in Tables 2 and 3. In Table 2, fc is the compressive strength of concrete, E is the elastic modulus, and ν is Poisson’s ratio, and in Table 3, fy is the yield strength of steel, E is the elastic modulus; EP is the tangent modulus, ν is Poisson’s ratio, ρs is the mass density, εf is the failure strain, C and P are Cowper and Symonds model parameters’ ratios, ρ is the mass density, and d is the maximum aggregate size.
| Section/story | Exterior columns | Internal columns | Exterior beams | Internal beams |
|---|---|---|---|---|
| Story 1 | BOX 18 × 18 × 1 | BOX 20 × 20 × 1.2 | I 300 | I 300 |
| Story 2 | BOX 12 × 12 × 1 | BOX 16 × 16 × 1 | I 240 | I 240 |
| Story 3 | BOX 10 × 10 × 1 | BOX 14 × 14 × 1 | I 180 | I 200 |
| fc (Mpa) | E (N/m2) | ν | ρ (kg/m3) | D (mm) |
|---|---|---|---|---|
| 30 | 3 × 10¹⁰ | 0.2 | 2500 | 19 |
| fy (MPa) | E (N/m2) | EP (N/m2) | ν (kg/m3) | ρs (kg/m3) | εf | C | P |
|---|---|---|---|---|---|---|---|
| 300 | 2 × 10¹¹ | E/1000 | 0.3 | 7830 | 0.1 | 40 | 5 |
The material model of ∗Plastic_Kinematic ( ∗Mat_003) is used for the steel, which is appropriated to model isotropic, kinematic, or a combination of both hardening plasticity with the option of including rate effects [39].
The material model of ∗Johnson_Holmquist_Concrete ( ∗Mat_111) is used for the concrete; this model can be used for concrete subjected to large strains, high strain rates, and high pressures. The pressure is expressed as a function of the volumetric strain and includes the effect of permanent crushing. The damage is accumulated as a function of the plastic volumetric strain, equivalent plastic strain, and pressure [39].
2.2. Substructure Modeling
The effect of soil and structure interaction was investigated on the progressive collapse of a steel structure following the external detonation. A well-graded gravel (GW) soil type was selected for the substructure. This type of soil contains a wide range of grain sizes, which allows the smaller particles to fill the voids between the larger particles. Well-graded soils typically exhibit better compaction, higher shear strength, and lower permeability compare with poorly graded soils [40]. The characteristics of the substructure soils are mentioned in Table 4.
| Soil type | Dry density (kg/m3) | Bulk modulus (MPa) | Shear modulus (MPa) | Friction angle (degree) | Cohesion (Pa) | Tensile strength (Pa) | [41] Soil classification |
|---|---|---|---|---|---|---|---|
| GW | 1700 | 78.43 | 53.20 | 38 | 0 | 0 | D |
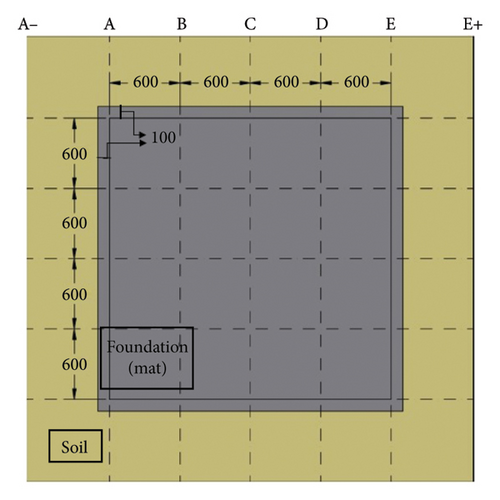
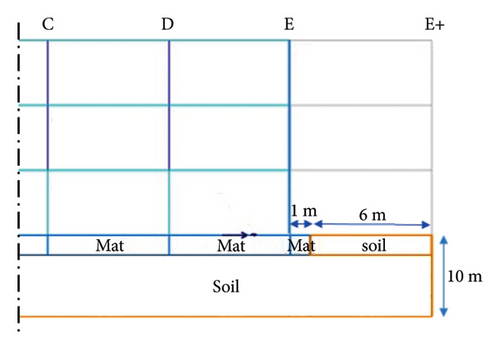
One of the software’s definitions is the contact surface between the foundation concrete and the surrounding soil, which is referred to soil-foundation interfacial parameters including addition and roughness. To address this, a frictional contact surface was defined with specific specifications, and the keyword ∗CONTACT_AUTOMATIC_SURFACE_TO_SURFACE was employed.
In terms of modeling the detonation, an air blast was adopted using a certain quantity of hemispherical explosive charge, such as TNT. For the structure, a 500 kg TNT explosive charge weight located about 6 m from the external side of the structure, 1 m above the ground, and in front of column C5 (Figure 3) was considered. The ∗LOAD_BLAST_ENHANCED method was used to model this detonation in the software.
3. Verification
To validate the methods and finite element models employed in this study, a well-known and reputable experimental research [42] from the past was selected. For the simulation of this model, LS-DYNA software was utilized, which closely resembles the approach previously undertaken by Jayasinghe et al. [43]. The aim of this analysis is to investigate the response of a pile foundation to explosion in saturated soil through nonlinear finite element analysis considering soil behavior and soil–pile interaction. This study presents a computational and software-based approach to previous experimental research.
This experimental research with Shim [42] performed a series of centrifuge tests using 70-g samples to examine the propagation of blast waves and the response of embedded piles in saturated sand. The propagation of stress in both the pile and the soil was also investigated. Based on the findings from these two studies, it can be concluded that the middle section of the pile is susceptible to damage, and the pile’s response is directly influenced by its distance from the explosive material.
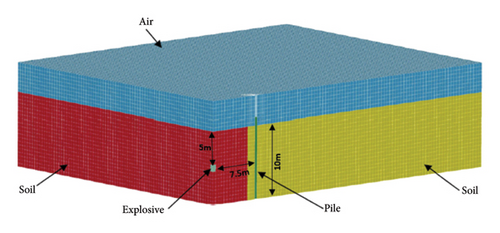
A quarter of the air domain, soil domain, and explosive and half of the pile were modeled as shown in Figure 5 that shows the five different parts. Thus, the soil is modeled with both Eulerian and Lagrangian meshes. The materials of the explosive, air, and near-field soil are specified as multimaterial using LS-DYNA multimaterial capabilities. The JWL (Jones–WilkinLee) equation of state (EOS) was used with the high explosive material model to model the H6 explosive. The ∗MAT_FHWA_SOIL material model was found most appropriate to model the fully saturated sand in LS-DYNA, and this material includes strain softening, kinematic hardening, strain rate effects, element deletion, and most importantly, effect of excess pore water, which was necessary since saturated sand was considered in this study.
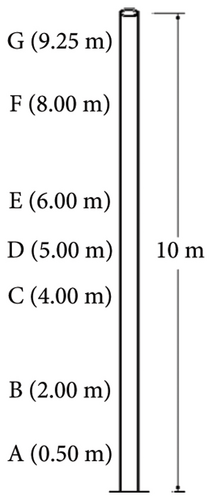
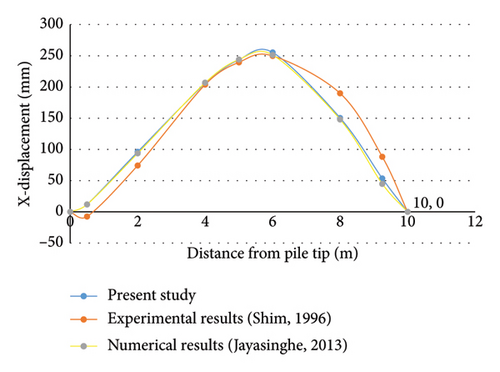
In order to validate the results of the analysis and compare with the mentioned previous research, the displacement of 7 points of the pile was taken. Figure 6 is the comparison of residual horizontal deformations of the pile along its height obtained from the present analysis and the corresponding prototype values from the experimental results of Shim [42] and numerical results of Jayasinghe et al. [43]. The proximity of all curves indicates a reliable correlation between the present numerical results and the two other studies reviewed.
4. Numerical Results
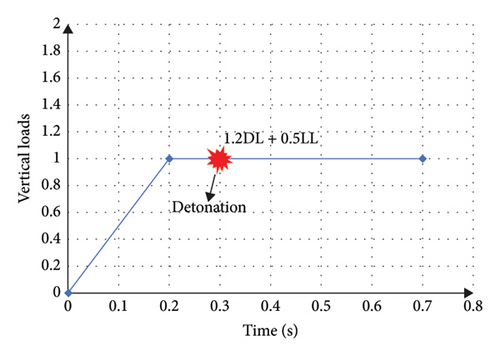
The process of modeling including detonation progress, shockwave propagation process, the interaction between soil and structures, dynamic response and damage of the structural members under blast load, and the progressive collapse process of the building structures is simulated by LS-DYNA software. The combination of dead load and live load is applied to structures according to UFC guidelines. This combination intermittently increases up to 0.2 s and then remains constant for 0.1 s. Subsequently, the assumed detonation occurs and continues for 0.4 s. The mentioned load combination remains constant to enable direct control over the results of the blast and progressive failure in the structure. The loading method mentioned is depicted in Figure 7.
A blast is defined as the sudden and rapid release of a large amount of energy, resulting in the production of light, heat, sound, and waves that propagate at a speed close to the speed of sound. The waves generated by a blast can be classified into two types: shock waves and pressure waves, depending on the source of the detonation. Shock waves are produced by the detonation of solid explosives, wherein the gases formed by the explosion rapidly expand and increase in pressure to reach the maximum positive pressure (referred to as PSO), before subsequently decreasing back to ambient pressure [44].
One of the challenges in this research was selecting the appropriate amount of explosive material. This was done to ensure that a significant number of load-bearing elements in the structure would not be damaged by the explosion. In addition, it was important to prevent the main elements of the structure from failing in a way that would gradually lead to the effect of gravity loads over time, resulting in progressive failure.
To investigate the effect of soil and structure interaction on the progressive collapse of a steel frame under a blast load, the direct simulation method and alternative load path method are employed for the progressive collapse analyses. The detonation was conducted once in front of the assumed structure, assuming SSI, and once without assuming SSI, and the results were compared. Depending on the distance between the blast and the structure, the waves caused by the blast reached the structure within 2 milliseconds after the detonation, and the effects of the detonation became apparent from that point onwards. The LS-DYNA software has the capability to display the elements and points of the structure that were removed at each time step of the analysis. It is important to note that the criteria for element removal in the advanced analysis were based on the strain value.
Figure 8 depicts the elements and points that were removed from two structures at 0.32 s of analysis, specifically 20 milliseconds after the detonation. The left-sided figures present a three-dimensional overview of the structures, while the magnified figures on the right enable a more detailed examination of the damaged area. When the blast occurs, the closest members of the structure to the blast, such as column C5,1 (c5 in the first story), are initially damaged. Most of the elements removed from this column are located in the middle of its height due to significant buckling. Subsequently, damage and removal of elements are observed in the connection areas between the beam and the column. The majority of these removed elements are found in the connection between column C5,1 and the beams of the first floor, which can be attributed to its closer proximity to the blast compared to other structural connections. By comparing the results of the two structures at 0.32 s from the analysis, it can be concluded that the model with SSI has a greater number of removed elements than the model without SSI. The enlarged figure provides greater precision, revealing that in the model with SSI, more than 20 points and 8 elements have been removed from the C5 column. In contrast, for the model without SSI, 10 points and 5 elements have been removed from that column. This conclusion is evident in both the removed elements in the middle of column C5,1 and the connections between the beam and column of the structure. Another noteworthy result in this step of analysis is that the removal of elements from frame 4, i.e., the second frame of the structure, is only observed in the model with SSI and not in the model without SSI.
To investigate the removed elements and structural behavior, two different time steps have been compared: a 0.5-s time step in the analysis and a 0.7-s time step in the analysis, which is the final moment of this process. In both of these time steps, after the passage of the shock wave from the structure, the results have been similar, and the model, despite the soil-structure interaction, has a more critical condition compared to the model without soil-structure interaction. This is evident from the higher number of removed elements in the model with SSI compared with the model without SSI (Figure 9).
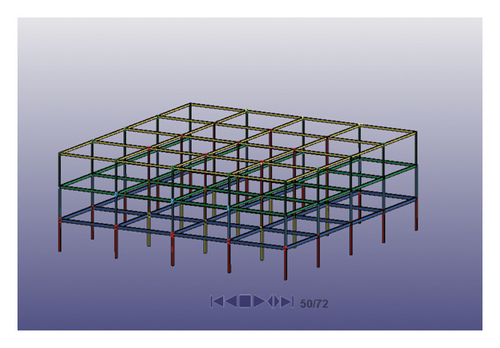
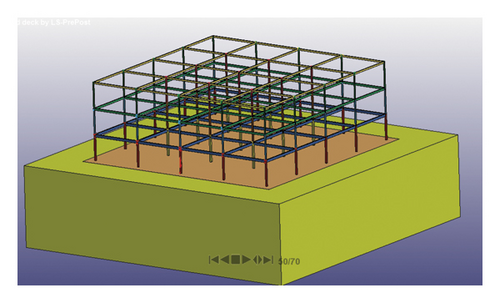
In the analysis, when the wave generated by the shock wave has traversed all the frames of the structure at a time step of 0.5 s, it is evident from Figure 9 that the model with SSI exhibits a greater number of points and elements removed compared with the model without SSI.
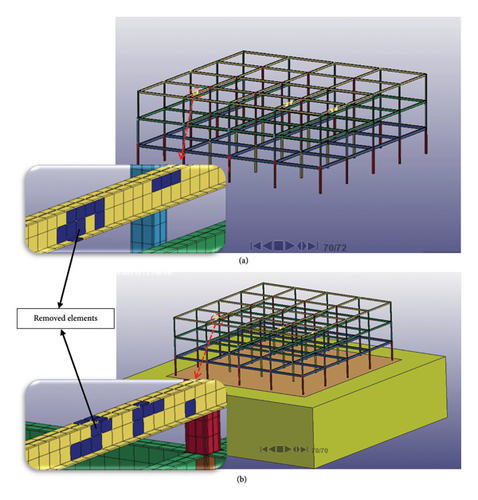
The investigation into the structural damage caused by the blast and the resulting removal of elements reveals that the most severe damage occurs in the member closest to the detonation. Specifically, in column c5,1, a significant number of elements, particularly in the middle height, are removed. This suggests that this column is damaged at the onset of the blast wave’s impact on the structure, and progressive damage may initiate from this point. Furthermore, it can be observed that this column is damaged right at the beginning of the blast wave’s impact on the structure, and progressive damage will commence within the structure. In addition, when the blast shock propagates through the structure, it is the gravity loads that contribute to the spread of damage throughout the structure. Figure 10 illustrates that, at later times, the connecting beams of frames 3 and 4 on the third floor of the structure exhibit significant buckling, with a considerable number of elements in these members being removed (as indicated by the blue color in the figure). Similar to previous findings, the number of removed elements in the model with soil-structure interaction exceeds that of the model without soil-structure interaction.
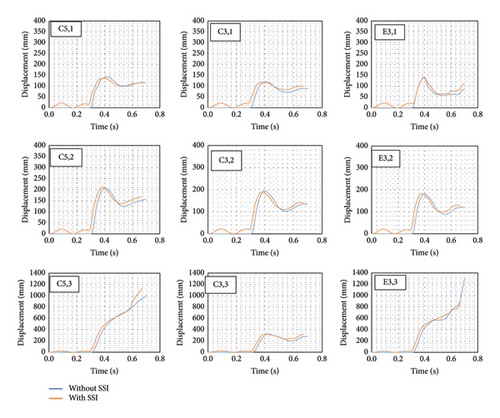
Investigating the displacement of different points from the two structures can also report the comparative behavior of the two models. Therefore, this issue has been investigated in sensitive points of the structure, such as the connection points of columns and beams, in points and floors. Point E5,1 is a point of the column in line E with axis number 5 (Figure 3) and near the connection of the beam to the column at the level of the first floor. Figures 11, 12, and 13 also show the amount of total displacement at different stories for assumed points with respect to time.
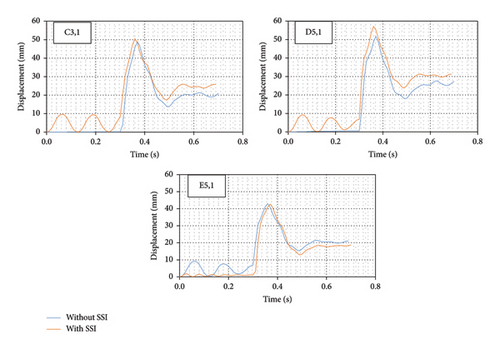
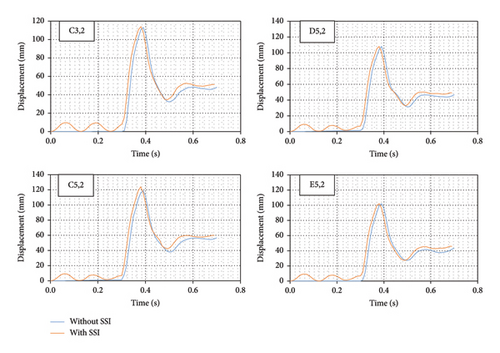
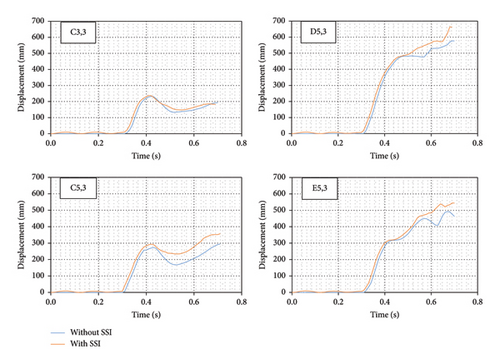
The displacement-time diagrams clearly indicate the result of vertical and horizontal displacement for the selected points. It is obvious from these diagrams that the displacement of points in the model with SSI shows a periodic behavior before the time of 0.3 s of analysis when only gravity loads are available. This observation arises from the fact that soil behaves as a flexible material.
The progressive collapse begins when the waves generated by the explosion propagate through the structure. At this time, gravity loads have a greater impact on progressive failure and the alternative load path method is a way to deal with this procedure. The graphs clearly demonstrate that the interaction between the soil and the structure significantly influences the results over time and this effect is greater when the blast waves have passed through the structure; for example, the displacement of column C3 on the first floor increased by 23% in structure with SSI and during the postexplosion failure period. Moreover, as the elevation level of stories increases, the total displacements of selected points also increase. In addition, the displacement for most of the selected points from the third floor until the end of the analysis time is increasing and this event suggests potential damage to the columns on this floor; for instance, the displacement of column D5 on the second floor and column C5 on the third floor in the structure increased by 15% and 20%, respectively, with the soil-structure interaction during the analysis time.
It is evident that in all assumed points, the model with SSI has a more critical behavior, and the displacement of assumed points during the analysis time is greater in the model with SSI compared with the model without SSI. The position of the assumed point in the plan also significantly affects the impact of soil-structure interaction on the difference in displacement of the assumed point. Table 5 shows the maximum difference in displacement after the detonation for different floors and assumed points of the two models. The percentage of changes in displacement means the ratio of the maximum difference in displacement to the displacement of the structure without SSI at the assumed point and selected moment of the analysis and these percentages in Table 5 also show that the presence of soil and structure interaction in the analyzed models will have a significant impact on the results.
| Story | Point | ||||
|---|---|---|---|---|---|
| E5 | D5 | C5 | C3 | ||
| Story 1 | Displacement of model without SSI (mm) | 16.3 | 48.8 | — | 19.8 |
| Displacement of model with SSI (mm) | 19.8 | 57.1 | — | 24.3 | |
| Maximum difference in displacement (mm) | 3.5 | 8.3 | — | 4.5 | |
| Percentage of differences in displacements (%) | 21 | 17 | — | 23 | |
| Story 2 | Displacement of model without SSI (mm) | 37.7 | 47.5 | 54.2 | 45.3 |
| Displacement of model with SSI (mm) | 43.0 | 54.6 | 59.8 | 52.0 | |
| Maximum difference in displacement (mm) | 5.3 | 7.1 | 5.6 | 6.7 | |
| Percentage of differences in displacements (%) | 14 | 15 | 10 | 14 | |
| Story 3 | Displacement of model without SSI (mm) | 409 | 577 | 239 | 135 |
| Displacement of model with SSI (mm) | 455 | 663 | 288 | 149 | |
| Maximum difference in displacement (mm) | 44 | 86 | 51 | 14 | |
| Percentage of differences in displacements (%) | 10 | 14 | 20 | 10 | |
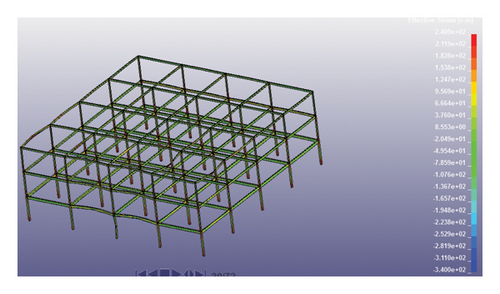
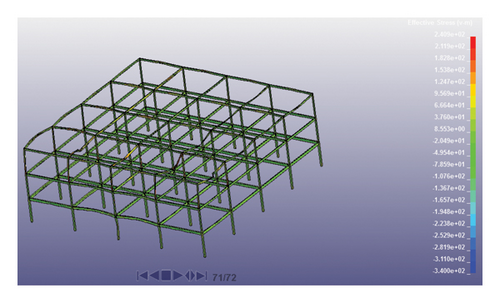
Investigating stress changes in structures has always been a good way to compare their behavior. Therefore, to utilize this fact, changes in the Von Mises stress were extracted from the software for both models. Figure 14 illustrates the variations in Von Mises stress at different times of the analysis. The time step (0.32) is the moment that the blast wave hits the structure, and stresses increase near the structure where they exceed the assumed allowable stress values of the steel sections for certain parts of the structure. Until 0.40 s of the analysis time, the blast wave has propagated to the end span of the structure in (X direction) and the stress increases inside the members, especially in their connections. At the final moments of the analysis, by the removal of the load-bearing element (C5,1 column) and the impact of gravity loads on the structure, the stresses in the middle of the beams at the third floor of the structure have reached their final state and progressive collapse is occurring in the structure.
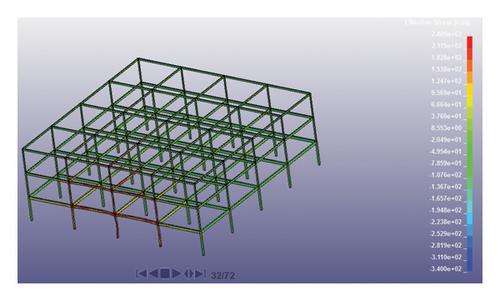
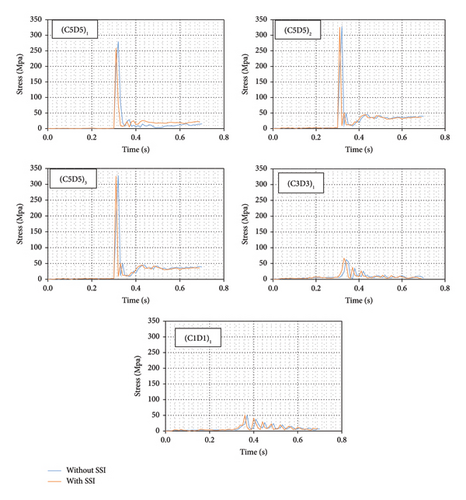
The Von Mises stress was compared for the midspans and webs of the five different beams. (C5D5)1 introduces the beam located on the first floor of the structure, between vertical axes C and D, and also horizontal axes 5 and 6. This comparison was done at three different levels of the structure (Figure 15). The analysis of the structure revealed that accounting the interaction between the soil and the structure had less impact on the Von Mises stresses in the beams of both models. The statistical results of the analysis show that the Von Mises stress in the midspan beam (C5D5)1, which is also the closest beam to blast, is approximately 10% higher in the structure with SSI than in the structure without SSI, and in the remaining beams, the difference in Von Mises stress between the two structures is negligible.
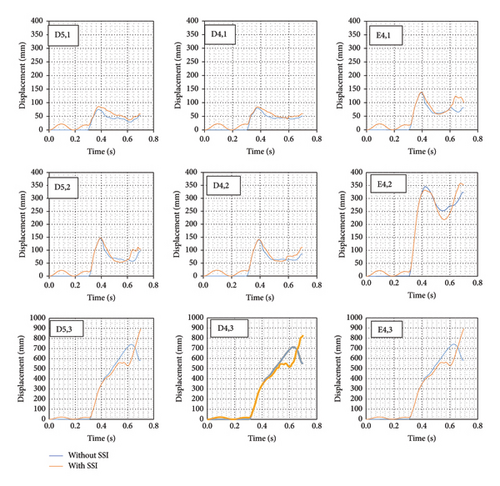
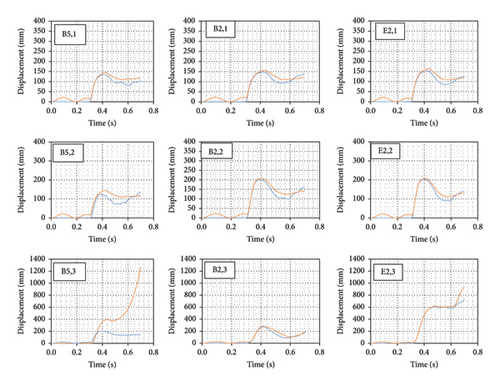
One of the other objectives of this research is to investigate the effect of irregularity in the plan on the occurrence of progressive collapse resulting from an external blast, assuming the presence or absence of soil-structure interaction. To examine this issue, the location of the explosion was changed and placed in a more critical position of the structure with an irregular plan, as shown in Figure 2. Figures 16, 17, and 18 illustrate displacements over time at various points of structures with different floor plans. In these figures, it is evident that structures with asymmetric plans indicate different behavior in response to external blasts; such that in the final seconds of the analyses, the displacement of hypothetical points increases, which can be inferred as a result of changes in the structural stiffness. Considering the explosion location in structures with asymmetric plans, the behavior of the structure and the displacement of points have been more irregular compared with symmetric plans, but it is obvious that in structures with SSI and any level of irregularity in the plan, resistance to collapse resulting from explosion decreases, in a way that the displacement of nodes at hypothetical points increases by 10%–30% compared with structures without SSI; this means that the structure with the highest level of irregularity, structure with SSI shows nearly 30% more displacement in the analyses than the structure without SSI. One of the other important conclusions drawn from the figures is that columns in the third floor of structures with varying irregularities and soil-structure interaction have become unstable after the explosion, while the same columns in structures without soil-structure interaction remain stable. This phenomenon can be observed in Figures 16 and 18, at the nodes above the columns on the third floor.
5. Parametric Study of Soil-Type Conditions
| Soil type | Dry density (kg/m3) | Bulk modulus (MPa) | Shear modulus (MPa) | Friction angle (degree) | Cohesion (Pa) | Tensile strength (Pa) | [41] Soil classification |
|---|---|---|---|---|---|---|---|
| Rock | 2700 | 555.50 | 416.6 | 33 | 10,000 | 1000 | B |
| SM | 1980 | 30.30 | 25.60 | 32 | 0.0 | 0.0 | E |
| GW | 1700 | 78.43 | 53.20 | 38 | 0 | 0 | D |
| Story | Soil type | |||
|---|---|---|---|---|
| Rock | GW | SM | ||
| Story 1 | Displacement of model with the rigid base (mm) | 16.4 | 16.3 | 16.3 |
| Displacement of model with the soil type (mm) | 18.4 | 20.0 | 21.9 | |
| Maximum difference in displacement (mm) | 2.0 | 3.7 | 5.3 | |
| Percentage of differences in displacements (%) | 12 | 22 | 32 | |
| Story 2 | Displacement of model with the rigid base (mm) | 38.2 | 37.4 | 27.3 |
| Displacement of model with the soil type (mm) | 41.9 | 46.1 | 34.1 | |
| Maximum difference in displacement (mm) | 3.7 | 10.7 | 7.1 | |
| Percentage of differences in displacements (%) | 09 | 28 | 25 | |
| Story 3 | Displacement of model with the rigid base (mm) | 409 | 409 | 597 |
| Displacement of model with the soil type (mm) | 444 | 526 | 479 | |
| Maximum difference in displacement (mm) | 35 | 117 | 120 | |
| Percentage of differences in displacements (%) | 09 | 28 | 29 | |
Shear wave velocity (Vs) of soils is a small-strain parameter that is widely used to evaluate the dynamic response of soils and calculated by equation (9) [45], where ρ is the mass density and G is the shear modulus of soil.
It is evident that the alteration of the substructure’s soil type in the model has led to a modification in the analysis results. The structure built on SM soil, classified as group E according to NEHRP classification, exhibits a more severe vulnerability to progressive damage caused by explosions compared to the other two soil types (Figure 19). Table 7 shows the maximum displacement difference (mm) of structure at E5 situation on different soil types with a rigid base model. It is obvious that the soil type of the substructure has a vivid impact on the analysis of the difference in displacement.

Figure 19 illustrates that the behavior of the structure on the rock soil layer is very similar to the structure with soil and structure interaction, but the structure on the SM soil layer shows up to 32% more displacement than the structure with SSI. This difference in displacement is also present for the structure on GW soil layer, but its amount is smaller and reaches about 28%.
6. Practical Implications and Limitations
Modeling explosion phenomena in a realistic and direct method is a complex and time-consuming process. This complexity has led to the majority of previous studies and models relying on simplified software to apply calculated blast forces to hypothetical structures, with results subsequently analyzed. However, this research employed direct method for modeling of the explosion behavior, the structure, and the soil by using LS-DYNA software. The analysis times, which extended over several days for each model—even with the use of high-performance hardware, represented a significant limitation of this study.
While the impact of soil-structure interaction on structural behavior during seismic events has been well established, this research specifically investigated its effects in the context of explosions and the resulting damage. The findings from this study could inform new guidelines for design codes aimed at enhancing the resilience of structures against explosive threats. Furthermore, existing sensitive buildings around the world can be reassessed and retrofitted, taking into account soil-structure interaction to better withstand explosive loading scenarios.
7. Conclusion
- -
By comparing the results of the two structures from software at different times of the analysis, it can be concluded that the model with SSI has a greater number of removed elements than the model without soil and structure interaction.
- -
The progressive collapse begins when the waves generated by the blast propagate through the structure, at this time gravity loads have a greater impact on progressive collapse and the alternative load path method is a way to deal with this procedure.
- -
Interaction between the soil and the structure significantly influences the results over time and this effect is greater when the blast waves have passed through the structure. The displacement of a point in the model with SSI can be almost 20% more than the displacement of the same point in the model without SSI.
- -
Accounting the interaction between the soil and the structure had less impact on the Von Mises stresses at the assumed beams of both models.
- -
Structures with asymmetric plans and with soil-structure interaction indicated a more critical response to blasts, in a way that the displacement of nodes at selected points of structure increased by 10–30% compared with structures without soil-structure interaction.
- -
The alteration of the substructure’s soil type in the model has led to different results. The structure constructed on SM soil, classified as group E according to NEHRP classification, shows increased susceptibility to progressive damage caused by explosions compared with the other two soil types.
The results indicate that LS-DYNA has the capability to investigate the behavior of various types of soil against explosions and enables the analysis of new topics where soil behavior on structures or explosions is influential, such as underground explosions and their impact on progressive collapse events, as well as surface explosions and their effect on progressive damage in buried structures.
Conflicts of Interest
The authors declare no conflicts of interest.
Funding
This research received no specific grant from any funding agency in the public, commercial, or not-for-profit sectors.
Open Research
Data Availability Statement
The data that support the findings of this study are available from the corresponding author upon reasonable request.


