Study on Wave Velocity Characteristics of Lignin-Modified Loess Site
Abstract
Loess is a Quaternary sediment with special properties including seismic vulnerability and water sensitivity. It is prone to landslides, seismic subsidence, and liquefaction under earthquakes. As an environmentally friendly and economical material, lignin can effectively improve the seismic performance of loess under appropriate dosage. However, the study of wave velocity characteristics in lignin-modified loess (LML) sites is still insufficient. Based on the laboratory test results of LML, this paper comprehensively uses the methods of field wave velocity test and regression analysis to study the wave velocity characteristics of lignin improvement loess sites and establishes the mathematical fitting formula between wave velocity and LML in different dosages with depth. The variation law of wave velocity versus lignin dosage of the sites under the influence of depth is analyzed, and the wave velocity characteristics of the sites under the influence of saturation state and lignin dosage are obtained. The results show that the variation of wave velocity of LML with the thickness of LML is highly consistent with the Power function model under each lignin dosage. The wave velocity of LML increases obviously with the increase of lignin dosage. When the lignin dosage is 1%, the wave velocity of unsaturated LML is the largest and then decreases slowly. When the lignin dosage is 3%, the wave velocity value of saturated LML is the largest and then decreases rapidly. The variation of wave velocity of LML versus the thickness of modified loess and lignin dosage conforms to the Poly surface relationship, and the increase of wave velocity is related to the more advantageous thickness of LML.
1. Introduction
Loess is a type of Quaternary sediment characterized by numerous pores, weak cementation, predominantly silt-sized particles, uniform texture, and well-developed vertical joints. It exhibits high seismic vulnerability and water sensitivity, making it prone to landslides, seismic subsidence, and liquefaction during earthquakes [1, 2]. To effectively mitigate the inherent disaster-prone properties of loess, many researchers have conducted extensive laboratory tests to improve loess, aiming to develop environmentally friendly and cost-effective new materials for loess improvement [3–5]. Recent studies on lignin-modified loess (LML) indicate that lignin, extracted from pulp mill waste liquor, can effectively enhance the cementation strength of loess due to its chelating, bonding, and corrosion-resistant properties, thereby improving the seismic performance of loess [6, 7]. As an environmentally friendly and economical material, lignin has demonstrated clear advantages in loess improvement and has been widely applied in loess reinforcement and earthquake resistance [8, 9].
In the study of seismic waves, compression waves (P-waves) and shear waves (S-waves) are the two primary seismic body waves. Compression waves involve the mass points oscillating back and forth along the wave’s propagation direction, repeatedly compressing rocks and soil. Shear waves involve mass points vibrating perpendicularly to the wave’s propagation direction, resulting in repeated simple shearing of rocks and soil [10, 11]. Compared with compression waves, shear waves exhibit larger amplitudes, longer periods, lower frequencies, slower attenuation, and slower propagation speeds, and they can only propagate through solids [12]. According to elastic wave theory, the velocity of body waves can be related to physical quantities within the soil medium, and establishing relationships or analyzing correlations can enhance their application in geotechnical testing and engineering practice [13–15]. Furthermore, shear wave velocity is a critical parameter reflecting the dynamic characteristics of soil. Based on its transmission velocity in rock and soil media, it can provide dynamic parameters for seismic design, classify building site categories, assess seismic effects, and perform site seismic response and seismic damage potential analyses [16–18].
Based on the principles of wave velocity measurement, researchers have conducted systematic field wave velocity tests in natural loess sites to explore the relationship between wave velocity patterns and ground motion responses. In these studies, the single-hole wave velocity test is widely used as a convenient and effective field test method. Through numerous in situ wave velocity tests and combined with borehole data, scholars have found that the variation of shear wave velocity with depth in natural loess sites across different regions conforms to a power function model [19–21]. Moreover, based on shear wave velocity test results, combined with physical parameters of loess such as void ratio, saturation, and soil compactness, many researchers have employed fuzzy grey relational theory to comprehensively analyze the various factors influencing shear wave velocity [22, 23]. This analysis not only reveals the complex relationship between loess formation depth and shear wave velocity but also underscores the significant impact of soil’s physical state on wave velocity. Additionally, researchers have combined the dynamic characteristics of loess with field wave velocity test results and used statistical methods to explore the correlation between the seismic subsidence, collapsibility, and liquefaction characteristics of loess and its shear wave and compression wave velocities [24–26]. This approach not only provides a new perspective on understanding the seismic behavior of loess but also offers a scientific basis for predicting and assessing site damage caused by earthquakes.
Based on a comprehensive analysis of existing literature, research on the physical and chemical properties, water physical properties, mechanical properties, and reinforcement mechanisms of LML has achieved notable results [27–29]. These studies are primarily conducted through laboratory experiments and theoretical analysis, providing a foundation for understanding how lignin improves the structure and properties of loess. However, research on the wave velocity characteristics of LML under actual site conditions has not received sufficient attention. While many scholars have conducted relatively systematic studies on the wave velocity patterns of natural loess sites and their relationships with ground vibration responses, the relatively scarce data on wave velocity testing of lignin-improved loess sites significantly limit the transition from theory to practice and affect the accurate assessment of improved loess in seismic reinforcement. Therefore, considering the urgent importance of in situ wave velocity tests in the study of LML, this paper builds upon existing laboratory test results of LML and comprehensively employs in situ wave velocity tests and regression analysis to investigate the wave velocity characteristics of lignin-modified unsaturated and saturated loess sites under different dosage conditions. The influence of lignin dosage and saturation state on the shear wave and compression wave velocities of LML sites is discussed. The research findings can provide a robust theoretical basis for the optimal allocation of lignin dosage and improved layer thickness in future foundation improvement practices, contributing to enhanced safety and economic efficiency in practical engineering applications.
2. Materials and Methods
2.1. Test Site and Materials
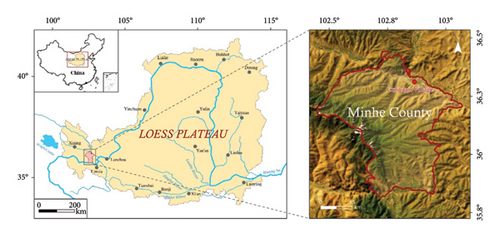
The field test site is located in Minhe County, Qinghai Province, China, which is in the southwestern of the Loess Plateau (Figure 1). It is located on the third terrace of the Huangshui River. The strata are cultivated soil, Q3 loess, and pebbles from top to bottom, and the thickness of Q3 loess layer is about 20 m. The site is located in the transition zone from the Loess Plateau to the Qinghai-Tibet Plateau, with an altitude of approximately 1700 m, a semiarid continental monsoon climate in the northern temperate plateau, an average yearly precipitation of 339.6 mm, and an average annual temperature of 9.07°C. The basic physical and mechanical properties of the loess samples in the site are tested, and the results are shown in Table 1.
| Density (g·cm−3) | Moisture (%) | PI | Soil particle composition (%) | ||
|---|---|---|---|---|---|
| Clay | Silt | Sand | |||
| 1.59 | 12.25 | 9.8 | 22.0 | 57.8 | 20.2 |
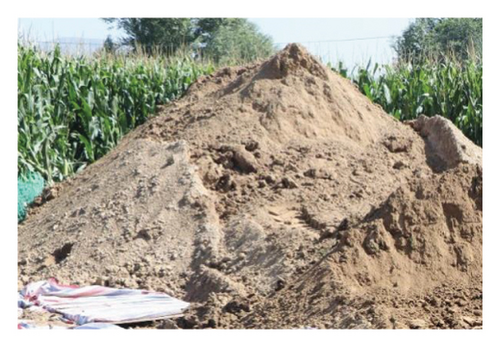
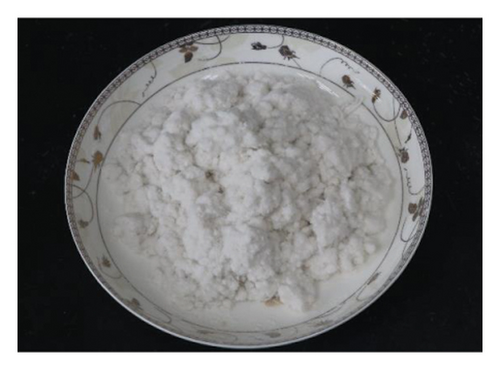
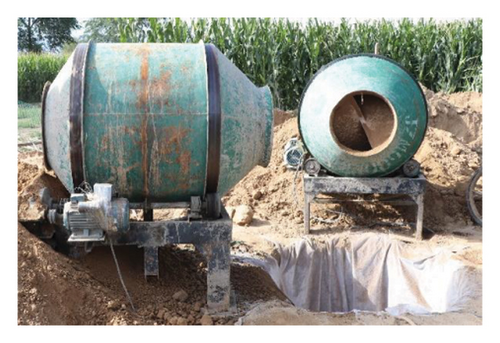
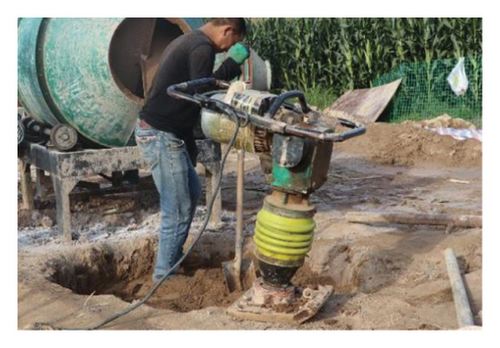
The filling soil used in the test is Minhe Q3 loess excavated from the field test pit, as shown in Figure 2(a). The modified material used in this study is lignin, a by-product material during the production of a paper factory in Hebei Province, which is a white flocculent solid, as shown in Figure 2(b). The mixing equipment used is a mixer, as shown in Figure 3(a), and the tamping equipment used is a small electric tamping machine, as shown in Figure 3(b).
2.2. Test Method
2.2.1. Specimen Preparation
To study the wave velocity characteristics of LML, the lignin dosage and saturation state of the LML test body are determined based on the laboratory test results, as shown in Table 2 [27, 28, 30, 31]. Eight circular test pits with a depth of 8.0 m and a diameter of 1.5 m were excavated (Figure 4(a)). Figure 4(b) shows the excavated test pits. To maintain the moisture content of the LML specimen and prevent water from migrating to the bottom and surrounding soil of the test pit, waterproof geotextiles were laid at the bottom and surrounding of the excavated saturated test pit, as shown in Figure 4(c). Each test pit was rammed into 20 layers. According to the maximum dry density ρd max = 1.75 g/cm3, the height of each layer h = 0.4 m, the diameter d = 1.5 m, the water content w = 12.25%, the volume of the first to 20th layers was calculated, and the weight of loess, lignin, and water used to prepare the specimen were weighed respectively. A mixer was used to mix the specimens fully. The process is shown in Figures 4(d), 4(e), 4(f), 4(g) and 4(h).
| Number | Lignin dosage (%) | Saturation condition |
|---|---|---|
| 1 | 0 | Unsaturated |
| 2 | 0 | Saturated |
| 3 | 0.5 | Unsaturated |
| 4 | 2 | Saturated |
| 5 | 1 | Unsaturated |
| 6 | 3 | Saturated |
| 7 | 2 | Unsaturated |
| 8 | 4 | Saturated |
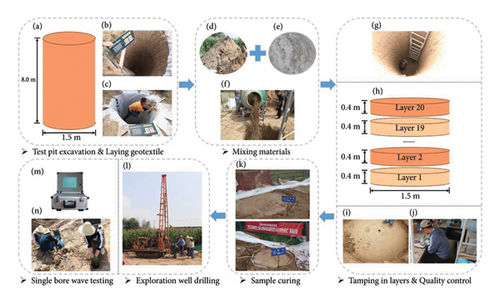
There were four steps in the lignin-amended loess test preparation process. The first step is to pour the mixture from the mixer into the test pit, as shown in Figure 4(f). The second step is to flatten the tamping surface and use a small electric tamping machine to tamp, as shown in Figure 4(i). In the third step, the ring knife sample is taken, and the density test of the ring knife method and the moisture content test of the drying method are carried out. The density, moisture content, and dry density of each layer are calculated, to control the tamping quality in real-time, as shown in Figure 4(j). The fourth step is shaving treatment. The four steps are completed circularly until the 20 layers are completed. Due to the preparation of different specimens at different times, to prevent water evaporation and rainwater infiltration, the surface of the specimen prepared first was covered with plastic film and color strip cloth, as shown in Figure 4(k).
After all the test specimens are prepared, based on the results of the indoor tests [30, 32], the curing time of the test specimens in the field test is determined to be 14 days. For lignin-modified unsaturated loess specimens, an appropriate amount of water is replenished once a day, and the surface of the specimen is covered with a plastic film to ensure that the moisture content remains stable. For the saturated LML samples, water is replenished regularly and quantitatively every day to ensure that the surface is wet and the water is evenly transported in the sample, as shown in Figure 4(k).
2.2.2. Wave Velocity Test
After the curing time of the test body is completed, the drilling positioning and drilling are performed on the surface of the test body, as shown in Figure 4(l). Then, the wave velocity test of the single-hole method is carried out, as shown in Figure 4(m) and 4(n). Among them, Figure 4(m) is a WAVA2000 site vibration tester, it has 4 channels, the sampling numbers can be 512, 1024, 2048, and 4096, the minimum sampling interval is 30 μs, and the passband is 0.5–4000 Hz. The test principle is to set the vibration source at the orifice in the same hole and place the geophone at different depths in the hole to measure the time required for the wave generated by the vibration source at the orifice to travel to different depths in the hole and calculate the propagation speed.
The three-component geophone is placed in the borehole, and a board with a length of 2.5 m is placed at a distance of 1 m from the orifice. A load with a weight of approximately 500 kg is placed on the board, and a hammer is used to strike the end of the board horizontally in two opposite directions along the longitudinal axis of the board. The shear wave generated on the surface propagates through the stratum to the three-component probe (vertical knocking on the board when measuring the compression wave velocity). The collector of the equipment was lifted 0.5 m when the wave velocity tests were completed. Finally, the measured waveforms in the positive and negative directions are read on the WAVE 2000 site vibration tester and processing software, and the intersection of the waveforms is found. Read the propagation time of the first arrival wave, to calculate the wave velocity of each measuring point.
3. Results and Analyses
3.1. The Effect of Lignin Dosage on Moisture Content
The moisture content of LML is shown in Table 3. The moisture of the unsaturated LML is from 13.1% to 16.3%, the average is 15.1%, which is close to the optimum moisture content to maintain the compaction of the samples. The moisture of the saturated LML is from 22.9 to 23.7, the average is 23.3. The saturation degree of the samples is from 93.2 to 96.5, the average is 95.0. With the increase of the lignin content, the moisture of the unsaturated LML decreases first and increases when the lignin content is larger than 1%. The minimum value of the moisture of the saturated LML appears at the lignin content of 3%.
| Test number | Lignin dosage (%) | Saturated condition | Moisture content (%) | Saturation degree (%) |
|---|---|---|---|---|
| 1 | 0 | Unsaturated | 14.9–16.3 | 60.7–66.4 |
| 2 | 0 | Saturated | 23.1–23.6 | 94.1–96.1 |
| 3 | 0.5 | Unsaturated | 14.5–16.0 | 59.0–65.1 |
| 4 | 2 | Saturated | 22.9–23.6 | 93.2–96.1 |
| 5 | 1 | Unsaturated | 13.1–15.0 | 53.3–61.1 |
| 6 | 3 | Saturated | 23.3–23.5 | 94.9–95.7 |
| 7 | 2 | Unsaturated | 14.8–16.2 | 60.3–66.0 |
| 8 | 4 | Saturated | 23.0–23.7 | 93.6–96.5 |
3.2. Effect of Thickness of LML on Wave Velocity
The relationship between the wave velocity of the modified loess and the thickness of the LML is shown in Figures 5 and 6.
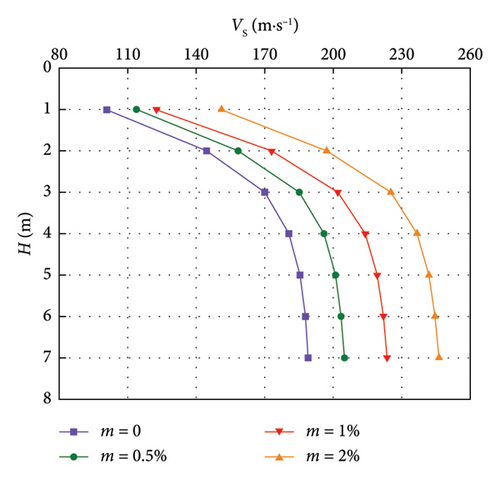
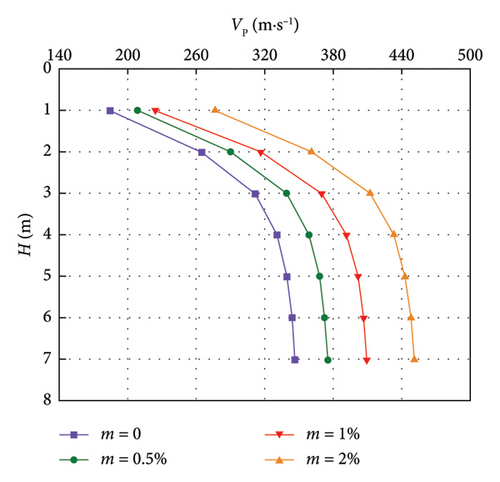
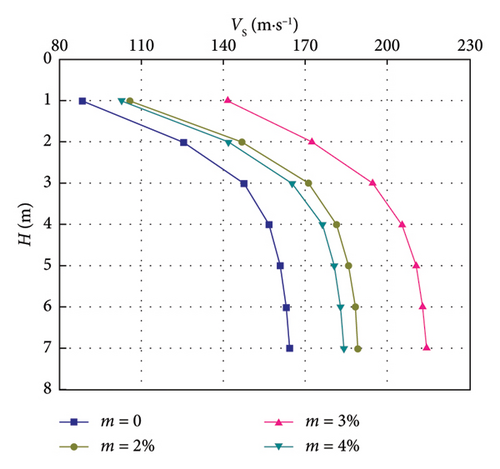
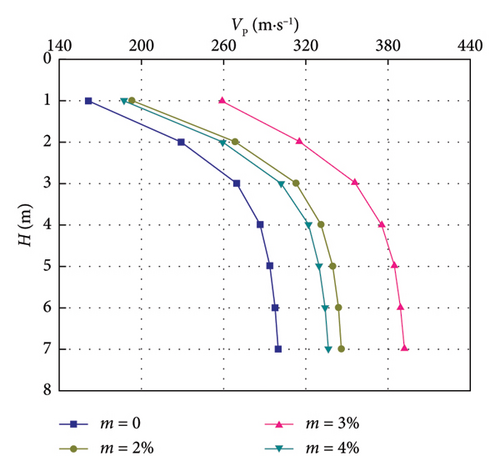
It can be seen from Figures 5 and 6 that the wave velocity increases with the increase of the thickness of LML under each lignin dosage. The shear wave velocity range of lignin-modified unsaturated loess is 101.0–246.3 m/s, and the compression wave velocity range is 184.8–450.7 m/s; the shear wave velocity range of the saturated LML is 88.3–214.1 m/s, and the compression wave velocity range is 161.6–391.8 m/s; when the lignin dosage m = 0, the wave velocity of the unsaturated loess is about 1.15 times that of the saturated loess, which is due to the dissolution of some of the soluble salts that play a role in cementing the saturated loess [33]. The particles adsorb the surrounding water film, increasing the thickness of the electric double layer [30], a decrease in cohesion, and the particles around the pores are rearranged due to the deconstruction of the overhead pores. The lubrication between the particles increases with the saturation of the loess, resulting in a decrease in the internal friction angle, which eventually reduces the strength of the saturated loess [34]; when the lignin dosage m = 2%, the wave velocity of the unsaturated LML is about 1.18 times that of the saturated LML. This is because the free water phase in the saturated loess is more lubricated than that in the unsaturated loess, resulting in the hydration and protonation of lignin. After reducing the thickness of the electric double layer to a certain extent [30], the electric double layer is still thicker than that of unsaturated loess. Thus, its cohesion is smaller than that of unsaturated loess, and its strength is also smaller than that of unsaturated loess.
The curve-fitting parameters of the relationship between V and H of LML are shown in Table 4. It can be seen that the correlation coefficient R2 ≥ 0.9005, indicating that the change of V with H obviously conforms to the power function relationship.
| Wave | Saturation condition | Lignin dosage (%) | Fitting parameters | R2 | |
|---|---|---|---|---|---|
| a | b | ||||
| S-wave | Unsaturated | 0 | 115.727 | 0.282 | 0.90058 |
| S-wave | Unsaturated | 0.5 | 128.518 | 0.268 | 0.90517 |
| S-wave | Unsaturated | 1 | 164.997 | 0.230 | 0.91358 |
| S-wave | Unsaturated | 2 | 139.455 | 0.271 | 0.90050 |
| P-wave | Unsaturated | 0 | 211.780 | 0.282 | 0.90058 |
| P-wave | Unsaturated | 0.5 | 235.188 | 0.268 | 0.90517 |
| P-wave | Unsaturated | 1 | 301.945 | 0.230 | 0.91358 |
| P-wave | Unsaturated | 2 | 255.202 | 0.271 | 0.90050 |
| S-wave | Saturated | 0 | 100.669 | 0.279 | 0.90305 |
| S-wave | Saturated | 2 | 119.013 | 0.266 | 0.90417 |
| S-wave | Saturated | 3 | 149.001 | 0.205 | 0.94300 |
| S-wave | Saturated | 4 | 115.087 | 0.269 | 0.91069 |
| P-wave | Saturated | 0 | 184.225 | 0.279 | 0.90305 |
| P-wave | Saturated | 2 | 217.774 | 0.266 | 0.90447 |
| P-wave | Saturated | 3 | 272.728 | 0.205 | 0.94312 |
| P-wave | Saturated | 4 | 210.609 | 0.269 | 0.91069 |
It can be seen that the fitting relationship between the wave velocity of LML and the thickness of modified loess has a similar change rule with equations (2) and (3).
3.3. Effect of Lignin Dosage on Wave Velocity
The relationship between the wave velocity of LML and the lignin dosage is shown in Figures 7 and 8.
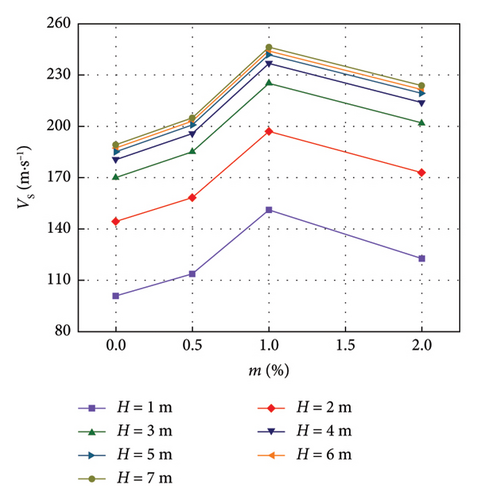
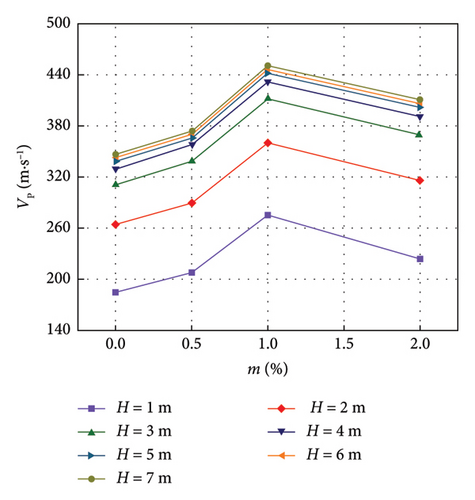
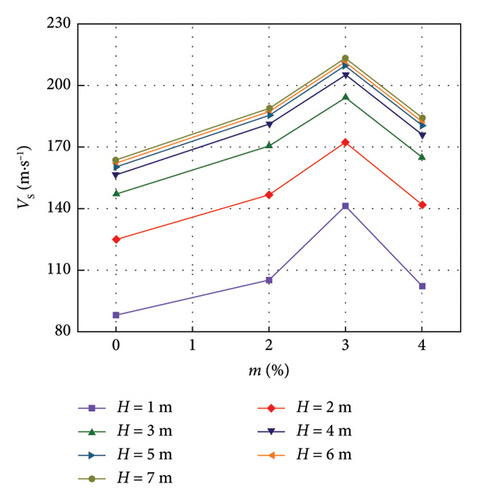
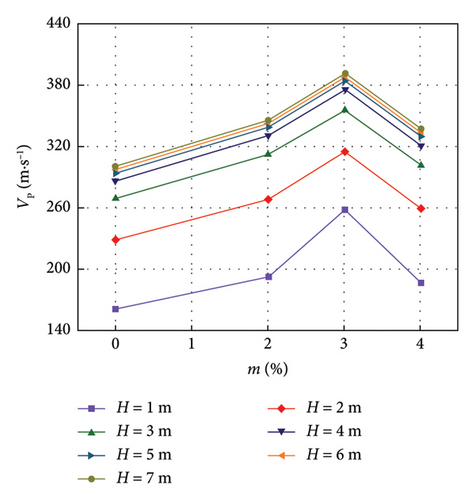
It can be seen from Figures 7 and 8 that under the condition of LML thickness H = 1, 2, 3, 4, 5, 6, and 7 m, with the increase of lignin dosage, the wave velocity of modified unsaturated loess increases slowly and rapidly, and then decreases slowly; the wave velocity of the improved saturated loess first increases slowly and quickly and then decreases rapidly. Under the thickness of each LML, the wave velocity of the modified unsaturated loess with lignin dosage m = 1% is the largest, the maximum shear wave velocity value is 223.6 m/s and the maximum compression wave velocity value is 409.2 m/s at H = 7 m, while the shear wave velocity and compression wave velocity of the modified unsaturated loess with m = 0 at H = 7 m is 189.1 m/s and 346.0 m/s, respectively, indicating that after adding 1% lignin. The shear wave velocity and compression wave velocity of the improved unsaturated loess increased by 1.18%; the wave velocity of the modified saturated loess with lignin dosage m = 3% is the largest, and the maximum shear wave velocity value is 183.9 m/s and the maximum compression wave velocity value is 336.5 m/s when H = 7 m. The shear wave velocity and compression wave velocity of the modified unsaturated loess with m = 0 are 163.9 m/s and 299.9 m/s, respectively. When H = 7 m, indicating that the shear wave velocity and compression wave velocity of the modified saturated loess are increased by 1.12% after the addition of 3% lignin.
3.4. The Influence of Modified Loess Thickness and Lignin Dosage on Wave Velocity
To analyze the variation law of wave velocity under the coupling effect of LML thickness and lignin dosage, the three-dimensional scatter diagram of wave velocity with LML thickness and lignin dosage was drawn, and the nonlinear surface fitting was carried out. The results are shown in Figures 9 and 10.
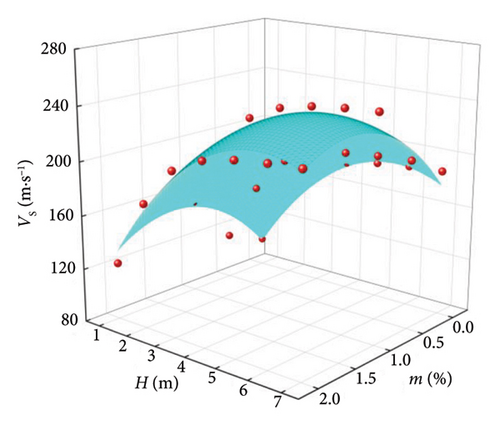
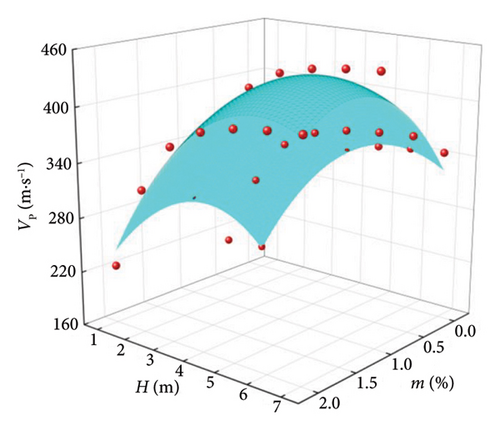
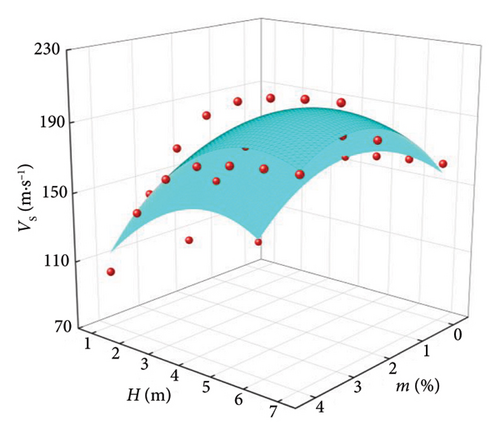
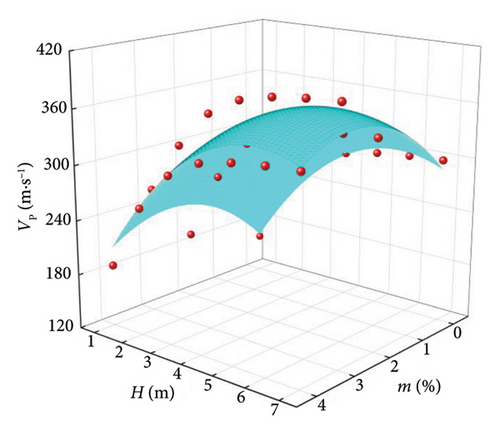
The surface fitting parameters and correlation coefficients of the relationship between V, H, and m of LML are shown in Table 5, and the standardized regression coefficients of H and m obtained by stepwise regression [35] are shown in Table 6. It can be seen from Table 6 that the correlation coefficient R2 ≥ 0.895, indicates that the change with V and H is obviously in line with the Poly surface relationship. It can be seen from Table 6 that the standardized regression coefficient of H is greater than the standardized regression coefficient of m, indicating that the increase of V is related to the advantage of H.
| Wave | Saturation condition | Fitting parameters | R2 | |||||
|---|---|---|---|---|---|---|---|---|
| a | b | c | p | q | C | |||
| S-wave | Unsaturated | −4.275 | −31.210 | 0.943 | 47.323 | 77.475 | 56.820 | 0.93229 |
| P-wave | Unsaturated | −7.824 | −57.115 | 1.725 | 86.601 | 141.778 | 103.980 | 0.93229 |
| S-wave | Saturated | −3.443 | −5.961 | 0.433 | 39.163 | 28.624 | 53.771 | 0.89506 |
| P-wave | Saturated | −6.300 | −10.911 | 0.791 | 71.659 | 52.396 | 98.407 | 0.89503 |
| Wave | Saturation condition | The standardized regression coefficient of H | The standardized regression coefficient of m |
|---|---|---|---|
| S-wave | Unsaturated | 0.735 | 0.324 |
| P-wave | Unsaturated | 0.735 | 0.324 |
| S-wave | Saturated | 0.734 | 0.332 |
| P-wave | Saturated | 0.734 | 0.333 |
- Note: H is the thickness of the lignin-modified loess layer, and m is the lignin dosage.
3.5. Mechanism of the Variation of Shear Wave Velocity Caused by Lignin Modification
Laboratory experiments indicate that the fine particles in lignin can penetrate into the pores between loess particles, making the soil more compact and reducing the space available for deformation under external forces. Consequently, this can enhance the soil’s resistance to deformation [6, 8, 27, 28, 36]. Additionally, lignin has a macromolecular structure, and lignin molecules can chelate with each other, forming a relatively stable reticular structure that acts as an anchor for the soil, making it less prone to deformation [28, 31]. The larger fibers in lignin also act as reinforcement for the soil, enhancing its ability to resist tensile deformation. Moreover, these larger lignin fibers have an adsorptive effect on free water in the soil, which can further enhance the stability of the soil [30]. Based on the results shown in Figures 7, 8, and 9, incorporating lignin into the loess can increase the wave velocity of the improved soil. As the depth increases, the wave velocity of the improved soil first increases rapidly and then more slowly. This is because the dosage of lignin enhances the soil’s compactness, with the existing pores in the soil being filled by fine lignin particles, which accelerates the propagation of waves in the improved loess sites. Besides, the incorporation of lignin into loess can increase the strength of the loess and relatively reduce the amount of free water, thereby moderately increasing the wave velocity of the loess sites [36–38]. Furthermore, indoor mechanical tests have shown that adding lignin into the loess can increase the dynamic elastic modulus of the LML and decrease the damping ratio. The increase in elasticity and the decrease in viscosity of the LML also contribute to the increase in wave velocity. For both unsaturated and saturated LML, the dynamic elastic modulus reaches its maximum value at lignin dosages of 1% and 3%, respectively, and the damping ratios are at their minimum at these two dosages. This is consistent with the results shown in Figures 7 and 8, further indicating that the mechanism by which lignin modification affects the wave velocity of modified loess primarily includes the gap-filling compaction effect of lignin, the improvement of medium elasticity and viscosity by lignin, and the adsorption effect of lignin on free water.
4. Conclusion
- 1.
Under each lignin dosage, the wave velocity of LML increases with the thickness of LML. The variation law conforms to the power function model, and the correlation coefficient R2 > 0.90.
- 2.
Under the thickness of each LML, with the increase of lignin dosage, the wave velocity of the modified unsaturated loess first increases slowly and rapidly and then decreases slowly. When the lignin dosage m = 1%, it reaches the peak. The wave velocity of the improved saturated loess first increases slowly and rapidly and then decreases rapidly. When the lignin dosage m = 3%, it reaches the peak.
- 3.
The variation of wave velocity of LML with the thickness of modified loess and the dosage of lignin conforms to the Poly surface relationship, and the correlation coefficient R2 > 0.89. At the same time, the normalized regression coefficient of LML thickness is greater than the normalized regression coefficient of lignin dosage m, and the increase of wave velocity is related to the advantage of LML thickness.
- 4.
Under the same lignin dosage, the wave velocity of LML at the same thickness decreases with the increase of saturation state.
Conflicts of Interest
The authors declare no conflicts of interest.
Funding
This study was supported in part by the Open Project of Gansu Provincial Research Center for Conservation of Dunhuang Cultural Heritage (Grant No. GDW2021YB07), the Special Fund for Innovation Team, Gansu Earthquake Agency (Grant No. 2020TD-01-01), the Funding of Science for Earthquake Resilience (Grant Nos. XH20057 and XH21034), and the National Natural Science Foundation of China (Grant Nos. 51778590 and 51408567).
Acknowledgments
The authors thank Dr. Fuqiang Liu, Dr. Xingyu Ma, Dr. Jinlian Ma, and Master student Xiaowei Xu for their contributions to field testing, editing, and language modification.
Open Research
Data Availability Statement
All data included in this study are available upon request by contacting the corresponding authors.


