Optimization and Vibration Response Analysis of Vehicle Suspension Structure With Inerter
Abstract
The structural composition and component parameters of the suspension will have an impact on the vibration reduction and handling performance of the vehicle. This paper innovatively proposes a suspension structure using an inerter and mathematically models it. To further improve the comprehensive performance of the designed suspension, the component parameters are optimized and the bushing is selected based on merit. The influence of parameters on suspension response is obtained using numerical methods, and the damping effect and handling performance of the suspension are deeply studied. Based on the analysis results of this paper, the designed suspension structure and its optimized design have effectively improved the overall performance of the vehicle. In addition to optimizing the parameters of suspension components, optimizing the selection of suspension bushings also has a positive impact on the overall performance of the vehicle. Therefore, this study provides a new design approach for improving the overall performance of suspension systems.
1. Introduction
Suspension, as a bridge between the vehicle body and axle transmission, has always been a key research object for improving driving safety and comfort. After the invention of the inerter, a new type of mechanical isolation system constructed by the inerter, spring, and damper emerged. Therefore, studying the suspension composed of inerter, spring, and damper has both forward-looking and practical value.
The invention of the inerter is aimed at improving the theory of mechanical–electrical similarity, enabling mechanical and electrical components to correspond one-to-one. Cao et al. [1] ingeniously applied the inerter to the vibration control of seat suspensions, and using the inerter to generate controllable damping forces is a highly innovative research work. Shen et al. [2] proposed a hydropneumatic suspension to enhance comfort, which significantly improved comfort by combining the inerter with the suspension. Yang et al. [3] explored the vibration isolation performance of energy-saving suspension using the inerter from the perspective of energy recovery and proved the effectiveness of inerters in the field of energy recovery. They used optimization algorithms to improve the design of vibration reduction structures. Ge et al. [4] used parameter optimization methods based on analytical solutions to optimize suspension parameters, simplifying the optimization process and solving the inherent inertia problem of actuators. Although analytical solutions can simplify the optimization process, the numerical solutions of multiobjective optimization algorithms are more accurate. Wei and Su [5] optimized the switching function during active suspension control using a particle swarm optimization algorithm, improving the dynamic performance of the suspension. Gao and Han [6] optimized the stiffness of the bushing, improving the stability of the vehicle during operation. However, the impact of the damping coefficient of the bushing, an important indicator, on stability has not been considered. Nie et al. [7] used a vehicle equivalent model to analyze the response of the suspension through theoretical and experimental research, demonstrating the load adaptability of the designed structure during operation. Zhang et al. [8] studied a new type of viscous damper device related to displacement and analyzed the mathematical and dynamic relationship of the device through theory and experiment. The adaptability of the mem-damper to loads is analyzed using vehicle suspension as the carrier. Zhang et al. [9] combined the inerter with application controllers for suspension and simulated and analyzed the designed suspension damping structure using the vertical acceleration and its rate of change of the vehicle body as input signals. Chen et al. [10] used the LQR control algorithm to control the coefficients of the damping components of the ISD suspension, making both adjustable simultaneously, further optimizing the overall performance of the suspension during operation. Wang et al. [11] studied the performance of suspension structures using inerters under the influence of nonlinear factors and investigated the nonlinear factors. To explore the application potential of the diamond-shaped structure inerter, Zhang et al. [12] established a structure of the seat suspension using numerical methods and studied the mechanism of seat suspension load adaptation. Kuznetsov et al. [13] established a suspension structure using inerters to improve ride comfort and optimized the parameters using weighted acceleration as the evaluation index. Hu and Chen [14] discussed the improvement effect of different combinations of inerters, springs, and dampers on the behavior of suspension during operation. Li et al. [15, 16] discussed the damping effect of two-stage vehicle suspensions and analyzed the variation law of damping performance after the combination of inerter and traditional suspensions. Hu et al. [17–19] analyzed the performance of suspension systems with control strategies in terms of vibration reduction and stability and proposed a switching method to adjust the state of the suspension during operation, thereby better achieving stability during vibration suppression. Shi et al. [20] analyzed the characteristics of suspension using inerters in nonlinear behavior and studied the inducing effects of factors such as friction and clearance on nonlinear behavior. In this paper, the optimization design of the suspension structure using the inerter is carried out. By optimizing the parameters of the damping components and optimizing the selection of bushings, the overall performance of the suspension has been further optimized.
The structure of the paper is as follows. In Section 2, the mathematical model of the vehicle suspension system is established. In Section 3, the optimization design of the vehicle suspension system has been carried out. In Section 4, the dynamic response of the suspension is discussed, the influence of bushing parameters on power transmission is studied, and the comparative analysis of vehicle handling stability is explored. Finally, the conclusions are given in Section 5.
2. Mathematical Modeling of the Vehicle Suspension System
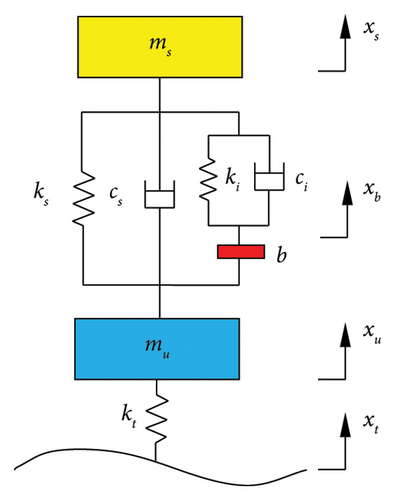
To study the vibration response of a vehicle suspension structure using an inerter containing damping components, the model of the vehicle suspension system is established as shown in Figure 1.
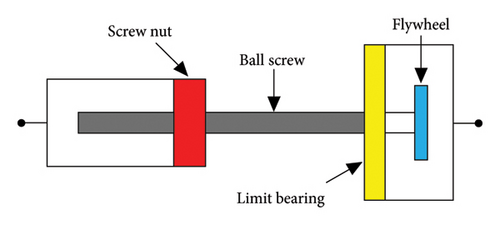
The physical implementation structures of inerters mainly include ball screw inerter, gear rack inerter, and hydraulic inerter. The ball screw type inerter is shown in Figure 2.
3. Optimization Design of the Vehicle Suspension System
To achieve the goal of suspension optimization design, the parameters used for numerical simulation were first selected.
The model parameters of the vehicle suspension system are shown in Table 1 [21–23].
| Item | Notation | Value |
|---|---|---|
| Spring-loaded mass | ms | 320 kg |
| Nonspring-loaded mass | mu | 45 kg |
| Tire stiffness | kt | 190 kN·m−1 |
| Main spring stiffness | ks | 22 kN·m−1 |
| Main damping coefficient | cs | 1 kN·s·m−1 |
| Inertance | b | 288 kg |
| Secondary spring stiffness | ki | 6.64 kN·m−1 |
| Secondary damping coefficient | ci | 1.608 kN·s·m−1 |
| Road roughness coefficient | G0 | 5 × 10⁻⁶ m3·cycle−1 |
| Vehicle speed | v | 20 m·s−1 |
| Lower cutoff frequency | f0 | 0.01 Hz |
3.1. Optimization of Suspension Parameters
3.2. Power Flow Analysis of ISD Suspension
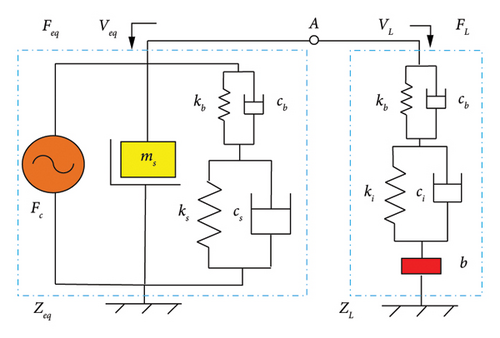
The model in Figure 3 introduces bushings based on the model in Figure 1 and establishes the mechanical mesh of the vehicle with bushings.
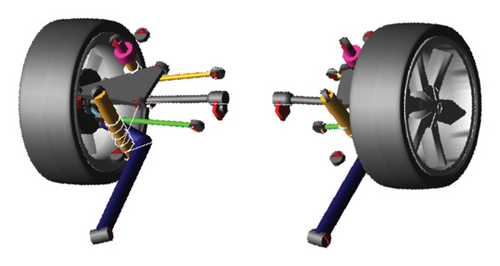
To verify the correctness of the established suspension system model, a multibody dynamic model of the suspension system illustrated in Figure 4 is established in the simulation software ADAMS/car, and the parameter kb = 450 N/mm and cb = 0.50 N·s·mm−1 are selected.
The comparison of power flow obtained through theoretical calculation and simulation data is illustrated in Figure 5.
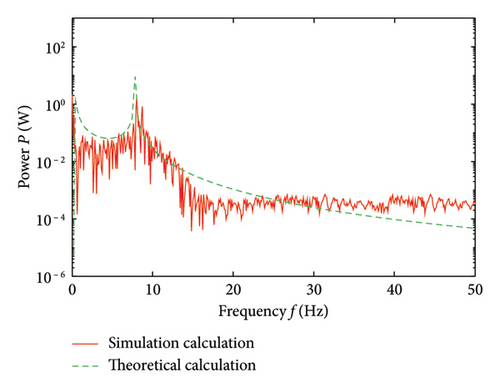
In Figure 5, as the frequency increases, the trend of the power flow spectrum obtained through theoretical calculation and simulation data is basically consistent, and the error is not large, which proves the correctness of the constructed model.
4. Results and Discussion
4.1. Dynamic Response of Vehicle Suspension
To characterize the impact of suspension parameters optimized by a genetic algorithm, the dynamic response of the vehicle suspension system under the design parameters before optimization is compared. The dynamic response of the vehicle suspension system before and after parameter optimization is illustrated in Figure 6.
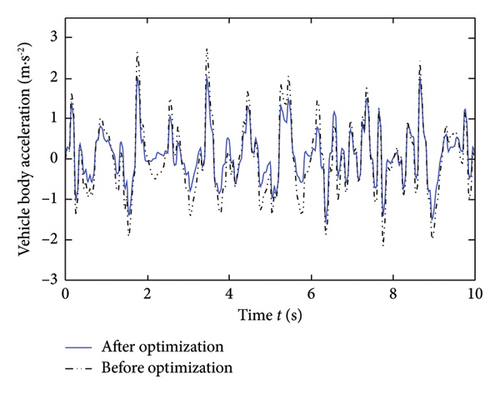
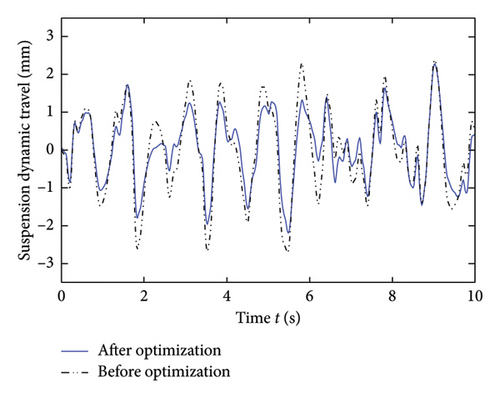
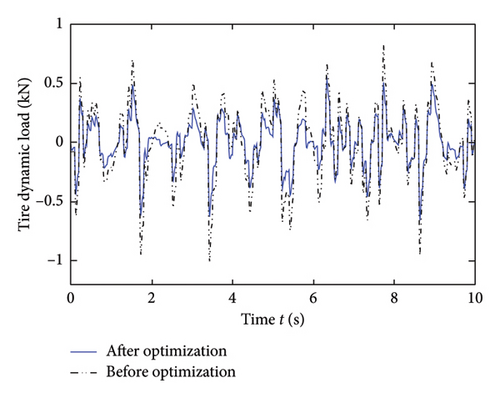
In Figure 6, compared to before optimization, the optimized vehicle body acceleration, suspension working space, and tire dynamic load indicators have all been significantly improved. The parameters obtained through genetic algorithm optimization are significantly better than the design parameters before optimization.
The comparison of peak-to-peak values before and after optimization is shown in Table 2. In Table 2, the peak-to-peak value of vehicle body acceleration improved by 25.8%. The peak-to-peak value of suspension dynamic travel improved by 11.2%. The peak-to-peak value of the tire dynamic load improved by 34.9%. The comprehensive damping performance of the optimized vehicle suspension system has been improved.
| Evaluation indicator | Before optimization | After optimization | Improvement level (%) |
|---|---|---|---|
| Vehicle body acceleration | 4.93 m·s−2 | 3.66 m·s−2 | 25.8 |
| Suspension dynamic travel | 5.08 mm | 4.51 mm | 11.2 |
| Tire dynamic load | 1.89 kN | 1.23 kN | 34.9 |
4.2. The Influence of Bushing Parameters on Power Transmission
Blindly optimizing the parameters according to optimization methods may result in parameters that are not suitable for production or have a long production cycle, and the optimization design lacks practical significance. Therefore, in the actual application process, optimization and selection of existing bushing parameters are carried out to complete the optimization and matching of suspension bushing parameters.
The bushing parameters of the three mainstream vehicle suspensions in the market are shown in Table 3.
| Bushing type | Stiffness (N/mm) | Damping coefficient (N·s·mm−1) |
|---|---|---|
| Type 1 | 450 | 0.50 |
| Type 2 | 800 | 0.15 |
| Type 3 | 300 | 2.00 |
Based on the stiffness and damping coefficients of different types of bushings in Table 3, this study investigates the influence of bushing parameters on the vibration power of suspension systems based on vibration power flow theory. The power flow spectra under different stiffnesses are shown in Figure 7.
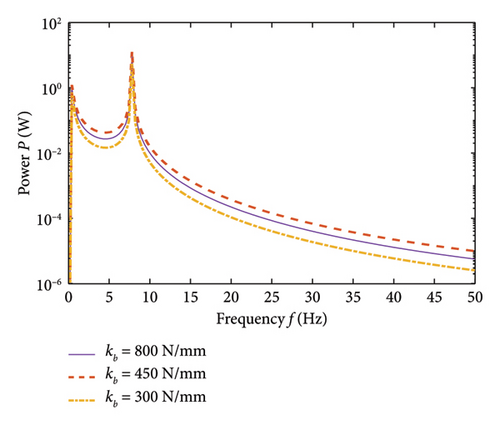
In Figure 7, the stiffness variation of the bushing has a relatively small impact on the vibration power flow transmitted to the body. In 0–50 Hz, the power flow spectrum at kb = 300 N/mm is always lower than the other two types of power flow spectra.
The power flow spectrum with different damping is shown in Figure 8.
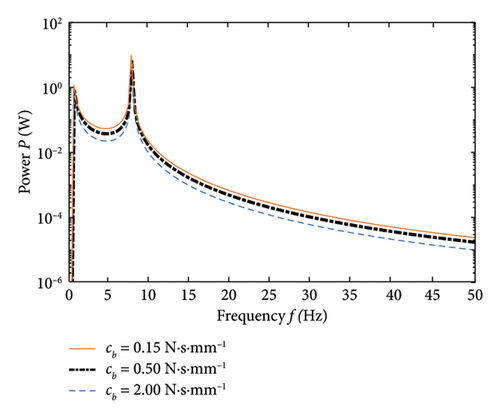
In Figure 8, when the damping coefficient of the bushing increases to a small extent, the amplitude difference of the power flow spectrum is small. However, as the damping coefficient increases from 0.50 to 2.00 N·s·mm−1, the amplitude difference of the power flow spectrum becomes apparent. In 0–50 Hz, the power flow spectrum of the bushing with a damping coefficient of cb = 2.00 N·s·mm−1 is always lower than the power flow spectra of the other two types. In summary, compared to Type 1 and Type 2, Type 3 is more suitable for reducing the energy transmitted through the suspension to the body, enabling the suspension to achieve better vibration reduction effects.
4.3. Comparative Analysis of Vehicle Handling Stability
The handling stability of the vehicle is also an important performance evaluation indicator. To fully demonstrate the superiority of the ISD suspension proposed in this manuscript in terms of comprehensive damping performance, the manuscript introduces a comparative analysis of vehicle handling stability between traditional suspension and ISD suspension.
As the body roll changes, the change in toe angle will directly reflect the stability when encountering obstacles during straight-line driving and the magnitude of the lateral force on the tires. The toe angle variation curve between ISD suspension and traditional suspension is shown in Figure 9.
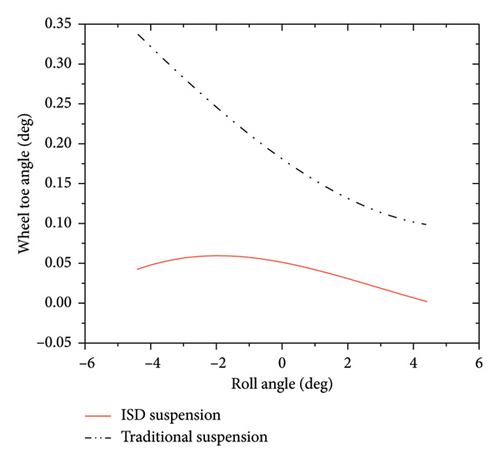
In Figure 9, ISD suspension shows obvious advantages in roll motion, indicating that its performance significantly improves when facing complex working conditions, ensuring good driving stability of the vehicle. From the perspective of the coefficient of variation, ISD suspension has decreased by 13.6% compared to traditional suspension. Overall analysis shows that the ISD suspension has a smaller variation during roll motion. When the vehicle tilts, there is a significant height difference between the left and right wheels. The ball screw converts the linear displacement difference into the rotation of the flywheel, which unleashes the potential of inertia.
The variation curve of the kingpin inclination angle between ISD suspension and traditional suspension under the condition of dual wheel same direction jumping is shown in Figure 10.
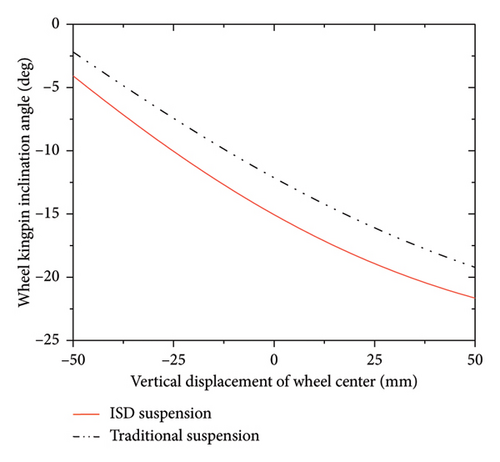
In Figure 10, when jumping up, it should be at a negative camber angle as much as possible. To ensure the same total angle, the inclination angle of the main pin should be increased. At this time, the change in the inclination angle of the main pin of the ISD suspension meets this requirement, and the linearity of the inclination angle of the ISD suspension is good.
5. Conclusions
- 1.
Using a genetic algorithm to optimize suspension parameters, after about 25 generations, the optimal value of the fitness function is basically stable. Most of the data generated by 100 generations are concentrated at a point, which corresponds to the optimal parameter.
- 2.
The optimized parameters are significantly better than the design parameters before optimization, and the comprehensive damping performance of the vehicle suspension system has been improved after optimization.
- 3.
The trend of the power flow spectrum of the vehicle suspension system obtained through theoretical calculations and simulation data is basically consistent, which verifies the correctness of the constructed model.
- 4.
ISD suspension shows obvious advantages in roll motion, indicating that its performance significantly improves when facing complex working conditions, ensuring good driving stability of the vehicle.
Conflicts of Interest
The authors declare no conflicts of interest.
Funding
This study was supported by the National Natural Science Foundation of China (Grant no. 52275090).
Open Research
Data Availability Statement
The data that support the findings of this study are available from the corresponding author upon reasonable request.


