Slope Stability Analysis Considering Rainfall Infiltration Based on Energy Conservation
Abstract
In recent years, increasing slope instability accidents caused by rainfall occur. In order to quantitatively analyze the influence of rainfall infiltration on slope stability more accurately, based on the traditional Green–Ampt infiltration model, the influence of the slope’s angle and the characteristics of unsaturated loess were considered and the saturated zone and unsaturated zone were calculated separately in this paper. Through the energy conservation equation, this paper transferred the influence of rainfall infiltration into generalized penetration force and changed the penetration force and composite soil nailing wall supporting force into vertical article point method using the Bishop internal force hypothesis. The slope was divided into two parts, which were calculated, respectively, and integrated by the weighted solving method, and the calculation formula of overall stability of composite soil nailing wall retaining structure was deduced under the action of rainfall. For example, the difference of 1.165 obtained in this paper’s formula is 0.122 compared with the traditional Bishop method (1.043), which not only verifies the correctness of the formula in this paper but also reflects the weakening of the stability coefficient caused by rainfall. Since the soil parameters of unsaturated soil are weakened by rainfall, there may be some errors, and the result provides reference for similar support under special natural environment.
1. Introduction
Rainfall infiltration is the most common cause of slope instability. Every year, many geological disasters occur, such as collapse of foundation pit, landslides, and debris flow, and many of them are related to rainfall. In recent years, scholars have done a lot of research on the problem of slope deformation and failure caused by rainfall infiltration from different perspectives [1].
In the early stage, most of the research stayed in saturated seepage; for example, Darcy’s law was usually used as the rainfall infiltration model, which ignored the existence of unsaturated soil. In reality, saturated soil is very rare. For the soft soil area along the southeast coast in China and some places with high groundwater levels, the study of saturated seepage is relatively meaningful. But for the northwest area in China, most of the loess is unsaturated, and forcing the saturated seepage idea to apply to the unsaturated region may produce a large error [2]. Therefore, many scholars began to change their thinking and try to consider the characteristics of unsaturated soil in the permeability model [3, 4].
The instability of unsaturated soil is mainly due to the presence of gas in the soil, and the water in the soil is difficult to saturate. When rainfall infiltration leads to an increase in pore water pressure, the matric suction and shear strength of the soil decrease, which will lead to the instability and failure of the slope.
Nowadays, the commonly used rainfall infiltration models include the Green–Ampt infiltration model, Philip infiltration model [5], Kostiyacov infiltration model, and Horton infiltration model [6]. Both of the Kostiyacov infiltration model and the Horton infiltration model are empirical equations, and the parameters are basically obtained by fitting. The Philip infiltration model needs to solve the vertical infiltration series, which may lead to the inaccuracy of its results. The Green–Ampt infiltration model has been widely recognized for its advantages of simple form, excellent expansibility, and clear concept. It is not only the most widely used model to solve the infiltration problem of the saturated soil but also suitable for the infiltration problem of unsaturated soil [7]. Liu et al. [8] concluded that the unsaturated soil slope would suffer multiple short-term failures when the cohesion reduced through the saturated infiltration principle and the Green–Ampt infiltration model. Lei et al. [9] substituted the inclination angle of the infinite slope into the traditional Green–Ampt infiltration model and found that when other parameters were unchanged, the larger the inclination angle, the smaller the infiltration potential energy of rainwater. Combined with various conditions, Pan et al. [10] proposed an improved infiltration model that could be used under different rainfall conditions. Using this model, they found that the migration velocity of the wetting front was an exponential function. Tsai et al. [11] estimated matric suction at the wet front by calculating the infiltration process of the wet front with different particle sizes, considering the dynamic effect of capillary pressure. Based on the Green–Ampt infiltration model, Yao et al. [12] analyzed the variation process of the wet front in the slope during rainfall, considering the influence of the unsaturated layer above the wet front. By studying the effects of soil shrinkage and expansion on saturated water conductivity, Stewart [13] proposed a dynamic Green–Ampt seepage model. Compared with the traditional Green–Ampt model, the dynamic Green–Ampt seepage model can calculate infiltration and runoff at multiple scales.
In terms of the influence of rainfall on slope stability, scholars have found that the reason for slope instability induced by rainfall infiltration is that rainfall infiltration would increase soil moisture content and pore water pressure and reduce matric suction, which changes the mechanical properties of soil and weakens its shear strength, thus reducing the anti-sliding force [14, 15]. Lu, Wayllace, and Oh [16] found that rainfall infiltration increased the soil weight to a certain extent and then increased the sliding force of landslide, which was more likely to induce landslide. Carey and Petley [17] analyzed the Lowthervill Landslide and found that the increase of pore water pressure on the slope resulted in the decrease of effective stress, which is the main reason for the slope collapse. Tang et al. [18] generated random rainfall events according to average rainfall intensity and duration and calculated landslide failure probability under different rainfall conditions with the Monte Carlo method. Liang et al. [19] found that the influence of rainfall intensity on slope erosion was greater than that of slope angle and vegetation coverage. Based on the theoretical study of unsaturated soil, Herrada, Gutierrez-Martin, and Montanero [20] established a physical model of soil permeability characteristics in the research process and analyzed it with numerical theoretical methods. Tian et al. [21] proposed a new slope stability analysis method considering pore gas pressure and studied the influence of airflow on slope stability through the numerical method. Huang, Loveridge, and Satyanaga [22] established a new model to analyze shallow landslides, which not only retains the simplicity of the traditional infinite slope model but also significantly improves accuracy.
In summary, the quantitative effects of rainfall in unsaturated loess areas have not been considered when analyzing slope stability. To more accurately calculate the stability coefficient of a composite soil-nail wall-supported slope under rainfall, this paper modifies the traditional Green–Ampt rainfall infiltration model, considering the slope angle and the characteristics of unsaturated loess. The most significant novelty lies in the application of the principle of energy conservation to quantify rainfall infiltration as a mechanical concept, and the quantified values are then substituted into the vertical slice method to analyze slope stability. The author hopes that this paper will improve the calculation system for slope stability with soil nails in unsaturated soils. And we represent the results of independent research, and all references to other people’s work are clearly cited.
2. Seepage Force Calculation of Rainfall Infiltration Based on Energy Conservation Equation
2.1. Traditional Green–Ampt Infiltration Model
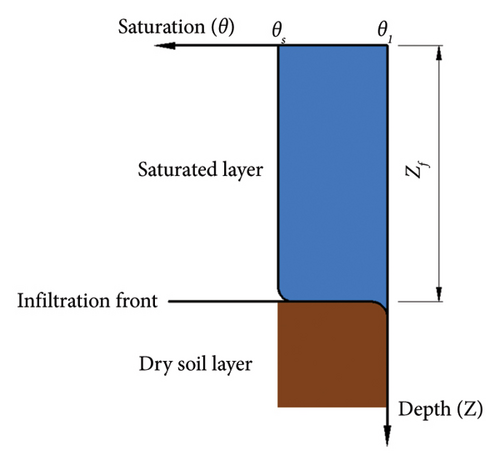
In 1911, Green and Ampt [23] proposed the traditional Green–Ampt infiltration model based on Darcy’s law through an infiltration test (Figure 1).
2.2. Modified Green–Ampt Infiltration Model
Generally speaking, Darcy’s law can be used to solve the seepage of saturated soil, without considering the complex matric suction problem. If the seepage problem of unsaturated soil needs to be solved, in most cases, the soil and water characteristic curve (SWCC) needs to be fitted to determine the seepage problem by fitting parameters, which is not suitable for the actual infiltration process [24]. In view of this, the Green–Ampt infiltration model is modified to be suitable for unsaturated soil areas.
As loess in Northwest China is also a kind of unsaturated soil, the gas in the void makes it difficult to completely saturate the water in the void during the infiltration process, and the slope seepage will also change due to slope inclination, so the traditional Green–Ampt model is modified as shown in Figure 2.
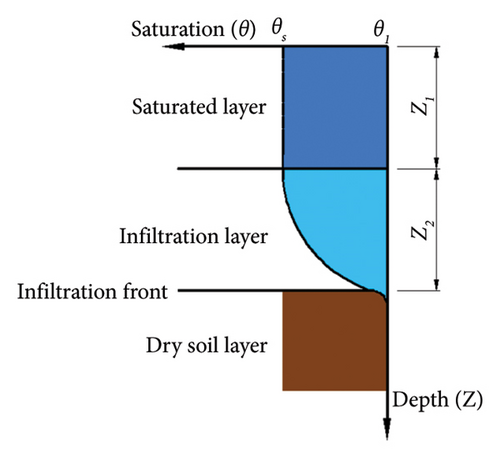
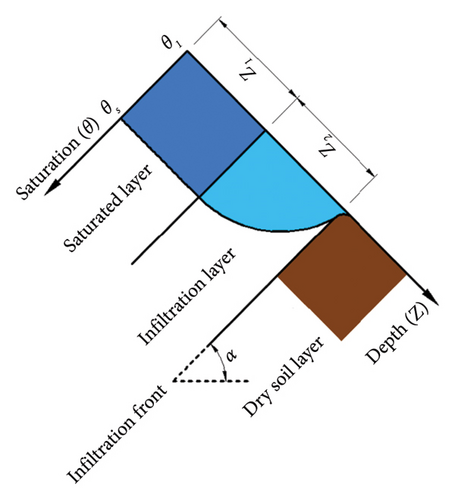
Equations (10) and (11) represent the seepage Green–Ampt infiltration model of unsaturated soil modified for the influence of slope dip on infiltration.
2.3. Generalized Seepage Force
In order to quantify the impact of rainfall infiltration on the unsaturated soil slope, the calculation model as shown in Figure 3 was established. Continuous rainfall was observed on the surface of the model, and the modified Green–Ampt model was used as the infiltration model.
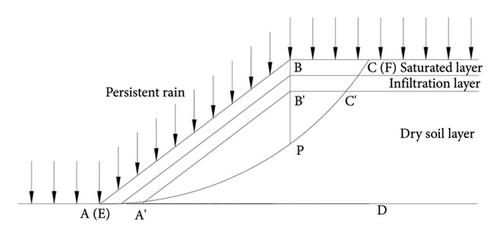
If the rainwater penetrates into the slope soil from the AB and BC surfaces and EF is the sliding crack surface, the deepest infiltration of rainwater will reach the boundary between the wetted layer and the dry soil layer, A′B′C′ surface, which is the wet front. The rainwater flows in the direction parallel to the wet front in the saturated and unsaturated layers and flows out at the foot of the slope only at the same level. The seepage in the model can be divided into two parts, one is perpendicular to the slope, and the other is the general seepage along the wet front. In this model, the general seepage is combined with the vertical seepage as a mixed seepage.
According to equations (15) and (16), the effect of rainfall infiltration can be quantified and acted on the slope, and then the seepage force can be substituted into the stability analysis for calculation.
3. Vertical Strip Division Method Considering Seepage Force and Supporting Force
3.1. Fundamental Assumption
- 1.
It is assumed that the slope soil mass is uniform, the slope top is smooth, the sliding surface is a circular arc, the radius is r, the center of the circle is above the slope, and the sliding surface passes the slope foot and extends to the top of the slope.
- 2.
It is assumed that the slope soil meets the Mohr–Coulomb yield criterion, and when the soil reaches the ultimate strength, the anchor solid also reaches the ultimate strength.
- 3.
It is assumed that when the slope soil is destroyed, the forces on both sides of the strip are equal, opposite in direction, and act on the same straight line, which can be ignored.
3.2. Stability Formula
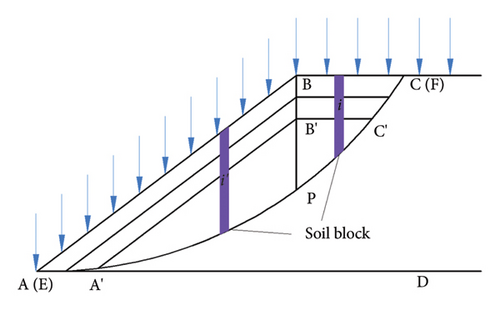
As shown in Figure 4, the overall slope is evenly divided into countless small blocks of width b, among which the arc-shaped triangle CBP has i bars, and the arc-side triangle ABP has i′ bars.
3.3. Solving Method
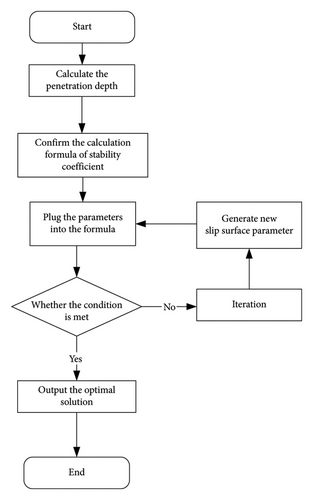
Since the calculation formula is implicit, it is necessary to solve the stability coefficient by iterative calculation, first through the Ferenius method to determine the center of the sliding surface, and then using MATLAB programming, through the substitution of parameters into the program, to solve the stability calculation formula (as shown in Figure 5).
4. Discussion
4.1. Project Case
In order to verify the correctness and accuracy of the formulas in this paper, an engineering example was selected for calculation. A project is a homogeneous loess slope with, slope height of 10 m, slope ratio of 1:1.5, soil cohesion c = 12 kPa, internal friction angle φ = 26°, soil weight γ = 18 kN/m3, initial water content of the soil is 9.55%, saturated water content is 49.8%, and saturation permeability coefficient is 1 × 10 − 6 m/s. The rain intensity was calculated to be 5.75 × 10 − 7 m/s, lasting for 3 days, and the composite soil nail wall was used to support the slope. The calculation diagram is shown in Figure 6.
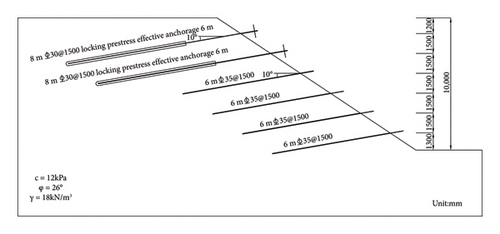
By referring to the data Table 1, the parameters ν1 and ν2 required by the Ferenius method are 26° and 35°, respectively, so as to determine the line where the center of the sliding surface is located and create countless centers on the line in order to search the most dangerous sliding surface.
| Ratio | Angle | ν1 | ν2 |
|---|---|---|---|
| 1:1 | 45° | 28° | 37° |
| 1:1.5 | 33.79° | 26° | 35° |
| 1:2 | 26.57° | 25° | 35° |
| 1:3 | 18.43° | 25° | 35° |
| Level | Interval rainfall | |
|---|---|---|
| 12 h rainfall (mm) | 24 h rainfall (mm) | |
| Microrainfall | < 0.1 | < 0.1 |
| Light rain | 0.1∼4.9 | 0.1∼9.9 |
| Moderate rain | 5.0∼14.9 | 10.0∼24.9 |
| Heavy rain | 15.0∼29.9 | 25.0∼49.9 |
| Intense rain | 30.0∼69.9 | 50.0∼99.9 |
| Rainstorm | 70.0∼139.9 | 100.0∼249.9 |
| Extraordinary rainstorm | ≥ 140.0 | ≥ 250 |
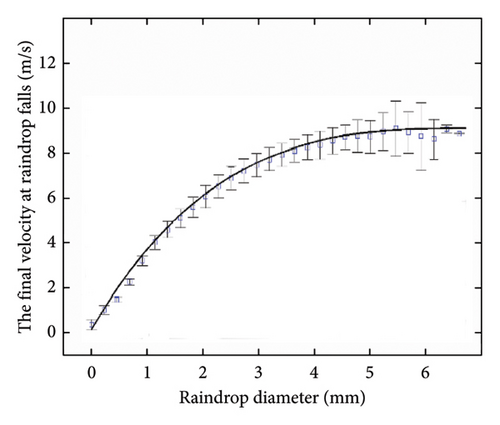
And according to the diameter of raindrops measured by the raindrop spectrometer in Figure 7 and the final velocity of raindrops falling to the ground, it can be seen that the final velocity of raindrops with a diameter of 4 mm is about 8.7 m/s. Thus, all the calculation parameters needed for this project have been obtained.
4.2. Numerical Simulation Analysis
In order to verify the correctness of the formula in this chapter, Seep/W module in GeoStudio series software is selected to simulate rainfall infiltration, then it is replaced by the Slope/W module to solve the overall stability coefficient of composite soil nailing wall support under the action of rainfall.
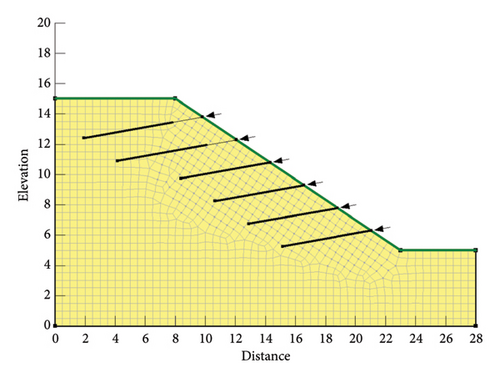
The seepage field model under rainfall was established according to Figure 6, and the model was divided into quadrilateral grids with a width of 0.5 m. The grid was changed from quadrilateral to triangle at the possible positions of potential fracture surfaces. The model had 1256 nodes and 1181 elements, and the calculation model as shown in Figure 8 was obtained.
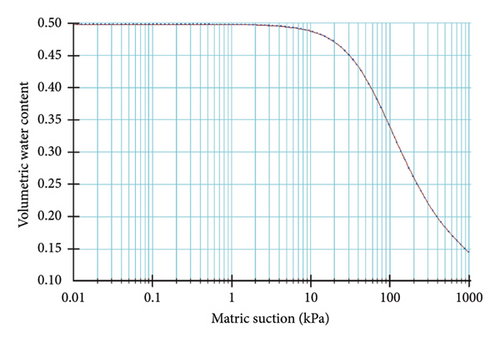
Using the Van Genuchten function, the SWCC and permeability coefficient curve of unsaturated loess in Figure 9 were fitted according to the initial water content, saturated water content, and saturated permeability coefficient of the soil.
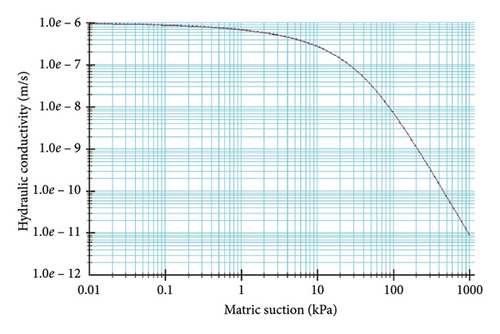
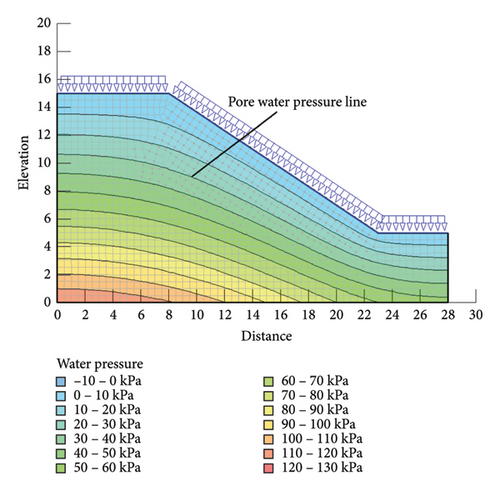
By substituting the water–soil characteristic curve and permeability coefficient curve of unsaturated loess into Seep/W, the slope was rained for 3 days, and the result as shown in Figure 10 was obtained through software iterative calculation. The distribution diagram of the pore water pressure line after 3 days of rainfall can be seen in the figure.
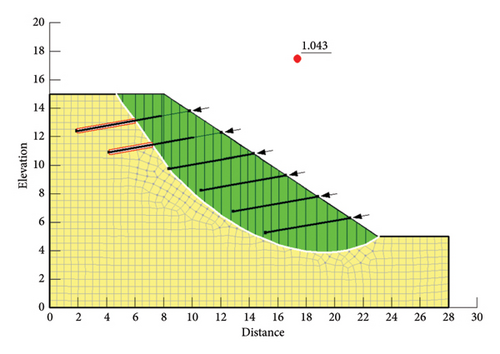
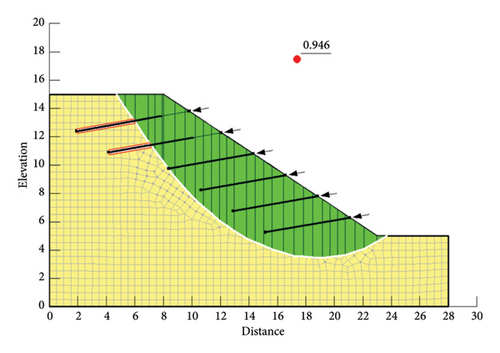
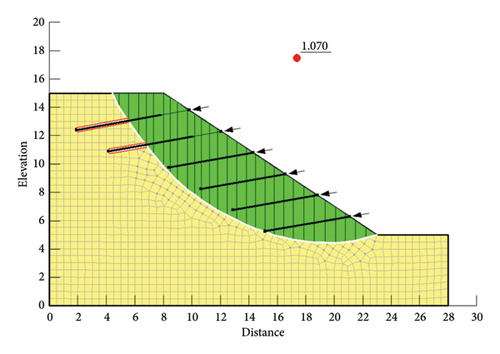
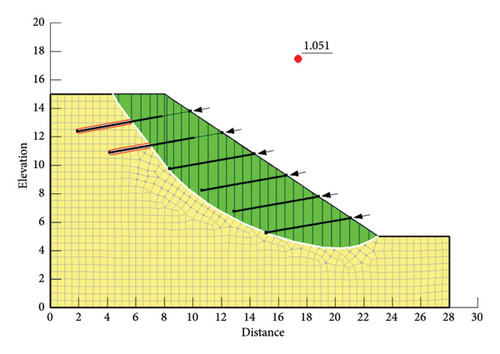
The results of rainfall infiltration were substituted into Slope/W to select the Bishop method, Janbu method, Spencer method, and Morgenstern–Price method, and the stability coefficient was recorded every 12 h, as shown in Figure 11 and Table 3.
| Time (h) | Bishop method | Janbu method | Spencer method | M-P method |
|---|---|---|---|---|
| 0 | 1.633 | 1.498 | 1.635 | 1.612 |
| 12 | 1.527 | 1.402 | 1.515 | 1.524 |
| 24 | 1.443 | 1.321 | 1.441 | 1.437 |
| 36 | 1.312 | 1.238 | 1.354 | 1.327 |
| 48 | 1.208 | 1.136 | 1.260 | 1.239 |
| 60 | 1.117 | 1.049 | 1.165 | 1.148 |
| 72 | 1.043 | 0.946 | 1.070 | 1.051 |
It can be seen from Figure 11 that the stability coefficient of slope supported by composite soil nail wall calculated by numerical simulation before rainfall is 1.633 by the Bishop method, 1.498 by the Janbu method, 1.635 by the Spencer method, and 1.612 by the M-P method. After 3 days of rain, the stability coefficients of the composite soil nail wall retaining slope were 1.043 by the Bishop method, 0.946 by the Janbu method, 1.070 by the Spencer method, and 1.051 by the M-P method. The stability coefficient decreases significantly, but only the Janbu method is lower than the safety factor of 1.0, which indicates that the composite soil nail wall has a certain effect on the slope support in the action of rainfall.
4.3. The Formula of This Paper Is Calculated and Analyzed
By using MATLAB to program the calculation formula proposed (see Appendix A) and calculating this example, the final result Fs = 1.165 after 3 days of continuous rainfall is obtained. The variation of stability coefficient during rainfall and the comparison with numerical simulation are shown in Figure 12.
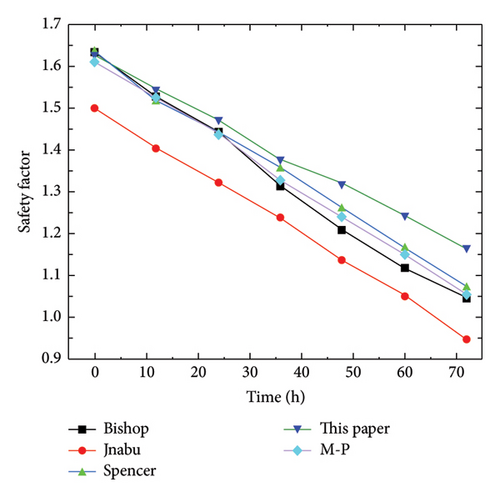
The results obtained by MATLAB when there is no rainfall are basically the same as the numerical simulation results, except for the large difference with the Janbu method because the Janbu method considers more internal forces and is more conservative. Compared with the results after 3 days of rain, the difference between the Spencer method and Janbu method was 0.095 and 0.219, respectively. Because the formula in this chapter is an improvement of Bishop’s method, the difference is 0.122 compared with Bishop’s method. The main reason for the error may be that the cohesion c and internal friction angle φ of unsaturated soil should be reduced under the action of rainfall. However, the formula in this chapter does not consider the weakening of cohesion and internal friction angle when calculating the action of rainfall. No matter how many days of rainfall, the initial value is still used. Although there are some errors, the difference is not large, which can still verify the effectiveness of the formula in this chapter and also provide a basis for slope support under the action of rainfall.
5. Conclusion
- 1.
The modified model divides the slope into the oblique regions and the vertical regions and considers the permeability characteristics of unsaturated loess and the composite soil nailing wall support well, leading to a more accurate description of the stability calculation method of unsaturated loess slope under the composite soil nailing wall support during rainfall.
- 2.
For the engineering example, the stability coefficient calculated by the method introduced is 1.165, while the safety factor obtained by the traditional Bishop method is 1.043, with a difference of 0.122. The results can not only verify the correctness of the calculation method in this paper but also reflect the weakening of the stability coefficient caused by rainfall, which makes the calculation more accurate under special conditions. The difference between the method in this paper and the numerical simulation results may be because the formula was derived without considering the weakening effect of rainfall on the soil parameters of unsaturated soil.
Conflicts of Interest
The author declares no conflicts of interest.
Funding
This study was supported by the Technology Project of Gansu Provincial Department of Housing and Urban-Rural Development Construction (Grant no. JK2022-03).
Appendix A: MATLAB Program
-
function[Fs, x3, y3, R1] = Fmin(b, h, gamma, pi0, c, J1, J2, T)
-
pi = 3.1415926;
-
Fs = 100.0;
-
bet = bet1∗pi/180.0;
-
F1 = 0; F2 = 0;
-
pi0 = pi0∗pi/180.0;
-
a = atan(b);
-
L = h/sin(a);
-
m = L∗cos(a);
-
x0 = m/2;
-
y0 = h/2;
-
for theta = 0:a/10:a
-
for L1=(0.25∗L):(L/10.0):(1.25∗L)
-
F1 = 0; F2 = 0;
-
x = x0-cos(pi/2-a + theta)∗L1;
-
y = y0+sin(pi/2-a+theta)∗L1;
-
R = sqrt(x^2 + y^2);
-
x1 = sqrt(R^2-(h-y)^2) + x;
-
L11 = x1/1000;
-
for x2 = 0:L11:x1
-
y2 = y-sqrt(R^2-(x2-x)^2);
-
be = atan((x2-x)/(y-y2));
-
n = L11/cos(be);
-
if x2 ≤ m
-
y3 = tan(a)∗x2;
-
h1 = abs(y3-y2);
-
W1 = gamma∗h1∗L11 + q∗L11+(J1+J2)∗sin(be) + T∗sin(bet);
-
F1=F1+(m/(m + x2))∗(W1∗tan(pi0)∗cos(be) + c∗n∗cos(be));
-
F2=F2+(m/(m + x2))∗(W1∗sin(be) + T∗cos(bet+be) + J1+J2);
-
else
-
h1 = abs(h-y2);
-
W1 = gamma∗h1∗L11 + q∗L11 + J1∗sin(be) + T∗sin(bet);
-
F1=F1+(x2/(m + x2))∗(W1∗tan(pi0)∗cos(be) + c∗n∗cos(be));
-
F2=F2+(x2/(m + x2))∗(W1∗sin(be) + T∗cos(bet+be) + J1);
-
end
-
Fs1 = F1/F2;
-
disp(Fs1)
-
if Fs1 < Fs
-
Fs = Fs1;
-
end
-
end
-
end
-
end
Open Research
Data Availability Statement
The data of monitoring in the article are not freely available due to legal concerns and commercial confidentiality. Nevertheless, all the concepts and procedures are explained in the presented research, and parts of the research may be available upon request.


