Seismic Performance Evaluation of High-Strength Steel EBFs, With 304L Steel Links Under Successive Earthquakes
Abstract
Successive earthquakes can bring about permanent displacements and a drop in frame resistance in subsequent cycles. Since a method for designing structures under these scenarios has barely been provided in the regulations, this paper examines the seismic performance of eccentrically braced frames (EBFs) in high-strength steel frames with stainless steel links under different seismic sequences. To this end, EBFs with a variety of materials were analyzed under 16 scenarios with and without a seismic sequence in the OpenSees software. Interstory drift ratio, energy loss by links, as well as moment curvature curves were further reported and compared in sensitive stories under single and consecutive earthquakes. The results indicated that employing stainless links could reduce the interstory drift ratio in the middle stories. Moreover, a small increase in drift ratio was observed in some high-strength steel EBFs, with stainless steel links frames after the successive shocks. Therefore, this type of frames experienced lower increase in energy dissipation after the successive shocks while this frame had more capacity of energy dissipation than other frames. The use of these frames will reduce the size of sections, lightening the system, and increase the capacity of energy loss, solving the risk of corrosion of the link beam.
1. Introduction
In recent years, eccentrically braced frame (EBF) has been proposed to improve the seismic performance of steel structures. In successive earthquakes, the link beams that dissipate the energy caused by the earthquake may fail; therefore, other members, including beams, columns, and braces will exhibit nonlinear behavior. Many studies have been conducted on the seismic performance of EBF. For instance, some researchers [1, 2] have investigated the seismic response of EBF under seismic sequences. Ruiz-García, Bojorquez, and Corona [1] examined the seismic behavior of two steel frames eccentrically braced on soft soil. They concluded that the structural damages caused by aftershocks, such as those that occurred on 19 and 20 September 1985 in Mexico City, were increased and excessive. Permanent displacement of structures was also noticeable under the strong aftershocks that occurred the following day. Mohsenian et al. [2] investigated the seismic behavior of EBF with vertical links under the main shocks and their sequence for buildings with 4, 8, and 12 stories; the energy dissipated by links was further reported. On the contrary, in some studies, the effect of sequence has been less considered.
The effect of near- and far-fault records in buildings equipped with EBFs [3] and the maximum energy dissipated in links under near- and far-fault records [4] were moreover evaluated. They also focused on the optimization of the maximum energy lost in links for structures with different heights. Mohsenian et al. [5] investigated the effect of EBF systems with vertical links on the seismic performance of bending frames. A number of studies, however, investigated the resistance of EBF under progressive collapse. For instance, Salmasi and Sheidaii [6] evaluated the performance of steel frames equipped with EBFs under sudden elimination of columns. Naji and Khodaverdi ZadehM [7] examined the behavior of braced frames with convergent and eccentrically braced ones under a progressive collapse scenario. The results indicated that EBFs met good resistance against progressive collapse. Some studies, furthermore, proposed a specific type of system to solve the problems of EBF. Among the problems of EBF is the replacement of links due to severe damage during an earthquake, which is a time-consuming and costly process.
Thus, Keivan and Zhang [8] investigated self-centering EBF under seismic excitations. Considering the problems in EBFs, Chen, Tremblay, and Tirca [9] proposed systems similar to connecting two trusses equipped with continuous links and compared their seismic behavior with EBFs. This new system could solve the problem of focusing the response of links in certain stories. Recently, the use of high-strength frames has been a method to reduce the weight of EBFs that will ensure the linear behavior of the out-of-link elements. In their study, Tian et al. [10] used high-strength steel (HSS) for beam and column members in the EBF equipped with K-shaped eccentric braces. They reported that as the peak ground acceleration increases, the deformation of link beams also increases. Ductility, stiffness, failure process, and energy dissipation in EBFs with vertical links were also considered by Wang et al. [11]. Duan and Su [12] studied the seismic behavior of high-strength eccentrically braced steel frames by evaluating their energy dissipation capacity and ductility and found that the force-bearing capacity and energy dissipation of the shear link sample were larger than the bending link sample. Li et al. [13, 14] further applied a new method as a substructure hybrid simulation test (SHST) to investigate the seismic performance of EBFs. In addition, to improve the performance of the link member, different designs have been made for the link beam with changes in the geometric shape, type of constituent material, manufacturing process, and type of connection. For instance, Askariani, Garivani, and Aghakouchak [15] designed a new type of long link beam using slit dampers that, unlike other long links, have high energy dissipation. Wen and Mahmoud [16] thoroughly investigated the behavior of these short shear links under a fully fixed low cycle fatigue criterion. Tan and Christopoulos [17] analyzed replaceable steel links made by the casting method to achieve the best design for the link beam. The behavior of braced frames equipped with eccentric braces and bending shear links was assessed by [18].
Due to the fact that the type of materials employed in the link beam can also affect its performance, Chacón, Vega, and Mirambell [19] studied short stainless steel links in the EBF and considered this type of link design as an appropriate alternative for replacing links after energy loss. Arrangement of beam and its connection to other components in the frame moreover affects its seismic performance. Mohammadrezapour and Danesh [20] investigated the performance of the joints of the columns connected and concluded that a link beam connected to the column has a greater elastic rotation capacity than the link between two braces. Additionally, Danesh and Mohammadrezapour [21] employed special connections to design the connection of the link to the column. The results indicated that these types of joints can achieve the desired rotation without losing resistance.
Based on the reviewed literature and the high damage potential of successive earthquakes proposed in a number of studies [22–29], the present study was conducted to investigate the seismic performance of HSS frames equipped with EBFs and stainless links in successive earthquakes, which has not been the focus of many studies. Moreover, owing to much of the literature, the effects of seismic sequence are limited for this type of frame, while in the case of successive earthquakes, permanent displacements in the frame can gradually reduce the frame resistance in subsequent earthquakes. Successive earthquakes occur in a short time interval relative to each other; and due to the difficulty and cost, repairing the link beam in this short interval is not feasible. To this end, investigating the seismic behavior of high-strength EBFs under seismic sequences as well as improving the performance of this system seems critical. This study further evaluated the performance of steel frames equipped with the EBF with different steel materials under single and consecutive earthquakes.
2. Materials and Methods
2.1. Design Method
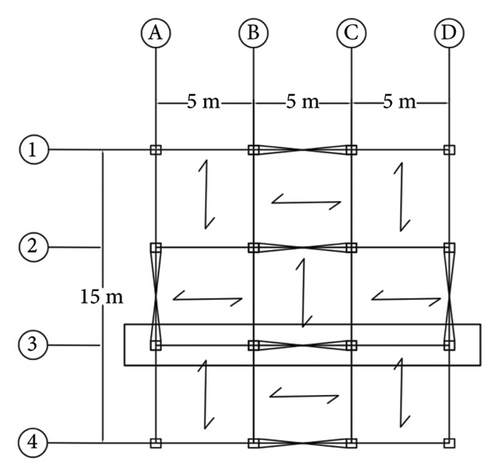
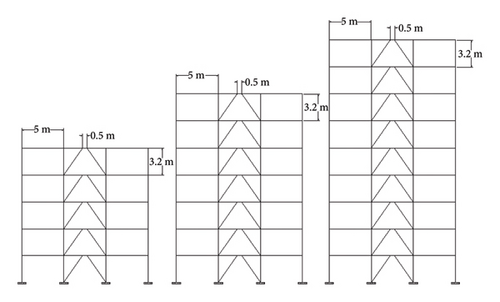
In this study, nine residential frames with five, seven, and nine stories and three different materials (including st37, st52, and steel 304L) were examined. These frames are located in Tehran, the capital of Iran, with Soil II. The plan (Figure 1(a)) and schematic view of the brace arrangements (Figure 1(b)) are shown in Figure 1. These frames were designed based on Standard 2800, fourth edition, considering the loading and specifications of steel, which are reported in Tables 1 and 2, respectively. As indicated in Table 2, three types of steel, including construction steel st37, HSS st52, and stainless steel 304L, were used in this study. The stainless steel 304L contains a high percentage of nickel and chromium and is resistant to heat and welding. Table 3 shows the cross sections of the frames under study.
| Position | Dead load | Live load | Snow load | Partitions load |
|---|---|---|---|---|
| Roof | 505 | 150 | 150 | |
| Middle bays | 505 | 200 | 100 | |
| Side bays | 530 | 500 |
| Sample | Links | Beams | Other section |
|---|---|---|---|
| CS | ST37 | ST37 | ST37 |
| SS | 304L | ST37 | ST37 |
| HSS | 304L | ST52 | ST37 |
| Level | EBF | Other bays |
|---|---|---|
| Columns (The dimensions of the boxes are in centimeters) | ||
| HSS5 | ||
| Other | Box 25 ∗ 1.5 | Box 25 ∗ 1.5 |
| 1 | Box 25 ∗ 1.5 | Box 25 ∗ 1.5 |
| HSS7 | ||
| Other | Box 25 ∗ 1.5 | Box 25 ∗ 1.5 |
| 1 and 2 | Box 30 ∗ 2 | Box 25 ∗ 1.5 |
| HSS9 | ||
| Other | Box 25 ∗ 1.5 | Box 25 ∗ 1.5 |
| 2.3.4 | Box 30 ∗ 2 | Box 25 ∗ 1.5 |
| 1 | Box 35 ∗ 2 | Box 25 ∗ 1.5 |
| CS7 | ||
| Other | Box 25 ∗ 1.5 | Box 25 ∗ 1.5 |
| 1, 2 | Box 30 ∗ 2 | Box 25 ∗ 1.5 |
| CS9 | ||
| Other | Box 25 ∗ 1.5 | Box 25 ∗ 1.5 |
| 1, 2, 3, 4 | Box 30 ∗ 2 | Box 25 ∗ 1.5 |
| SS7 | ||
| Other | Box 25 ∗ 1.5 | Box 25 ∗ 1.5 |
| 1, 2 | Box 30 ∗ 2 | Box 25 ∗ 1.5 |
| SS9 | ||
| Other | Box 25 ∗ 1.5 | Box 25 ∗ 1.5 |
| 2, 3, 4 | Box 30 ∗ 2 | Box 25 ∗ 1.5 |
| 1 | Box 35 ∗ 2 | Box 25 ∗ 1.5 |
| CS5, SS5 | ||
| All | Box 25 ∗ 1.5 | Box 25 ∗ 1.5 |
| Beams | ||
| CS5 | ||
| All | IPE 240 | IPE 240 |
| CS7, CS9 | ||
| All | IPE 220 | IPE 220 |
| SS5 | ||
| Other | IPE 220 | IPE 240 |
| 1 | IPE 220 | IPE 220 |
| HSS5 | ||
| 1 and 2 | IPE 240 | IPE 240 |
| 3 and 4 | IPE 240 | IPE 220 |
| 5 | IPE 220 | IPE 180 |
| HSS7 | ||
| 1 and 2 | IPE 240 | IPE 220 |
| 3 and 4 | IPE 220 | IPE 220 |
| Other | IPE 200 | IPE 200 |
| HSS9 | ||
| 1, 2, 3 | IPE 240 | IPE 220 |
| 4, 5, 6, 7 | IPE 220 | IPE 220 |
| 8, 9 | IPE 200 | IPE 200 |
| SS7 | ||
| 1, 2, 3, 4 | IPE 220 | IPE 220 |
| Other | IPE 200 | IPE 220 |
| SS9 | ||
| 1, 2, 3, 4, 5 | IPE 220 | IPE 220 |
| Other | IPE 200 | IPE 220 |
| Braces | ||
| All frames | ||
| All | 2UNP180 | |
2.2. Numerical Modeling
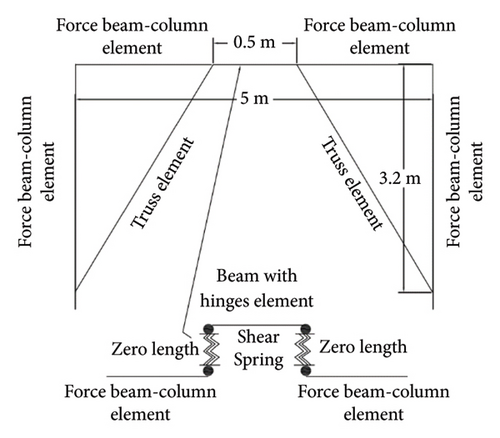
To implement the studied models in the OpenSees software, Steel02 and Ramberg–Osgood models [30–32] were selected for st37, st52 steel and 304 L steel, respectively. In this study, the properties of stainless steel (304 L steel) were also adopted from the study of Beaumont and Anna [31]. The steel specifications for the beams and columns (st37 and st52) are also shown in Table 4, which is taken into account in modeling with the OpenSees software. Force beam column element was also considered for the beam and column. The braces were modeled using truss element. Moreover, truss element, which was considered for braces, included hinged connection to braces. Two zero-length elements with parallel materials were employed to introduce the end elements of the link based on [3]. The middle element of the links was also implemented using the one with concentrated plasticity [33], and the length of the plastic joints in the Beam with Hinges Element command was found to be equal to zero. Figure 2 schematically shows the selected elements in one story of the examined frames.
| Fy (kgf/m2) | Fu (kgf/m2) | E (kgf/m2) | b | R0 | cR1 | cR2 | |
|---|---|---|---|---|---|---|---|
| ST37 | 2400 | 3700 | 2 × 10¹⁰ | 0.02 | 18.5 | 0.925 | 0.1 |
| ST52 | 3600 | 5200 | 2 × 10¹⁰ | 0.02 | 18.5 | 0.925 | 0.1 |
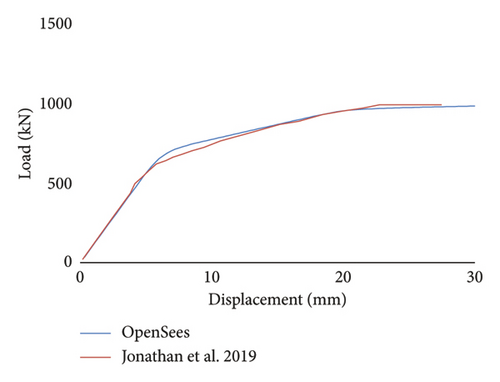
It should be noted that the examined frames were calibrated based on [34]. As illustrated in Figure 3, there is a good match for pushover curves of reference and implemented model.
2.3. Strong Ground Motions
Since the artificial simulation methods of seismic sequence may not have enough accuracy, consecutive earthquakes were evaluated in this study [24]. Table 5 shows the characteristics of 16 seismic scenarios. The earthquakes were selected from the PEER database based on the effective peak acceleration (EPA) parameter [24]. As suggested by Ghodrati Amiri and Manouchehri Dana in 2005 [35], these earthquakes were selected based on the parameter of maximum effective acceleration (EPA). For this purpose, various parameters were used as acceleration amplitude parameters. The parameter that has the best linear correlation using binary linear correlation statistical methods better represents the characteristics of the earthquake. Finally, the EPA parameter has been introduced as one of the most suitable parameters. However, contrary to the belief of most (Pick ground acceleration) PGA engineers, a suitable criterion for selecting a critical earthquake has not been identified.
| ID | Name | Date | M | EPA (g) | PGA (g) | Epicentral distance (km) | Station |
|---|---|---|---|---|---|---|---|
| 12 | Chalfant Valley3 | 7/20/1986 | 5.77 | 0.2451 | 0.2382 | 10.54 | CDMG 54428 Zack Brothers Ranch |
| 7/21/1986 | 6.19 | 0.4854 | 0.4246 | 14.33 | CDMG 54428 Zack Brothers Ranch | ||
| 14 | Coalinga | 7/22/1983 | 4.89 | 0.0993 | 0.1539 | 9.27 | CDMG 46617 Coalinga-14th & Elm (Old CHP) |
| 7/25/1983 | 5.21 | 0.3513 | 0.5813 | 9.57 | CDMG 46617 Coalinga-14th & Elm (Old CHP) | ||
| 20 | Mammoth4 | 5/27/1980 | 4.73 | 0.1722 | 0.2178 | 10.33 | USC 37 USC McGee Creek Inn |
| 5/31/1980 | 4.80 | 0.2767 | 0.3689 | 10.6 | USC 37 USC McGee Creek Inn | ||
| 21 | Mammoth5 | 5/25/1980 | 5.91 | 0.2726 | 0.3289 | 11.51 | CDMG 54214 Long Valley Dam (Upr L Abut) |
| 5/27/1980 | 5.94 | 0.4287 | 0.6293 | 14.04 | CDMG 54214 Long Valley Dam (Upr L Abut) | ||
| 22 | Mammoth6 | 5/26/1980 | 5.70 | 0.1117 | 0.0926 | 16.09 | CDMG 54214 Long Valley Dam (Upr L Abut) |
| 5/27/1980 | 5.94 | 0.4287 | 0.6293 | 14.04 | CDMG 54214 Long Valley Dam (Upr L Abut) | ||
| 35 | Chalfant Valley9 | 7/20/1986 | 5.77 | 0.088 | 0.1105 | 24.47 | CDMG 54171 Bishop-LADWP South St |
| 7/21/1986 | 6.19 | 0.2197 | 0.2058 | 20.27 | CDMG 54171 Bishop-LADWP South St | ||
| 44 | Livermore | 1/24/1980 | 5.80 | 0.086 | 0.1066 | 17.13 | CDMG 57187 San Ramon-Eastman Kodak |
| 1/27/1980 | 5.42 | 0.2119 | 0.1917 | 16.57 | CDMG 57187 San Ramon-Eastman Kodak | ||
| 45 | Mammoth1 | 5/25/1980 | 6.06 | 0.2387 | 0.2818 | 10.91 | CDMG 54301 Mammoth Lakes H. S. |
| 5/25/1980 | 5.69 | 0.4091 | 0.4143 | 13.49 | CDMG 54301 Mammoth Lakes H. S. | ||
| 46 | Mammoth2 | 5/25/1980 | 6.06 | 0.3443 | 0.4193 | 10.43 | CDMG 54099 Convict Creek |
| 5/25/1980 | 5.69 | 0.1563 | 0.1669 | 18.60 | CDMG 54099 Convict Creek | ||
| 51 | Mammoth7 | 5/25/1980 | 5.69 | 0.1563 | 0.1669 | 18.60 | CDMG 54099 Convict Creek |
| 5/25/1980 | 5.70 | 0.2618 | 0.4156 | 12.75 | CDMG 54099 Convict Creek | ||
| 53 | Mammoth9 | 5/25/1980 | 5.69 | 0.1563 | 0.1669 | 18.60 | CDMG 54099 Convict Creek |
| 5/27/1980 | 5.94 | 0.2207 | 0.3169 | 12.03 | CDMG 54099 Convict Creek | ||
| 54 | Mammoth10 | 5/25/1980 | 5.91 | 0.2041 | 0.2172 | 15.90 | CDMG 54099 Convict Creek |
| 5/25/1980 | 5.70 | 0.2618 | 0.4156 | 12.75 | CDMG 54099 Convict Creek | ||
| 56 | Mammoth12 | 5/25/1980 | 5.91 | 0.2041 | 0.2172 | 15.90 | CDMG 54099 Convict Creek |
| 5/27/1980 | 5.94 | 0.2207 | 0.3169 | 12.03 | CDMG 54099 Convict Creek | ||
| 61 | Mammoth17 | 5/25/1980 | 6.06 | 0.2635 | 0.3403 | 10.91 | CDMG 54214 Long Valley Dam (Upr L Abut) |
| 5/25/1980 | 5.91 | 0.2726 | 0.3289 | 11.51 | CDMG 54214 Long Valley Dam (Upr L Abut) | ||
| 64 | Mammoth20 | 5/25/1980 | 6.06 | 0.2635 | 0.3403 | 10.91 | CDMG 54214 Long Valley Dam (Upr L Abut) |
| 5/27/1980 | 5.94 | 0.4287 | 0.6293 | 14.04 | CDMG 54214 Long Valley Dam (Upr L Abut) | ||
| 65 | Mammoth21 | 5/25/1980 | 5.69 | 0.0884 | 0.1369 | 20.07 | CDMG 54214 Long Valley Dam (Upr L Abut) |
| 5/25/1980 | 5.91 | 0.2726 | 0.3289 | 11.51 | CDMG 54214 Long Valley Dam (Upr L Abut) | ||
2.4. Scaling Method
In order to perform the nonlinear dynamic analysis in OpenSees, the frames were first faced single records and then exposed to consecutive earthquakes consisting of two shocks, which were recorded with a time interval equal to 120 s based on [28]. The single records were scaled based on Standard 2800, while for the scale of successive shocks, the method presented by Abdollahzadeh, Mohammadgholipour, and Omranian [36] was used. In this method, a standard spectrum is generated for the scale of aftershocks, and the aftershocks will be scaled with a different scale factor than the first tremors. After establishing the gravity loads, time history analyses were performed to apply the earthquake records. The period of the studied frames is shown in Table 6.
| Frame | CS5 | CS7 | CS9 | SS5 | SS7 | SS9 | HSS5 | HSS7 | HSS9 |
|---|---|---|---|---|---|---|---|---|---|
| T (s) | 0.446 | 0.697 | 0.907 | 0.469 | 0.7 | 0.95 | 0.433 | 0.685 | 0.904 |
3. Results and Discussion
3.1. Interstory Drift Ratio
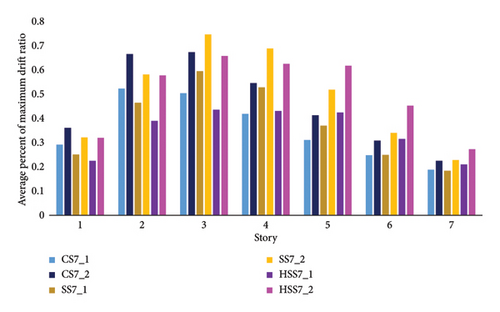
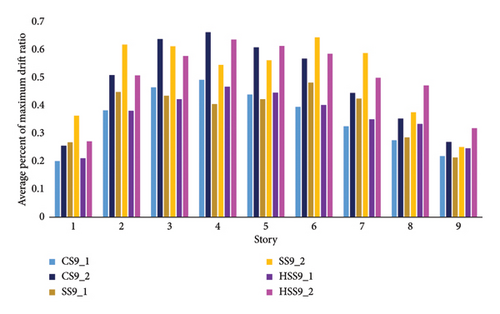
Interstory drift ratio is one of the most significant parameters in investigating the structural behavior under design loads, especially seismic scenarios, since it describes the behavior of all stories. Therefore, in the current study, the maximum interstory drift ratio under single and consecutive scenarios was reported in percentage. Figures 4, 5, and 6 indicate the average drift ratios of 5-, 7-, and 9-story frames (HSS, CS, and SS) under scenarios with and without seismic sequence. As shown in Figure 4, the drift of the CS5 frame increases under the successive earthquakes by about 44.6%, 52.1%, 61.3%, 43.3%, and 23% compared to the single earthquake on the first to fifth stories, respectively. Under successive earthquakes, the ratios from the first to second story increase by 53% on average, while the drift ratios from the second story onwards decrease by 14%, 41%, 43%, and 1%, respectively. Thus, the sensitivity of the second story compared to others under successive earthquakes was observed. Figure 4 illustrates the average percentage of the drift ratios under single and successive earthquakes for the SS5 frame. The drift ratios caused by consecutive earthquakes increase in all stories compared to the single earthquake. Therefore, a frame with a stainless link could also experience more drifts under successive seismic scenarios rather than a single seismic scenario. The values of the increased drift in successive earthquakes compared to the single earthquake are 49.3%, 59%, 57.6%, 39.25%, and 21% on the first to fifth stories, respectively. According to the results of the HSS5 frame in Figure 4, the percentage of drift ratios in the high-strength frame with stainless links also increase under successive earthquakes compared to the single shocks similar to the conventional frame. The seismic sequence phenomenon increases the drift ratios by 48.8%, 51%, 53%, 31.5%, and 25% on the first to fifth stories, respectively.

The sequence of earthquakes has a greater effect on increasing the drift ratio of the SS5 frame than that of the CS5 frame on the first and second stories. It is worth highlighting that the contribution of the first story is greater in increasing the ratios. On other stories, the increase in the drift ratios of the SS5 frame is less than the one in CS5 frame under successive shocks. The increase in the drift ratio of the HSS5 frame is reported only on the last story. It should be noted that the drift on the last story is less than other stories, which could be ignored. The increase in the drift ratio of the sensitive story of the HSS5 frame (second story) is less and has a more suitable performance. In the HSS5 frame, the drift ratios on the first and third stories are lower than that of the SS5 frame and higher than that of the CS5 frame. On the second story, the maximum of drift ratios is shown for the CS5 frame. Thus, the use of HSS and stainless link on the sensitive story (second story) is more effective and causes a 3.05% reduction in the average drift ratios of the conventional frame. Similarly, for the SS5 frame, it would be more sensible to employ this type of material (HSS and stainless steel) for short EBFs on sensitive stories under seismic scenarios. Compared to the HSS5 frame, the increase of drift ratios in the SS5 frame is larger on all stories, except for the last story; this can be caused by the increase in the strength of the conventional and out-of-link beams. To this end, to reduce the drift ratio in SS frames, high-strength materials can be applied in these beams. The maximum and minimum drift ratios of the HSS5 frame caused by single and successive earthquakes are lower than the CS5 frame and higher than the SS5 frame.
As shown in Figure 5, the lowest drift ratio percentage is reported for the first to third stories of the HSS7 frame under single and multiple earthquakes. The average drift ratios for the sensitive story (third story) are 0.43% and 0.65% for single and successive earthquakes, respectively. Moreover, maximum drift ratio of this story in the HSS7 frame decreases by 12% and 2.3% compared to the ones in SS7 and CS7 frames. Meanwhile, the maximum average drift ratio is reported for HSS7 and SS7 frames on the upper stories. To reduce the drift ratio of the upper stories, it seems that changing the materials for the upper stories was not effective enough.
As shown in Figure 6, the maximum drift ratio is shown in the third and fourth stories of these 9-story frames. For the fourth story (which is considered sensitive based on the drift ratio parameter), the minimum value of this parameter is respectively shown in SS9 and HSS9 frames under all seismic scenarios. The maximum drift, on average, decreases by 17.6% and 4% for the SS9 and HSS9 frames under consecutive earthquakes, respectively. This average is calculated for all stories of the frame. In the end, it seems the high-strength materials were effective on the second and third stories of the 9-story frames, whereas the sensitive story in the SS frame had a better performance.
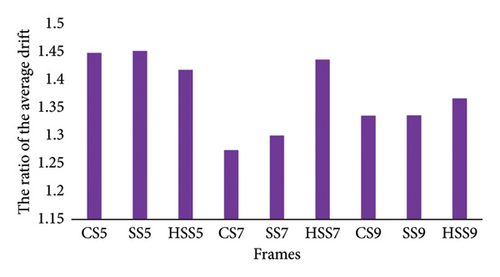
Figure 7 indicates the average percentage of the interstory drift ratio for single and successive earthquakes. (The drift for successive earthquakes /The drift for single earthquakes). The average drift ratio in all stories of the HSS5 frame, which is equal to 1.44, is lower than the other 5-story frames (1.48 and 1.49 for CS5 and SS5 frames) under successive earthquakes compared to those of single scenarios. Generally, the increase in the interstory drift ratio is 44% for the HSS5 frame under sequence of earthquakes. Changing the materials and increasing the height of SS and HSS frames caused the increase in this ratio by 2% and 13% for 7-story frames as well as 0.06% and 2% for 9-story frames, respectively. However, the ratio averages in the first to third stories for the SS7 frame are 1.5% and 14% lower than the ratio averages in CS5 and HSS5 frames, respectively.
3.2. Energy Loss in the Link
Since the link members dissipate the input energy of earthquakes, energy loss in the link of EBFs has been the focus of many studies. In the present study, the energy loss was calculated based on the absolute value of the area under the surface of strain stress or force displacement diagrams. The average energy loss of all links under single and consecutive earthquakes was also investigated and compared in this study. Tables 7 and 8 illustrate the energy loss of links under single and consecutive earthquakes as well as some statistical parameters of them, respectively. As shown in Tables 7 and 8, the amount of energy loss by links increases in consecutive earthquakes. In all frames, the amount of total energy loss by links in HSS frames is greater than the one in other frames in most single and consecutive cases; whereas, greater energy dissipation is associated with the SS7 frame in some records, such as single records with IDs 22, 35, 51, 53, and 54, rather than the HSS7 frame. This is also the case for the single record with ID14 among the 9-story frames, but after the seismic sequence, HSS frames still hold the maximum energy dissipation. The maximum energy loss in the links of HSS5 frame is 11,559.5 N.m in the single earthquake with ID64. This value reaches 258,571.3 N.m after a sequence of shocks. Similarly, the maximum energy loss in the links of HSS7 frame is 14,311.3 N.m in the single earthquake with ID35 and reaches 82,795.7 N.m after the sequence, while the maximum energy loss in 9-story frames under single earthquakes is shown for the SS9 frame and is equal to 94,025.2 N.m in the single record with ID64. As shown in Table 8, the maximum energy loss under the sequence earthquakes is shown for the HSS9 frame. According to Chacón, Vega, and Mirambell [19], in terms of energy loss, links of the SS frame are more effective than CS frame. The difference in the employed stainless steel materials was among the effective factors.
| CS5 | SS5 | HSS5 | CS7 | SS7 | HSS7 | CS9 | SS9 | HSS9 | |
|---|---|---|---|---|---|---|---|---|---|
| 12 | 47,768.92 | 41,930.17 | 52,014.42 | 35,170.83 | 41,481.52 | 44,254.79 | 40,721.65 | 39,668.57 | 45,890.31 |
| 14 | 3186.549 | 2967.276 | 3067.94 | 2208.311 | 2417.314 | 2267.753 | 4331.902 | 2468.082 | 2108.612 |
| 20 | 6340.805 | 5958.735 | 5604.652 | 4058.983 | 4556.915 | 4674.132 | 5739.542 | 5267.23 | 6009.749 |
| 21 | 75,890.61 | 66,928.25 | 83,490.08 | 45,183.29 | 48,470.85 | 56,342.45 | 34,691.98 | 38,569.55 | 39,859.48 |
| 22 | 24,644.46 | 20,932.81 | 144,177.1 | 2460.156 | 2766.267 | 2664.679 | 3637.547 | 6689.988 | 3979.15 |
| 35 | 4589.274 | 5475.535 | 5670.108 | 12,545.04 | 16,987.72 | 14,311.29 | 22,019.88 | 28,767.13 | 24,438.65 |
| 44 | 11,262.27 | 12,576.16 | 13,611.2 | 37,708.5 | 41,330.06 | 42,746.32 | 82,446.6 | 66,718.61 | 101,521.8 |
| 45 | 25,777.91 | 30,729.17 | 27,077.02 | 17,407.92 | 19,451.64 | 21,588.86 | 31,946.37 | 24,524.04 | 34,570.34 |
| 51 | 15,200.71 | 15,579.88 | 17,010.73 | 27,363.97 | 32,534.39 | 28,071.39 | 34,858.05 | 32,094.48 | 41,050.88 |
| 53 | 15,200.71 | 15,579.88 | 17,010.73 | 27,363.97 | 32,534.39 | 28,086.39 | 31,583.03 | 29,745.86 | 41,050.88 |
| 54 | 34,524.68 | 30,729.17 | 36,429.66 | 34,743.64 | 42,065.76 | 34,979.51 | 45,850.93 | 43,242.17 | 54,416.49 |
| 56 | 34,074.81 | 30,729.58 | 36,429.66 | 34,743.63 | 42,867.74 | 36,878.09 | 46,284.7 | 43,242.13 | 54,416.49 |
| 59 | 3987.467 | 3934.54 | 4172.057 | 5436.927 | 6510.975 | 6025.034 | 5534.19 | 5967.717 | 5877.878 |
| 61 | 102,904 | 84,672.66 | 108,522.6 | 91,148.43 | 95,725.36 | 116,485 | 68,588.84 | 94,025.19 | 81,615.59 |
| 64 | 106,640.6 | 85,708.57 | 111,559.5 | 45,193.56 | 48,459.36 | 56,363.2 | 69,546.41 | 63,400 | 82,795.72 |
| 65 | 9347.551 | 9913.32 | 10,720.69 | 11,511.7 | 12,606.9 | 13,553.74 | 5922.465 | 6068.366 | 6269.023 |
| CS5 | SS5 | HSS5 | CS7 | SS7 | HSS7 | CS9 | SS9 | HSS9 | |
|---|---|---|---|---|---|---|---|---|---|
| 12 | 188,868.5 | 41,933.07 | 207,744.1 | 185,902.2 | 195,617.9 | 225,555.7 | 223,914 | 199,294 | 262,625.5 |
| 14 | 20,722.91 | 19,271.8 | 21,794.56 | 24,390.25 | 25,639.83 | 29,245.34 | 23,777.93 | 25,212.52 | 26,344.04 |
| 20 | 15,366.08 | 14,992.32 | 16,305.76 | 10,383.53 | 12,383.15 | 13,033.67 | 13,455.92 | 11,646.56 | 14,101.71 |
| 21 | 200,975.1 | 176,121.7 | 138,490.4 | 77,224.01 | 81,669.65 | 90,611.1 | 82,523.36 | 83,479.3 | 92,401.85 |
| 22 | 151,776 | 133,656.2 | 173,623.6 | 99,179.09 | 106,918 | 133,514 | 87,581.17 | 146,167.3 | 106,091.5 |
| 35 | 33,982.89 | 36,428.49 | 40,155.72 | 77,866.65 | 82,407.36 | 91,215.77 | 84,743.58 | 85,380.57 | 94,447.11 |
| 44 | 42,307.98 | 43,480.59 | 54,055.61 | 77,610.08 | 84,674 | 95,581.62 | 120,175.4 | 97,381.75 | 152,265.4 |
| 45 | 51,890.37 | 48,850.81 | 57,909.4 | 48,170.1 | 48,862.33 | 60,193.89 | 63,720.9 | 53,197.72 | 71,346.18 |
| 51 | 32,457.82 | 33,178.79 | 35,947.12 | 46,415.08 | 54,704.44 | 53,555.08 | 63,841.97 | 53,618.56 | 73,182.33 |
| 53 | 44,890.94 | 46,687.19 | 55,723.05 | 64,324.61 | 75,104.68 | 69,776.77 | 70,545.98 | 63,340.05 | 86,118.23 |
| 54 | 52,133.73 | 48,821.05 | 56,118.97 | 54,008.43 | 65,572.92 | 67,175.79 | 73,174.96 | 62,717.58 | 87,087.53 |
| 56 | 62,182.85 | 58,797.95 | 72,674.87 | 70,656.13 | 84,286.94 | 78,684.42 | 82,850.71 | 73,932.52 | 101,938.1 |
| 59 | 34,596.59 | 37,608.29 | 42,466.85 | 43,510.06 | 49,670.42 | 47,700.7 | 44,472.37 | 41,347.11 | 53,457.3 |
| 61 | 182,791 | 142,384.7 | 194,822 | 132,600.5 | 142,097.5 | 177,730.1 | 98,056.48 | 94,156.92 | 118,900.5 |
| 64 | 172,337.8 | 193,848.7 | 258,571.3 | 129,088.3 | 197,792.4 | 248,503.4 | 143,830.9 | 2033.313 | 180,110.3 |
| 65 | 85,108.39 | 75,509.14 | 88,967.13 | 55,891.38 | 60,600.34 | 74,156.32 | 37,474.3 | 42,218.33 | 43,081.56 |
The most dissipated energy is for records 61 and 64, respectively, with PGA equal to 0.34 and 0.63 g for the second shock and 0.33 and 0.34 g for the first shocks. Therefore, there is no significant relationship between energy loss and PGA value. There is also no regular relationship between increasing the height of frames and the amount of energy loss under single records. Figure 8 shows the comparison of the average values of total energy loss by links in all records (single and consecutive). The maximum average energy loss among the frames under seismic sequence in the HSS9 frame is 97,718.7 N.m., and that under a single earthquake in the same frame is 139,116.94 N.m. As the number of stories increases, the average energy loss by links in HSS frames under seismic sequence increases. For single earthquakes, this increase occurred with the height of the SS frame as there was no regular increasing/decreasing trend in the amount of energy loss with the height in other frames. Compared to a single earthquake, the energy loss in successive scenarios in HSS, SS, and CS frames rises to 160%, 147%, and 162%, respectively. Therefore, an HSS frame experiences a lower increase in energy loss than other frames under seismic sequence compared to a single earthquake.
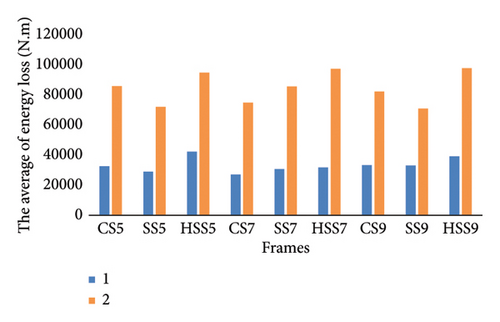
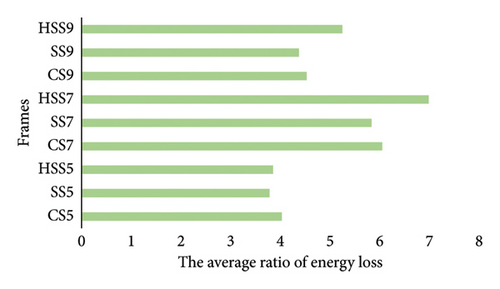
It should be noted that, considering the dispersion presented in Tables 7 and 8, the dispersion is greater in high-resistance frames. In Figure 8, CS5 and CS9 frames have the highest average energy dissipation value under single and consecutive earthquakes after HSS frames, whereas the SS7 frame has the highest energy dissipation value after the HSS7 frame. The energy loss values of links in HSS5, HSS7, and HSS9 frames under single earthquakes are 29.7%, 17.3%, and 17.26% larger than those in CS5, CS7, and CS9 frames, and 45.7%, 3.78%, and 18% larger than the ones in SS5, SS7, and SS9 frames, respectively. Moreover, the values of energy loss by the links in HSS frames under successive earthquakes are more than 10.4% and 31.6% for 5-story, 30% and 14% for 7-story, and 19% and 38% for 9-story frames compared to CS and SS5 frames. Figure 9 shows the average ratio of total energy loss caused by consecutive to single earthquakes. For successive scenarios, the energy loss by links is between 4 and 7 times of single earthquake. The maximum value of this ratio is 7 that is shown for the HSS7 frame, and the minimum value of this ratio is shown for the SS5 frame equal to 3.7. This parameter is 0.1 to 1 more than SS frames in all HSS frames. The energy loss ratios for 7-story frames are 81% and 30% higher than 5- and 9-story frames, respectively. The ratio of energy loss for the HSS5 frame is lower than those for HSS7 and HSS9 frames. Although this ratio becomes greater with the increase in the number of stories, this increase does not have a regular trend.
3.3. The Moment Curvature Curves
Figures 10, 11, and 12 indicate the moment curvature curves of each frame in sensitive stories under more effective records with and without seismic sequence phenomenon.
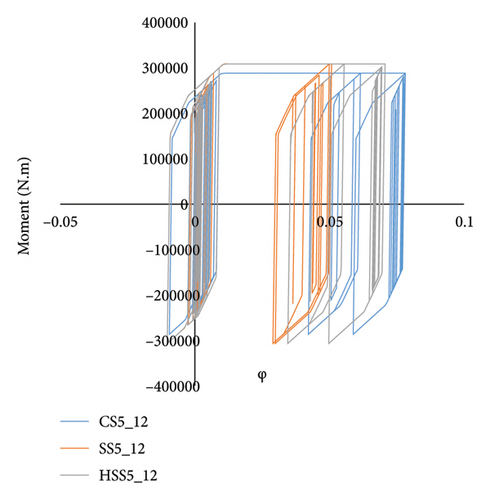
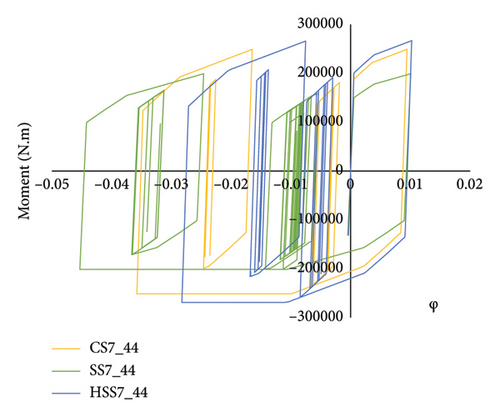
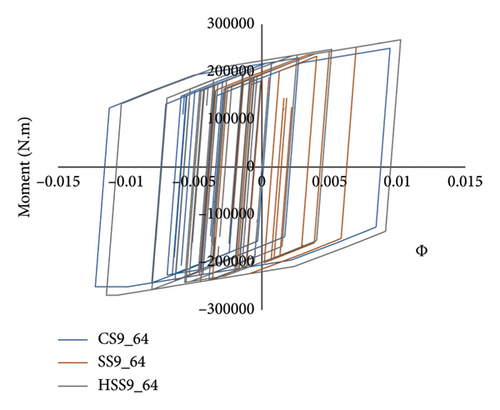
Figure 10 shows the moment curvature curves on the second stories of 5-story frames under successive record with ID 12. As shown in this figure, the most curvature occurred in CS5 and HSS5 frames. The maximum curvature in the link of these frames is equal to 0.0095. Therefore, the link in these frames had more ductility than that of the SS5 frame. Among these links, HSS5 links demonstrated the maximum resistance value equal to 308,998 N.m, whereas SS5 links showed a resistance close to the resistance of HSS5 links.
The moment curvature curves on the third stories of 7-story frames under successive record with ID 44 are shown in Figure 11. The maximum curvature and ductility among the links is shown for SS7 links, while it has the minimum resistance. The maximum curvature in the links of these frames is equal to 0.044. The maximum curvature in the link of the CS7 frame is equal to 0.035; and the maximum curvature in the HSS7 frame under this sequence is equal to 0.027. Among these links, those of the HSS7 frame still have the maximum resistance which is equal to 268,965 N.m.
The moment curvature curves on the fourth stories of 9-story frames under successive record with ID 64 are shown in Figure 12. According to Figure 12, links on the fourth story of HSS9 and CS9 frame hold the same curvature value as 5- and 7-story frames. The link curvature values in these frames are 0.001 and 0.0011, respectively. The strength of links in the HSS9 fame is 268,965 N.m. The links of the HSS frame with 5 and 9 stories have suitable performance in terms of curvature and ductility, similar to CS links in their sensitive stories except that their resistance is between 4% and 7% larger than CS links. It should be noted that using this type of links could eliminate the risk of corrosion, reduce the size of the beam sections, and make the system lighter. The links in the sensitive stories of 7-story frames had a different performance, so the links of the SS7 frame showed larger ductility while suffering a loss of strength. Besides, the curvature in the HSS7 link was less than the other two frames in this sensitive story. Finally, the CS7 link seems to have a better performance in terms of resistance and curvature in this story.
4. Conclusions
- •
The results indicated that the most effective record with seismic sequences was record with ID 12 in terms of the interstory drift ratio. However, among single earthquakes, record with ID 61 was more effective.
- •
Under sequence of earthquakes, the second story of the HSS5 frame had a less increased drift ratio and better performance. Some lower stories in HSS7 and HSS9 frames also showed a decrease in the maximum drift ratio compared to their equivalent frames.
- •
In all frames, the total amount of energy dissipated by links was greater in HSS frames under most single earthquakes and all successive scenarios than those in other frames. Moreover, an HSS frame required less average increase in energy loss compared to other frames under sequence rather than single earthquakes.
- •
The results further showed that there was no stable relationship between increasing the height of frames and the energy loss caused by single records; however, by increasing the number of stories, the average of energy loss by links in HSS frames under successive earthquakes increased.
- •
The energy loss by links was between 4 and 7 times its value compared to a single earthquake. The ratio of energy loss also augmented with the increase in the number of stories, but this increase did not gain a stable trend. Energy loss ratio in 7-story frames is more than 5- and 9-story frames.
- •
Generally, there was no significant relationship between the interstory drift ratio and energy loss with PGA parameter.
- •
HSS frame links had a similar behavior as CS links in terms of curvature and ductility on their sensitive stories, except that their resistance was higher than CS links.
- •
The findings of this study revealed that the role of HSS frames under seismic sequence in energy loss was clear and significant. However, regarding the percentage of the interstory drift ratio, this type of frame outperformed in some particular stories. Therefore, the use of this methodology to design sensitive stories of ordinary frames under sequence of shocks could be suggested. Provided that the structure does not suffer from mass instability, it would be plausible to increase the strength of materials only on sensitive stories. In addition to using HSS frames reduced the size of cross sections of the out-of-link beams and the system weight. Thus, this system could be strengthened with further studies.
- •
To reduce the drift ratio in parts of EBFs to optimize and strengthen them, especially short frames up to 5 stories, this type of design (HSS) could be also applied in areas with high humidity since these types of links (stainless steel) are also resistant to corrosion.
- •
It should be mentioned that, in this study, there the behavior of the HSS7 frame was observed to be different, so it could be the focus of further investigations.
- •
The behavior of high-strength frames with stainless steel flexure and shear links under seismic sequence phenomenon is still vague and needs to be studied more thoroughly. In addition, the effect of the site’s soil type, irregularity in the frame, the effect of the type of shape and location, and the number of bracing bays have yet to be examined under successive earthquakes.
Disclosure
An earlier version of this manuscript has been presented as a preprint in Research Square [37].
Conflicts of Interest
The authors declare no conflicts of interest.
Funding
The authors did not receive support from any organization for the submitted work.
Open Research
Data Availability Statement
The data that support the findings of this study are available from the corresponding author upon reasonable request.


