Seismic Fragility Assessment of Steel Rigid-Frame Bridges Exposed to Marine Corrosion
Abstract
Corrosion is one of the main concerns in different industrial sectors, leading to millions of dollars lost every year worldwide. Hence, the study of deterioration due to corrosion and its effects on the seismic performance of steel structures, especially those located in corrosive regions, is essential. In the present study, the influence of marine corrosion has been considered to reduce the section area of the bridge’s immersion piers using Melchers’s corrosion model. Several models of corroded steel rigid-frame (CSRF) bridges have been made, and nonlinear static analysis (pushover) and nonlinear incremental dynamic analysis (IDA) have been done on corroded bridge models to estimate capacity loss and predict seismic fragility at certain times during their service life. To validate the nonlinear analysis method, the experimental and numerical results are compared. The analysis results indicate that the bridge’s capacity and energy dissipation under a corrosive environment have been considerably decreased, and the probability of collapse has increased. After 90 years of the structure’s service life, the results of the seismic evaluation of the behavior of steel bridges in severe corrosive environments show that the bridge’s base shear has decreased by 33%, and the probability of collapse has increased by 15%. Based on the results of this study, some recommendations and strategies have also been suggested for the seismic design of new bridges and the rehabilitation of existing bridges in corrosive areas.
1. Introduction
Bridges are considered national assets due to their structural delicacy and high-priced execution. Therefore, ensuring their long-term performance is inevitable. The corrosion in steel structures is one of the most severe environmental damages and has not received as much attention as that in concrete structures. On the contrary, studies have mainly focused on the effect of corrosion on steel plates or the bridge’s deck. However, the effect of corrosion on piers, which has a significant role in their seismic performance, is more imperative. Steel bridge corrosion is a significant concern in bridge engineering. Several studies have been conducted to investigate the corrosion behavior of bridge elements.
Previous research showed that corrosion can cause stress concentration, changes in geometric parameters, and a buildup of corrosion products, all of which can make steel members weaker and more likely to fracture, yield, or buckle. These parameters can affect the capacity of major resisting components [1]. Several studies have been done to shed light on the capacity estimation of corroded plates based on their remaining thickness [2–4]. Researchers have typically tried to study the corrosion effect on the steel-girder bridge and its aftermath. For instance, Kayser and Nowak [5] and Sugiomoto et al. [6] have pointed out that corrosion might trigger various damage modes like bending, shear, and bearing on these elements, which leads to a reduction in load-carrying capacity.
Nagata et al. [7] did a study to find out how steel bridge piers affected by corrosion-induced section loss respond to horizontal loads coming from both directions during earthquakes. This research primarily concentrated on understanding how steel bridge piers with corrosion-related damage behaved. The goal of the study was to understand how corrosion-damaged rectangular steel bridge piers behaved in a two-dimensional setting. This was done through both experimental research and analytical evaluations. The findings of this study showed that localized buckling occurred not only within the reinforced plates but also at the corners of the piers when corrosion was present, leading to a reduction in the overall structural strength. Appuhamy et al. [8] noted that although the corroded main steel girders have a proper behavior under severe ground motions, the structure may well sustain some loss due to its transverse elements′ damage. They also presented some equations to determine the percentage reduction in yield and ultimate strength capacities due to corrosion under earthquake loadings.
The serviceability and reliability of corroded steel decks on highway bridges have been studied by conducting finite strip analysis [9]. The results indicated a dramatic fall in the corroded steel bridge response. Despite the consideration of corrosion on bridge serviceability and capacity, their simultaneous exposure to corrosion and seismic loadings has been neglected [10].
To investigate the structural behavior under the corrosion, Secer and Uzun [11] considered both corrosion and lateral-torsional buckling in the structural analysis. Zhang et al. [12] did accelerated corrosion tests and lateral low-cyclic loading tests on steel frames in corrosive environments to find out how well they hold up in earthquakes. Melchers [13] provided a review of progress on realistic models for long-term corrosion. Zhou et al. [14] and Xia et al. [15] conducted a corrosion test of galvanized steel strands based on magnetic memory. El-Zohairy et al. [16] investigated the retrofitted performance of a steel-concrete composite continuous girder with an external prestressing tendon that had sustained damage from cyclic loads. These studies contribute to understanding the corrosion mechanisms and developing strategies to mitigate corrosion in steel bridges. The other research mentions the use of weathering steel and high-performance steel in the construction of steel bridges. These materials are specifically designed to resist corrosion and provide better performance in challenging environments [17, 18]. In 2021, Nuti et al. [19] conducted a comprehensive study addressing bridge pier corrosion in seismic regions. Through numerical analysis, they look at how corrosion affects the way piers work during earthquakes. They look at a variety of reinforcement configurations and corrosion scenarios, such as uniform and pitting corrosion, to find out how corrosion affects piers. The research aims to evaluate pier behavior under seismic loads, shedding light on corrosion’s repercussions.
In other research, Xia et al. [20] explored the impact of corrosion on reinforced concrete (RC) columns, with a particular focus on accelerated corrosion and its influence on load-bearing capacity. The study involved various experiments on diverse RC column types, altering factors such as the type of reinforcing steel, loading eccentricity, and corrosion levels. Load-displacement curves and deterioration curves were generated and compared to a mathematical model. The findings highlighted a substantial reduction in load-bearing capacity due to corrosion. The studies by Li et al. [21], Guo et al. [22], Cui et al. [23], and Li et al. [24] examined the deterioration and seismic response of RC bridge substructures in marine environments. The research looks at how corrosion starts and spreads, how different parts of RC columns act in marine conditions, and how different levels of ductility affect damage states. Kashani et al. [25] emphasize the assessment of the structural capacity of RC bridge piers that have been corroded. The authors highlight the importance of accurately assessing the capacity of corroded piers to ensure the safety and reliability of bridges. They discuss the various factors that contribute to the corrosion of RC piers, including environmental conditions and exposure to chloride ions. The authors also discuss the effects of corrosion on the mechanical properties of concrete and steel reinforcement, such as reduced strength and ductility. Ali et al. [26] use static analysis on a finite element model of a cable-stayed bridge with corroded cables to find out how live load intensity, cable loss, and corrosion affect the ultimate and fatigue demand capacity ratios of its cables. Li et al. [27] looked at the time-dependent seismic fragility analysis of a bridge pier suffering from scour and chloride ion corrosion. They established a comprehensive framework for assessing pier degradation over time and its seismic response. The study incorporated scour depth and corrosion degree effects into a 3D finite element model for dynamic analysis. Fragility analysis was employed to evaluate the likelihood of exceeding various damage states under seismic loads.
In the following, researchers [28–30] explored corrosion current density determination in chloride-induced corrosion within RC structures, emphasizing the significance of accurately accounting for the actual surface areas of anodic zones during these calculations. The studies also investigate the correlation between corrosion current density and the prediction of service life in such structures. Furthermore, the researchers offer valuable insights into the corrosion process, including its impact on mechanical properties such as corrosion-induced cracking and load-bearing capacity. In 2023, Zaghian et al. [31] investigated the structural performance of a deteriorating RC bridge pier subjected to staged corrosion, frost damage, and service load. The study offers a comprehensive analysis of a seven-column bent within a two-span slab on a prestressed girder bridge. Also, the study evaluates the progressive staged-damage model, simulating three stages of corrosion-induced deterioration. In recent studies, corrosion has been identified as providing critical challenges in bridge structural integrity and seismic resiliency. Nettis et al. [32] conducted an automated probabilistic fragility evaluation of the existing prestressed concrete (PC) girder bridges primarily due to traffic load variability and tendon corrosion. Similarly, Menga et al. [33] reviewed post-tensioned bridges, highlighting failure mechanisms associated with design flaws and chloride ingress. Their findings emphasize the need for improved inspection protocols and maintenance strategies. Pinto et al. [34] proposed a probability-based seismic vulnerability assessment framework for multispan RC highway bridges in aggressive environments, identifying elastomeric bearings to be highly vulnerable. Complementary to this, De Domenico et al. [35] proposed a fiber hinge model for corroded RC bridge piers, demonstrating significant reductions in seismic capacity. This has been exemplified through the case study of the Zappulla viaduct. Vishwanath et al. [36] investigated chloride-induced corrosion in RC bridge piers and pointed out that the early-age cracks accelerate degradation, with an increased risk of seismic fragility and failure with time. Zucca et al. [37] explored the influence of carbonation on the load-carrying capacity of the RC bridges, suggesting retrofitting solutions by numerical modeling and aligned with the Italian Design Code. For steel bridges, Simoncelli et al. [38] presented an assessment of aging railway infrastructures prone to corrosion phenomena using visual inspection and reliability analyses. Their study also derived fragility curves to correlate observed damage with safety domains. The undertaken studies represent the urgency of integrating state-of-the-art modeling with advanced probabilistic analyses and proactive maintenance strategies to mitigate corrosion risks and ensure the long-term safety of bridge systems.
Research up to now, related to the effects of corrosion, was generally limited to either studies concerning the piers from concrete bridges or the superstructure elements from steel ones. The effect of combined actions, such as corrosion and seismic hazards, was not emphasized for steel piers. Steel bridge piers are the fundamental elements in dissipating energy during earthquakes and carry a significant load directly related to the stability and safety of the overall structure. This research will try to fill this important gap by studying the combined effect of corrosion-induced degradation and seismic forces on steel bridge piers. It also investigates this complex interaction in order to improve understanding of the structural vulnerabilities and long-term performance of steel bridges under the dual environmental and seismic challenges with the aim of enabling more resilient design and maintenance strategies in bridge engineering.
For this purpose, the effect of corrosion on the seismic performance of the studied bridge was assessed through a nonlinear static (pushover) analysis. This method facilitated the estimation of the bridge’s strength and its reduction under corroded conditions. To evaluate the seismic response of the bridge under varying corrosion scenarios, a set of ground motion records reflecting the seismic hazard specific to the studied region was selected. Following the recommendations of Shome [39], an optimal range of 10 to 20 ground motion records was considered suitable for such assessments. Therefore, 15 pairs of horizontal ground motion records were carefully chosen from the PEER Ground Motion Database [40–45]. The selection process was informed by seismic hazard deaggregation analysis results for the studied area [46, 47], ensuring the records accurately represented the dominant seismic scenarios. To further investigate the effects of corrosion on the bridge’s seismic behavior, fragility curves were developed under corroded conditions.
2. Corrosion Model for Steel Piers
In the meantime, semiexperimental models have been proposed to consider the effects of water temperature, dissolved oxygen, and water velocity [50, 51]. In general, the validity of these relations is not guaranteed for predicting corrosion for longer-term data [52]. On the other hand, the models based on the empirical data can only be used for similar cases and, hence, are used less than the theoretical input. In this study, the Melchers [49, 52] corrosion model has been employed to investigate the corrosion effect, which is based on theoretical and experimental data and ensures the corrosion process continues for the long run. According to Figure 1, the first and second phases of this model are the aerobic ones, which are controlled when oxygen cannot reach the metal surface, and as a result, the corrosion process is stopped. However, in the third phase, the anaerobic one, conditions are provided for the growth of sulfate-reducing bacteria (SRB). Initially, the corrosion rate increases due to the growth of the bacteria. Then, when reaching the equilibrium, the corrosion process continues at a constant rate in the fourth phase. According to the fourth phase of the Melchers corrosion model, the corrosion depth in the tth year is expressed in equation (2), where rs is the corrosion rate, Cs is the initial corrosion rate, and T is the average seawater temperature. The present model is applicable to the study of steel structure corrosion in marine environments, such as the Persian Gulf. This phenomenological model considers environmental factors including water temperature, high salinity, and activity of SRB.
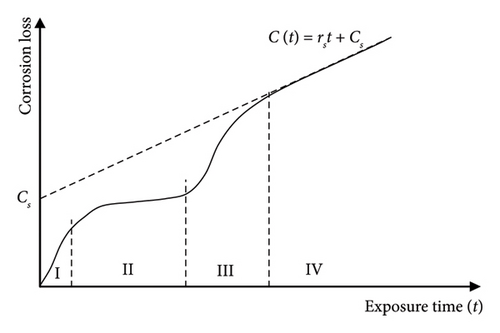
In this study, calculations were performed using the default parameter values of the Melchers model. However, these values are calculated based on the water temperature of the study area. In the study region, namely, the Persian Gulf, high temperatures, along with high salinity levels and anaerobic sediments, create an ideal environment for the effective activity of SRB, which accelerate corrosion. Therefore, the use of the Melchers model in the fourth stage is suitable and practical for this region.
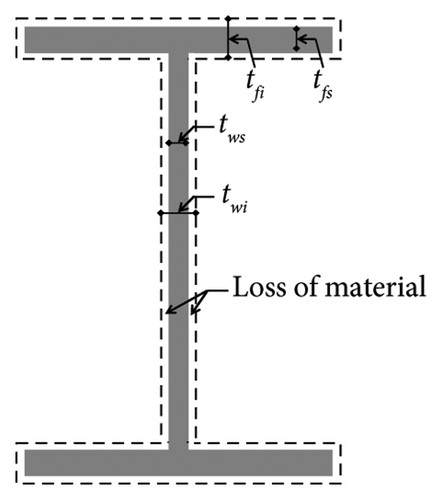
2.1. Comparison Between the Results of Corrosion Models
In order to evaluate the probabilistic model used, the results of applying the Melchers corrosion model [49, 52] to a section of the bridge pier have been compared with the results of the model obtained from the field measurements, which were taken from the offshore platforms in the study area and were measured for submerged members. The results for an intact section (without corrosion effect) with a flange thickness of 40 mm and a web thickness of 16 mm are presented in Table 1.
| Time (year) | Flange thickness (mm) | Web thickness (mm) | ||
|---|---|---|---|---|
| Corrosion model based on measured data | Melchers corrosion model | Corrosion model based on measured data | Melchers corrosion model | |
| 30 | 36.8 | 35.2 | 12.8 | 11.2 |
| 60 | 29.5 | 30.6 | 5.0 | 6.6 |
| 90 | 21.6 | 26.0 | 0.0 | 2.0 |
The general model presented in Figure 3 is based on the calculation of the average corrosion on 20 platforms, which is obtained by averaging the corrosion values at different levels of each platform [53, 54].
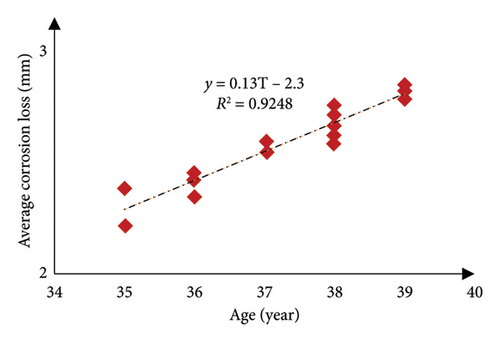
According to the results of Table 1 and Figure 3, it can be concluded that the results of applying the Melchers’s corrosion model [49, 52] (the model used in this study) and the corrosion model obtained from the data measured at the study site have an acceptable relative agreement.
3. Verification of the Pier Element
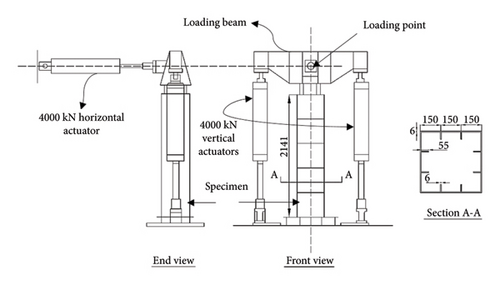
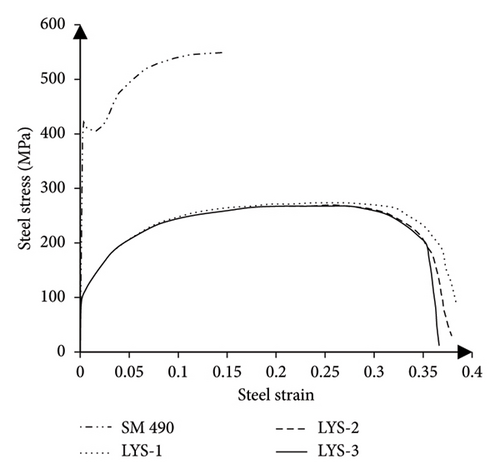
The load-displacement diagram of the case study bridge’s steel column from an experimental study is modeled in OpenSees software [55] to validate the nonlinear analysis method used in this study. The nonlinear analysis results are compared with the test data. At the Aichi Institute of Technology in Japan, Susantha et al. [56] subjected the box columns of a steel bridge on a shaking table to cyclic loading and plotted the load-displacement curves for several loading cycles. In this test, two vertical hydraulic jacks were used to apply the axial load, and the lateral loading was also done using a horizontal hydraulic jack. The bottom of the column was also fixed with a rigid base plate, and the top of the column was attached to the loading beam. The selected column specimen was made of SM490 steel, and the nonlinear properties of the steel materials were obtained according to the Japanese Industrial Standard in the material strength laboratory. The yield stress for SM490 steel is 425 MPa, the ultimate strength is 550 MPa, and the modulus of elasticity is assumed to be 200 GPa. Initially, an axial load equal to 0.2 times the yield axial load of the column was applied to the samples, which were then subjected to the cyclic loading. Figure 4 depicts the configuration of this experiment and the geometry of the selected specimen.
The nonlinear properties of steel materials have been introduced to the software using the stress-strain diagrams in the test report with the help of the Steel02 behavioral model [55]. As can be seen in Figure 5(b), this behavioral model has hardening, but the limitations of this model are not taken into account. There is no deterioration or loss of resistance in high deformations.
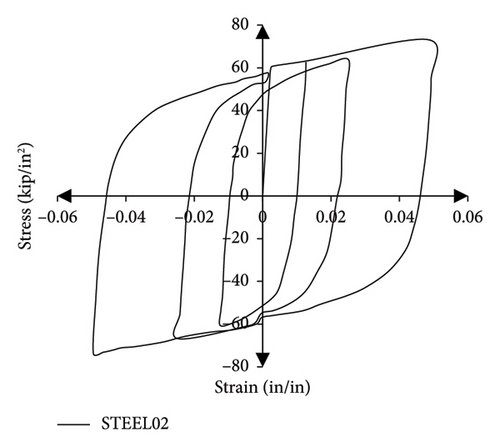
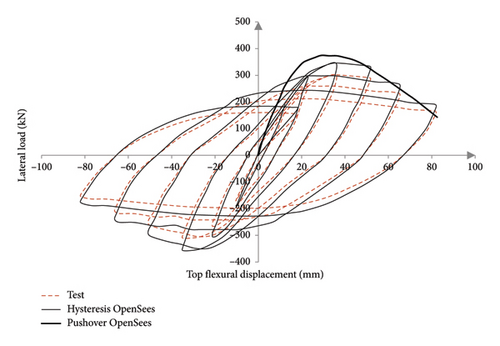
The nonlinear fiber displacement beam-column elements were used to model the bridge pier. The geometry of the sections and the boundary conditions of the model were also considered based on the existing report. Finally, to evaluate the accuracy of the nonlinear analysis method in OpenSees software, the pushover analysis using the displacement control method was frequently performed to plot the hysteretic curves for five cycles of loading. It should be noted that the lateral load is applied only to the highest point of the column, and the P-Δ effects are also considered in the analysis.
The load-displacement curves for both the numerical and experimental models are obtained. When we examine and compare the outcomes presented in Figure 6, we can observe that the numerical model has been validated, with a disparity of approximately 5% to 10%. Since the STEEL02 behavioral model does not capture the degradation caused by the cyclic loading and involves hardening, the experimental model and analytical modeling results have some discrepancies.
4. Bridge Description and Modeling
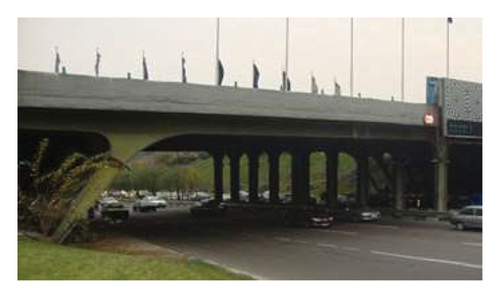
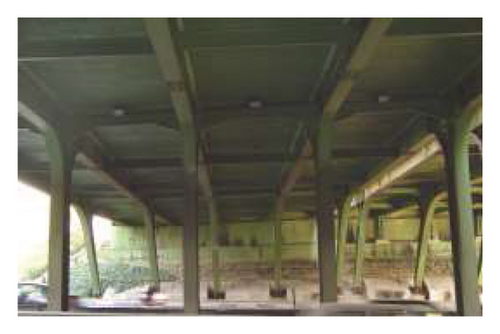
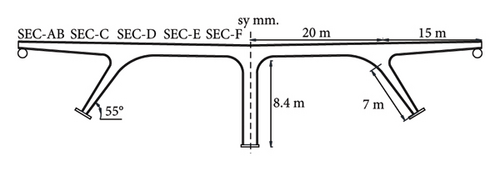
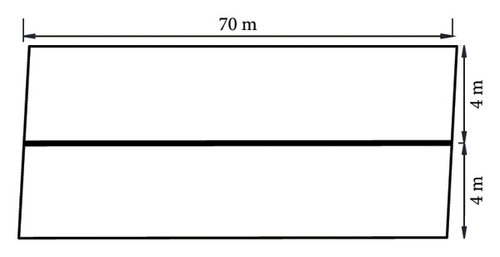
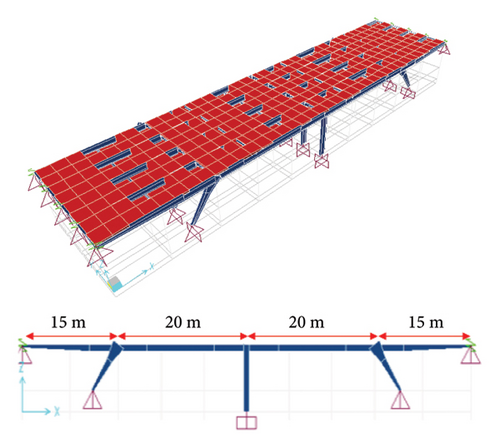
The bridge model in this study is a rigid-frame bridge in terms of its structural system, consisting of a steel structure, a steel-concrete deck, and four typical standard spans (Figure 7). It is assumed to be located in the southern region of Iran, where corrosive environmental conditions prevail (CSRF bridge). The bridge deck includes five rows of steel girders that are continuous along the span, spaced 4 m apart. The girders in the two end spans have a variable I-shaped cross-section, with the smallest thickness at the abutments and the largest thickness above the piers. In contrast, the girders in the two middle spans have a constant cross-section. The beams are supported by roller supports at the abutments. The two diagonal side piers have a variable I-shaped cross-section, with the smallest thickness in the supporting region. These piers are approximately 7 m long and form a 55°C angle with the horizontal axis (Figure 7). The middle pier is vertical, 8.4 m long, and has a constant cross-section. All piers are continuously connected to the foundation and integrated with the beams at their junctions. The detailed dimensions and variations of the bridge components are summarized in Table 2, including parameters such as outside height (d), top flange width (bf), web thickness (tw), top flange thickness (tft), and bottom flange thickness (tfb).
| Bridge component | Initial cross-section | Final cross-section | Member length (m) | Type of section variation | Dimensions (m) | ||||
|---|---|---|---|---|---|---|---|---|---|
| d | bf | tw | tft | tfb | |||||
| SEC-AB | I-shaped | I-shaped | 10.5 | Linear | 0.4⟶0.9 | 0.4 | 0.01 | 0.3 | 0.05 |
| SEC-C | I-shaped | I-shaped | 9 | Constant | 0.9 | 0.4 | 0.01 | 0.04 | 0.04 |
| SEC-D & SEC-F | I-shaped | I-shaped | 5 | Constant | 0.9 | 0.4 | 0.01 | 0.04 | 0.04 |
| SEC-E | I-shaped | I-shaped | 10.5 | Constant | 0.9 | 0.4 | 0.01 | 0.3 | 0.04 |
| Inclined piers | I-shaped | I-shaped | 7 | Linear | 0.4⟶1.9 | 0.4 | 0.016 | 0.04 | 0.04 |
| Vertical pier | I-shaped | I-shaped | 8.4 | Constant | 0.9 | 0.4 | 0.016 | 0.04 | 0.04 |
4.1. Numerical Modeling Details of the Studied Bridge
The details of the modeling in OpenSees are as follows: The girder and pier elements were modeled using beam-column elements with a distributed plasticity formulation based on the displacement method. In order to increase the accuracy of the modeling, the piers were discretized into 0.5 m segments, while the girders were divided into 1 m segments. The Gauss–Lobatto integration method [55] was utilized for capturing nonlinear responses accurately. The deck was modeled using the ShellMITC4 element, which utilizes a bilinear isoparametric formulation with modified shear interpolation to improve thin-plate bending performance and allow the use of larger elements with a specified thickness. The deck thickness was set at 25 cm and divided into smaller elements to account for nonlinear material behavior. Transverse elements were modeled by using truss elements that connect longitudinal frames to each other in the transverse direction. Steel members were modeled by using the Steel02 material model with a yield stress of 240 MPa, 1% hardening, and parameters calibrated for cyclic behavior. The slab was modeled by using the ElasticIsotropic material.
4.1.1. Modal Validation: OpenSees vs SAP2000 (v24.1.0)
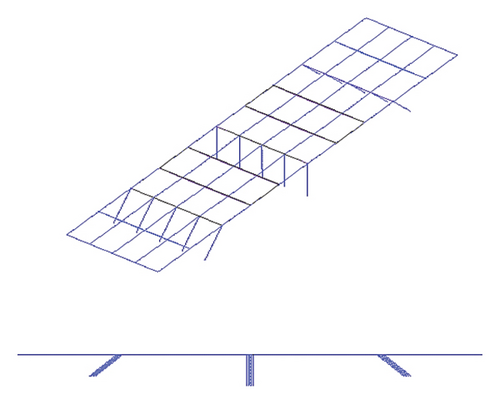
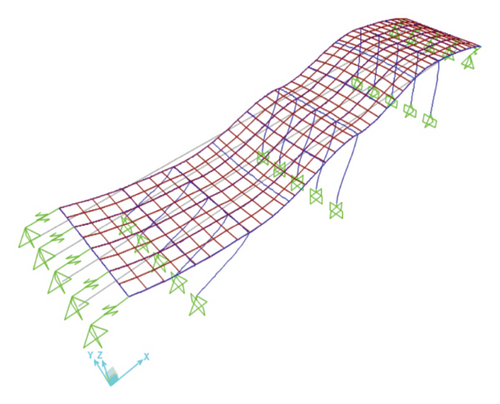
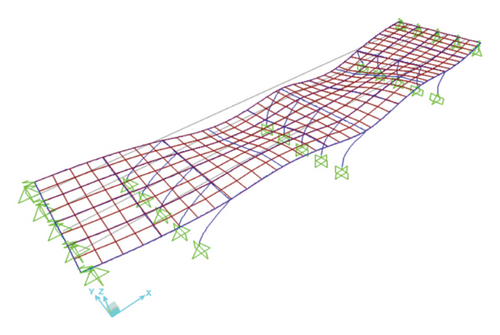
To validate the numerical model developed in OpenSees, a 3D model of the bridge was initially created in SAP2000. The modal properties obtained from the SAP2000 (v24.1.0) [57] model were used as a benchmark to verify the accuracy of the OpenSees model. Subsequently, a 3D model of the bridge was developed in OpenSees [55], as shown in Figure 8. The results of the modal analysis, shown in Table 3, highlight the dominant modes (Figure 9) of the bridge. The slight differences in modal results between SAP2000 and OpenSees can be attributed to their distinct modeling approaches. On the one hand, SAP2000 could model elements as nonprismatic sections directly; continuous and accurate representation of the stiffness and mass distribution can be allowed. On the other side, in the framework of the OpenSees model, nonprismatic elements have to be discretized into smaller prismatic ones. The process of approximation itself makes the model more complicated and, consequently, is expected to introduce slight discrepancies in the distribution of mass and stiffness. Consequently, variations in those may therefore reflect on the computed modal period. Besides that, the numerical algorithms employed by OpenSees, which often involve iterative procedures for convergence, may contribute to slight differences in the results.
| Dominant mode number | Direction | Free vibration period (sec) | |
|---|---|---|---|
| SAP2000 | OpenSees | ||
| 1 | Longitudinal | 0.42 | 0.49 |
| 3 | Transverse | 0.25 | 0.30 |
5. Seismic Performance of the CSRF Bridge
The seismic performance assessment of the CSRF bridge’s piers is divided into two main parts: investigating the bridge’s capacity under pushover analysis and evaluating the seismic fragility of the steel bridge at 30-year intervals throughout its service life. The steel bridge model consists of five frames, with the piers subjected to immersion corrosion. Previous research has shown that the effect of pier corrosion has a significant impact on the seismic performance of bridges. Therefore, the fragility of the corroded piers is assumed to evaluate the seismic performance of the bridge under corrosive conditions. The nonlinear static analysis (pushover) was performed for the two longitudinal and transverse directions of the bridge, considering four time intervals (0, 30, 60, and 90 years). Then, to estimate the seismic fragility, one of the moment-resisting frames of the bridge is modeled in OpenSees software, and a nonlinear incremental dynamic analysis (IDA) was conducted.
5.1. Nonlinear Static Analysis
To evaluate the capacity degradation of a CSRF bridge in southern Iran under corrosive conditions, the impact of corrosion on bridge piers, as critical structural members, was assessed under seismic loading at 30-year intervals throughout the bridge’s service life. Nonlinear static pushover analysis, utilizing the displacement-control method, was conducted in accordance with California bridge nonlinear analysis guidelines [58].
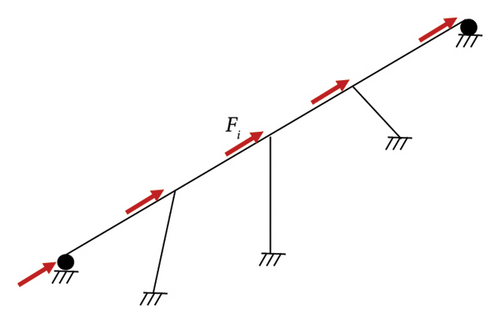
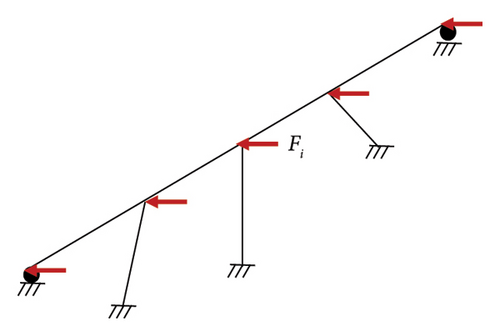
Static lateral loads were applied to specific points on the bridge deck, corresponding to the predominant modal behavior. The first mode was dominant in the longitudinal direction, and the third mode in the transverse direction. It was assumed that the mode shape remains unchanged after yielding, an assumption suitable for low-to mid-rise structures with distributed inelasticity. The load pattern, as shown in Figure 10, was applied incrementally to the middle frame of the bridge using a displacement-controlled approach.
5.1.1. Main Results of the Nonlinear Static Analysis
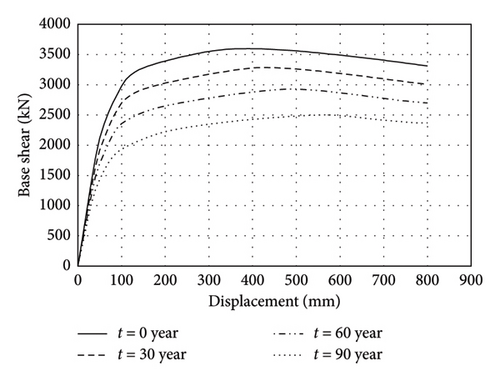
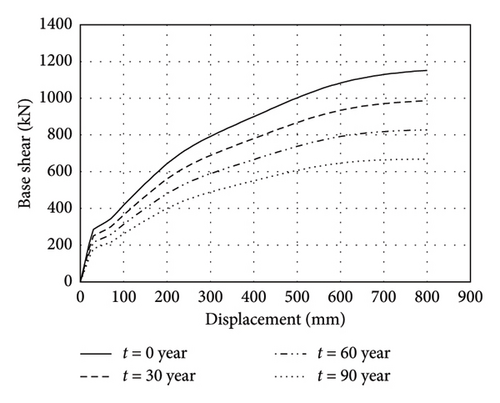
The capacity curves obtained from this analysis in both longitudinal and transverse directions are illustrated in Figure 11. The results show a decrease of 33% and 37% in the yield base shear of the bridge in the longitudinal and transverse directions in a corrosive environment for 90 years, respectively. The ascending trend of the capacity curve in the transverse direction represents the contribution of the deck stiffness to the overall transverse stiffness of the bridge. Therefore, to estimate the degradation in the load-bearing capacity of the corroded bridge pier, the shear corresponding to the yield displacement is computed and reported in Table 4 for the transverse and longitudinal directions.
| Time (year) | Longitudinal direction | Transverse direction | ||
|---|---|---|---|---|
| Yield base shear (kN) | Capacity reduction (%) | Yield base shear (kN) | Capacity reduction (%) | |
| 0 | 3111.1 | 0 | 286 | 0 |
| 30 | 2775.47 | 11 | 250 | 13 |
| 60 | 2444.83 | 21 | 215.5 | 25 |
| 90 | 2083.42 | 33 | 180.9 | 37 |
Also, to further understand the performance of the steel pier, the moment-curvature analysis for the middle bridge pier as a critical member is performed under the seismic load. The moment-curvature diagram of the selected steel section is shown in Figure 12 for the desired time intervals.
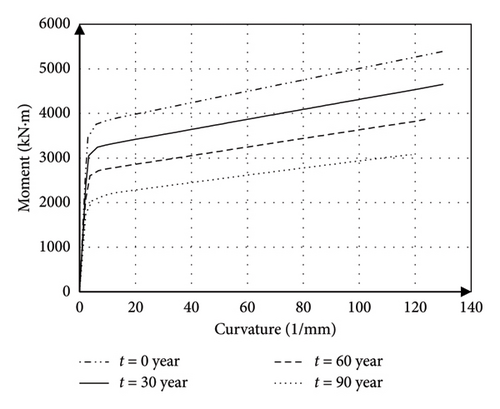
According to the results (Table 5), during 90 years, the yield and ultimate moments showed a decrease of 43% and 42%, respectively, while no significant changes were observed for the decrease in the yield and ultimate curvature. This can be attributed to the assumptions of this study, in which the mechanical degradation caused by the corrosion in the yield and ultimate strength of the used steel has been neglected.
| Time (year) | Yield curvature (1/mm) | Yield moment (kN·m) | Ultimate curvature (1/mm) | Ultimate moment (kN·m) |
|---|---|---|---|---|
| 0 | 3 | 3757.08 | 131.2 | 5404.63 |
| 30 | 2.8 | 3048.24 | 130.4 | 4682.89 |
| 60 | 2.4 | 2291.10 | 125.7 | 3883.45 |
| 90 | 2 | 1531.05 | 118.6 | 3072.85 |
For the moment-curvature curve, the energy per unit length of the column as measured by the area below the moment-curvature curve showed a 44% decrease, and the curvature ductility as a result of dividing the ultimate curvature by the yield curvature has shown an increase of 10% during the past 90 years. The results are shown in Figures 13(a) and 13(b). Also, according to the results obtained from the curvature analysis, the plastic rotation values have been calculated at each desired time point. The graph of the reduction of the capacity of the plastic rotation in terms of time is shown in Figure 13(c). Based on the obtained results, the capacity of the plastic rotation has decreased by 11% at the 90-year time point.
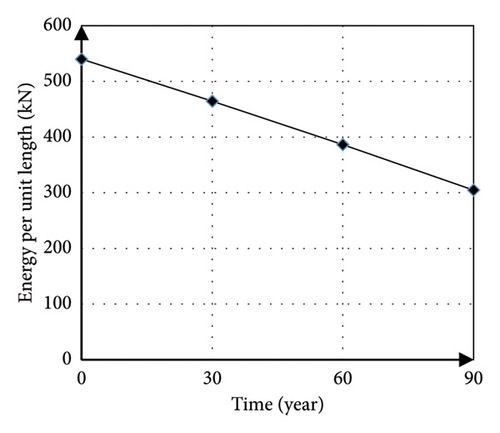
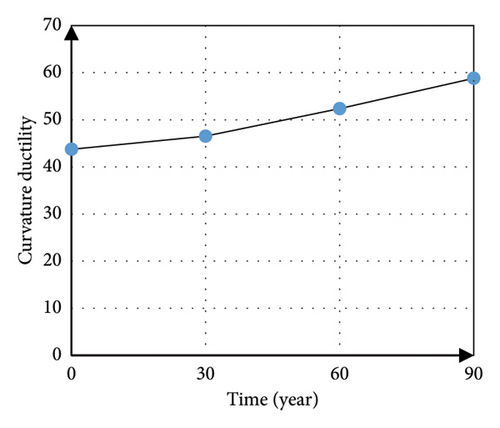
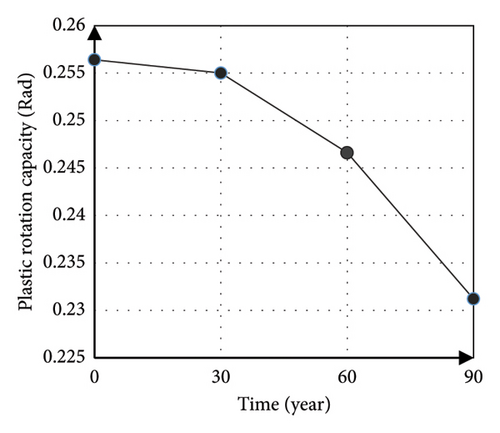
According to the pushover analysis results, to ensure the performance of steel structures in corrosive environments, the design base shear can be increased by an approximation proportional to the mentioned decrease. Since the nonlinear static analysis cannot represent the behavior of the structure under the seismic load due to this method’s limitations, it should be investigated through the nonlinear dynamic analysis to more accurately estimate the behavior of the structure. In this regard, to assess the decrease in seismic capacity, the fragility curves developed by the nonlinear IDA method are used.
5.2. Seismic Fragility Analysis
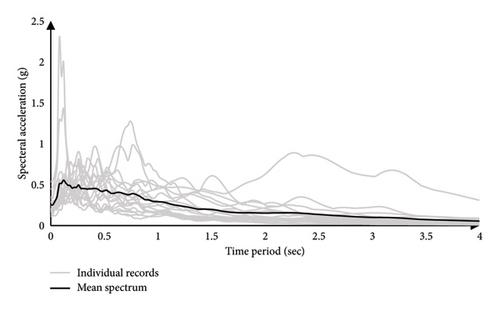
One of the appropriate intensity indices for quantifying the effects of earthquakes on bridges is first-mode spectral acceleration [59]. Therefore, the IM used for fragility analysis was calculated based on first-mode spectral acceleration Sa(T1). According to the experimental study mentioned in NIST GCR 10-917-8 [60], the collapse drift capacity of steel columns subjected to cyclic loads is considered to be around 7% [61, 62]. Thus, the ultimate limit state of steel section column drift was considered an engineering demand parameter (EDP). In this regard, the bridge’s middle frame, which is an appropriate representation of the bridge’s behavior in the longitudinal direction, was modeled in OpenSees, and IDA analyses were performed with 15 pairs of earthquake records (e.g., 30 horizontal components) (see Table 6) that are selected here from the PEER strong motion database [43–45] based on the seismic hazard deaggregation analysis in the studied region [46, 47]. The average value of the maximum peak ground acceleration of the two components is 0.41 g. For each earthquake, the SRSS of horizontal components was calculated, and then the mean SRSS spectrum of all ground motion records was obtained. The 5% damped elastic acceleration response spectrum of these records is shown in Figure 14.
| ID no. | Earthquake records | |||||
|---|---|---|---|---|---|---|
| Year | Name | M | Distance (km) | PGA (g) | Recording station | |
| 1 | 1979 | Imperial Valley | 6.5 | 12.69 | 0.23 | Parachute test site |
| 2 | 1994 | Northridge-01 | 6.7 | 8.5 | 0.73 | LA-Sepulveda VA |
| 3 | 1987 | Superstition Hills | 6.5 | 13.03 | 0.27 | Westmorland fire sta |
| 4 | 1999 | Kocaeli, Turkey | 7.5 | 19.3 | 0.31 | Yarimca |
| 5 | 1986 | N. Palm Springs | 6.1 | 10.08 | 0.25 | Palm Springs Airport |
| 6 | 1992 | Morgan Hill | 6.2 | 13.01 | 0.28 | Gilroy Array #3 |
| 7 | 1999 | Chi-Chi, Taiwan | 7.6 | 26.7 | 0.29 | TCU102 |
| 8 | 2007 | Chuetsu-Oki, Japan | 6.8 | 10.73 | 0.49 | Nakanoshima Nagaoka |
| 9 | 1981 | Corinth, Greece | 6.6 | 10.27 | 0.38 | Corinth |
| 10 | 1976 | Gazli, USSR | 6.8 | 12.8 | 0.71 | Karakyr |
| 11 | 1985 | Nahanni, Canada | 6.8 | 6.5 | 0.45 | Site 2 |
| 12 | 1989 | Loma Prieta | 6.9 | 10.27 | 0.37 | Girloy-Historic Bldg |
| 13 | 2008 | Iwate, Japan | 6.9 | 10.71 | 0.71 | MYG005 |
| 14 | 1995 | Kobe, Japan | 6.9 | 8.7 | 0.51 | Nishi-Akashi |
| 15 | 2004 | Parkfield-02, CA | 6 | 9.63 | 0.23 | PARKFIELD-UPSAR 01 |
5.2.1. Main Results of the Nonlinear Dynamic Analysis
The nonlinear IDA diagrams of the CSRF bridge in the southern regions of Iran, considering the effects of corrosion, are presented in Figure 15. Four original bridge models were analyzed at specific time intervals during their service life to evaluate the impact of corrosion under 15 pairs of earthquake records, applied at 25 levels of spectral acceleration. More than 3000 nonlinear time history analyses were performed using the Hunt-Fill algorithm [63]. The analysis begins with the application of the IM at a low level, which is incrementally increased until the structure surpasses the predefined collapse threshold. After identifying the initial collapse point, additional intermediate points are calculated within the middle third between the largest IM below the collapse threshold and the smallest IM at the collapse point. This refinement enhances the accuracy in determining the IM corresponding to the collapse state. The process is repeated iteratively until the desired level of precision is achieved. At each step, an ordered pair is generated, consisting of the IM Sa(T1) and the corresponding maximum drift capacity (collapse drift capacity). Connecting these ordered pairs produces the IDA curves shown in Figure 15. These curves represent the bridge’s performance at four distinct time intervals: T = 0 year, corresponding to the intact and undamaged bridge, and T = 30, 60, and 90 years, reflecting the bridge with section reduction due to 30, 60, and 90 years of service life under corrosion conditions, respectively.

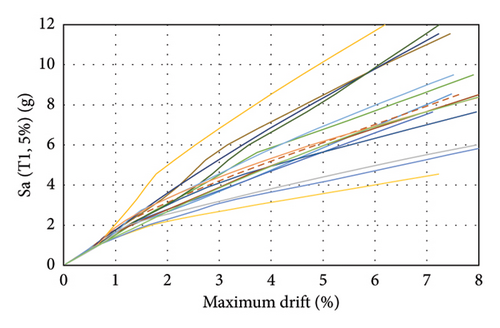
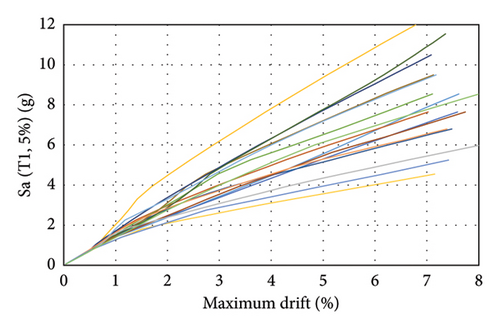
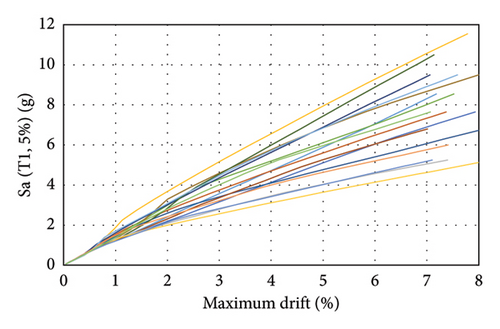
Also, in order to ensure the obtained results, four other bridge models with pier heights approximately 1.5 times that of the original bridge have been analyzed, considering the effect of corrosion under the same earthquake records. In the following, the term “assumed bridge” is used to present the results of these four new bridge models. Based on the IDA diagrams, the mean and standard deviation of the spectral acceleration required to reach the collapse state of the bridge at different time intervals are reported in Table 7, and the fragility curves for the 30-year time intervals of the bridge’s service life are plotted in Figure 16.
| Time (year) | Original bridge | Assumed bridge | ||
|---|---|---|---|---|
| μSa(g) | σSa | μSa(g) | σSa | |
| 0 | 2.11 | 0.297 | 2.18 | 0.151 |
| 30 | 2.06 | 0.290 | 2.15 | 0.153 |
| 60 | 1.98 | 0.269 | 2.10 | 0.153 |
| 90 | 1.92 | 0.256 | 2.06 | 0.161 |
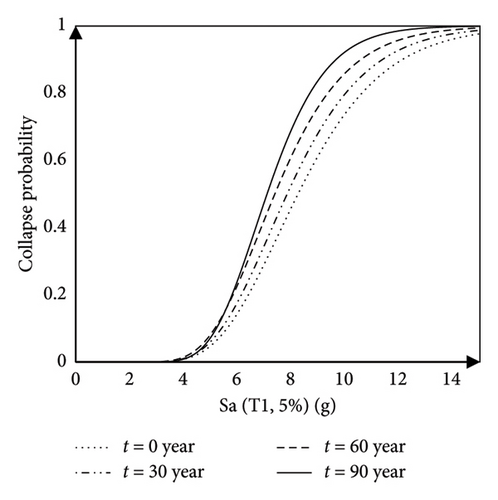
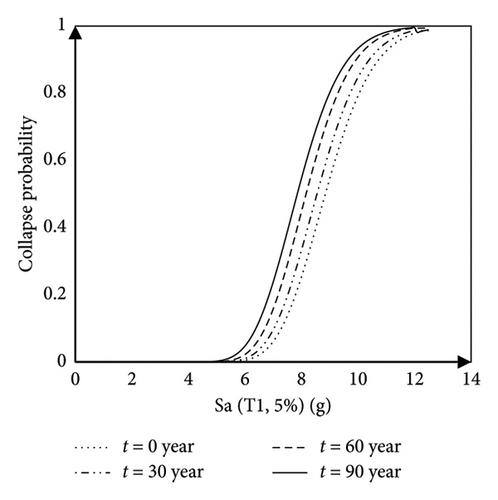
According to Table 7, the mean spectral acceleration required to cause specific damage to the bridge decreases over time due to corrosion. After 90 years, the mean spectral acceleration required to cause collapse for the original bridge and the assumed bridge has decreased by an average of 15% and 11%, respectively.
Based on the seismic fragility curves (Figure 16) developed for the steel bridge, it can be found that the probability of the collapse of the CSRF bridge increases over time due to corrosion. The bridge collapse capacity is considered to be the mean spectral acceleration corresponding to collapse derived from IDAs. By increasing the height of the bridge piers (Figure 16(b)), over time the collapse capacity of the bridge piers decreases as corrosion intensity increases. Based on the assumed model, the collapse capacity has increased by 3%, 4%, 6%, and 7% at intervals of 0, 30, 60, and 90 years, respectively. Piers are predicted to fail in a more ductile and flexural mode than the original model.
6. Conclusions
- •
The pushover analysis revealed that corrosion reduces the maximum base shear and increases the corresponding displacement. This highlights the significant effects of corrosion on bridge strength degradation, including a decrease in energy dissipation capacity over time.
- •
In the case of a 90-year period with 50% corrosion, the reduction in structural capacity was evident, with the capacity of the bridge decreasing by 33% in the longitudinal direction and 37% in the transverse direction, thus requiring the design base shear to be adjusted proportionally to these capacity reductions in order to maintain seismic performance in corrosive marine environments.
- •
According to the moment-curvature analysis, during 90 years, the yield and ultimate moments showed a decrease of 43% and 42%, respectively, while no significant changes were observed for the decrease in the yield and ultimate curvature. Additionally, energy per length of the bridge’s column was reduced owing to corrosion effects.
- •
Seismic fragility curves showed an increased probability of collapse over time due to 50% corrosion, with the average collapse capacity of the original bridge and the assumed bridge reduced by 15% and 11%, respectively, over 90 years. Also, the capacity reduction curves highlight the importance of rehabilitation timing, offering a method to estimate the optimal period for bridge rehabilitation based on the corrosion rate of the bridge piers.
In this study, results provide very useful information for the pushover analysis and moment-curvature analysis in assessing the vulnerability and finding the optimal timing for the maintenance of structures in corrosive environments, such as bridges in coastal and marine areas, using seismic fragility curves. The findings can be useful to make better decisions about the capacity reduction and rehabilitation scheduling.
These results are also limited by assuming the mechanical properties of steel materials to be constant because of a lack of field data. The corrosion effects were modeled only as a reduction in the cross-sectional area, excluding the degradation in mechanical properties such as yield strength and ultimate strength. Future research should be directed toward the development of more realistic corrosion models that take into account both the loss of cross-sectional area and the degradation of mechanical properties of steel. It is also very relevant for further research to consider corrosion rates for different environmental conditions, the randomness and nonuniformity of corrosion effects, especially in coastal environments, and the possibility of pitting corrosion. Additionally, the impact of corrosion on other critical bridge components, such as abutments and foundations, should be investigated to determine with greater precision its overall effect on structural performance.
Conflicts of Interest
The authors declare no conflicts of interest.
Funding
No funding was received for this research.
Open Research
Data Availability Statement
The data that support the findings of this study are available from the corresponding author upon reasonable request.


