Development and Validation of Simple and Convenient UV Spectrophotometric Methods of Trimetazidine in Five Different Solvent Systems
Abstract
Simple, rapid, and reproducible UV spectrophotometric methods were developed and validated for the estimation of trimetazidine hydrochloride in bulk and pharmaceutical formulation. Spectral scan was conducted in the UV-Vis range of 200–400 nm, and the quantification of trimetazidine was done at 230 nm in five distinct solvent systems. Phosphate buffer of pH 6.8, hydrochloric acid buffer of pH 2, a 50:50 mixture of phosphate buffer and methanol (50:50; v/v), a 50:50 mixture of hydrochloric acid buffer and methanol (50:50; v/v), and methanol were selected as solvent systems after completing the stability study for five consecutive days. Beer’s law was obeyed in the concentration range approximately 5–50 μg∙mL−1 (R2 = 0.997). All validation parameters like linearity, sensitivity, precision, accuracy, specificity, and robustness were tested according to ICH guidelines. The limits of detection and quantification were determined to be between 0.3 and 1.7 μg mL−1 and 1.12 and 3.70 μg∙mL−1, respectively. The aforementioned techniques were directly implemented in the analysis of the commercial pharmaceutical formulations. The results revealed that the approach is easily reproducible, accurate, and precise with a value of relative standard deviation < 2%, at the same time simple, economic, and less time-consuming. Therefore, these methods can be properly employed for quantification of trimetazidine in bulk and pharmaceutical dosage forms, and among five solvent systems, two solvent systems (phosphate buffer and hydrochloric acid buffer) can be used for dissolution experiments.
1. Introduction
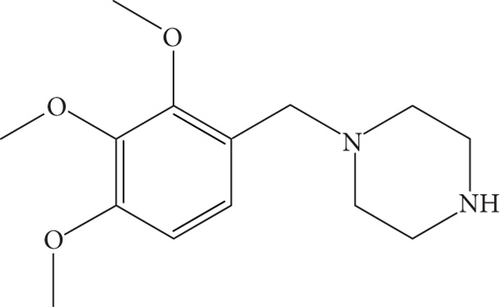
Trimetazidine (TMZ) is classified as an anti-ischemic medication primarily used in chest pain due to reduced blood flow to the heart, a condition called angina pectoris. Chemically, it is [1-(2,3,4-trimethoxybenzyl)-piperazine (Figure 1) [1]. TMZ acts at the cellular level by holding back mitochondrial long chain 3-ketoacyl-CoA thiolase (3-KAT), therebypromoting glucose oxidation instead of fatty acid oxidation for energy production. This change in oxidation pathway results in enhanced energy efficiency under ischemic condition as well as better preservation of cellular ATP level. It also reduces acidosis and improve overall cardiac function [2]. However, TMZ is categorized as “hormone and metabolic modulator” a group of medication with significant potential for misuse as a performance-enhancing substance in several sports. It is unlawful for athletesto use this drug. In 2014, the World Anti-Doping Agency (WADA) implemented a prohibition on the utilization of TMZ in all sporting activities [3].
In previously published research articles, different solvent systems have been used by several techniques like UV-Vis spectroscopy, HPLC, LC-MS, GC, and HPTLC for quantification of TMZ as shown in Table 1 [4–22].
| Methods | Wavelength/detector | Linearity range | Solvent medium | Reference no. |
|---|---|---|---|---|
| Spectrophotometric method | 415, 407 | 2.5–25 μg/mL | Acetate buffer; pH 3.5 and 2.5 | [4] |
| 249.5 nm | 40–200 μg/mL | MeOH | [5] | |
| 409 nm | 1–7 μg/mL | Phosphate buffer; pH 5 | [6] | |
| 627 nm | 30–65 μg/mL | MeOH | [7] | |
| Rp-HPLC method | 210 nm | 1–100 μg/mL | Phosphate buffer:MeOH:ACN | [8] |
| 274 nm | 20–120 μg/mL | Water:methanol:acetonitrile in the ratio 45:45:10 (v/v/v) (pH adjusted to 3.0 with orthophosphoric acid) | [9] | |
| 232 nm | 10–80 μg/mL | MeOH:0.05% HCOOH (90:10; v/v) | [10] | |
| 207 nm | 5–200 ng/mL | 0.01 M potassium dihydrogen phosphate buffer (pH 4.16 ± 0.01 adjusted with orthophosphoric acid): ACN (90:10) | [11] | |
| 232 nm | 5–90 μg/mL | DI water:methanol:triethylamine (75:25:0.1; v/v/v) | [12] | |
|
1.5 ng/mL | Acetonitrile:methanol:20 mM sodium acetate of pH 4.7 (44:6:50; v/v/v) | [13] | |
| LC-MS | MS/MS detection in positive ion mode. | 4–2000 ng/mL | Methanol and 0.1% acetic acid in 2 mM ammonium acetate (40:60; v/v) | [14] |
| Turbo ion spray, positive ion mode | 0.1–200 ng/mL | Water:acetonitrile:formic acid (50: 50: 0.1; v/v/v) | [15] | |
| Positive ion mode | 0.4–120 ng/mL | Methanol formic acid (0.05%) (80:20; v/v) | [16] | |
| Selected ion monitoring mode | 2.5–200 ng/mL | Methanol and water (40:60; v/v) adjusted to pH 2.0. | [17] | |
| HPTLC | 213 nm | 500–2500 ng/mL | n-butanol:water:methanol:ammonia (8.5:0.1:0.1:0.85, v/v/v/v) | [18] |
| 254 nm, densitometric scanner | 400–2400 ng/mL | n-butanol:water:methanol:ammonia (14:0.2:0.2:2; v/v/v/v) | [19] | |
| Gas chromatographic (GC) methods |
|
0.5–50 ng/mL | Helium gas at constant 18 psi | [20] |
| Flow injection analysis methods | 210 nm | 7.04 × 10 − 7 M. | Methanol:water (10:90; v/v) | [21] |
| Chemiluminescence method | — | 5–1000 ng/mL | Polyphosphoric acid | [22] |
Although advanced analytical techniques for determining the purity and potency of drugs offer a high level of specificity and accuracy, they require expensive equipment, which is beyond the means of many laboratories and small-scale companies. In this study, an endeavor was undertaken to create straightforward, accurate, and economic UV spectrophotometric techniques for quantitatively determining the amount of TMZ in its raw form as well as pharmaceutical preparations. As TMZ has two different pKa values, pKa1 = 4.45 ± 0.02 and pKa2 = 9.14 ± 0.02, it can be quantified in both acidic and basic media [1]. Extractability of TMZ varies with changing pH values. Five distinct solvent mediums were used to develop the methods to quantify TMZ in bulk and formulations. The findings of the analysis conducted using this method have been statistically evaluated and confirmed through recovery experiments.
2. Experimental
2.1. Instrumentation
The spectra for UV-Vis absorption were obtained using a Specord 250 plus PC double beam spectrophotometer (Analytik Jena, Germany) with 1.0 cm quartz cells. The weighing measurements were conducted using an electronic balance having the capacity to display weight up to four decimal places (252 g/0.1 mg) manufactured by A&D Company Ltd., based in the United States. The dissolution process was facilitated using a bath sonicator from Wisd Laboratory Instruments, Germany. The high-grade deionised water was acquired from the Millipore, Milli-Q water purification system, manufactured by Merck KGaA in Darmstadt, Germany, for the preparation of buffer solution. The glassware utilized in each step was completely cleaned with detergent, thoroughly rinsed with double-distilled water, and dried using a hot air oven. IR spectra were recorded using an FTIR spectrometer (PerkinElmer UATR Two).
2.2. Chemicals and Reagents
TMZ reference standard was acquired from Beximco Pharmaceuticals Ltd., Dhaka. Marketed TMZ 35 mg tablets of two different brands were purchased from a local drug store. Only analytical grade chemicals and reagents were used. Methanol, potassium dihydrogen phosphate (KH2PO4), and hydrochloric acid (HCl) were purchased from Active Fine Chemicals Ltd., Bangladesh.
2.3. Identification of TMZ Using Fourier Transmittance Infrared Spectroscopy (FTIR)
The test was run by placing a small quantity of TMZ reference standard and crushed and powdered tablets of a specific brand on the FTIR spectrometer disk (PerkinElmer UATR Two) and scanned within a wavelength of 4000–400 cm−1. Isopropyl alcohol was used to clean the FTIR disk to prevent contamination. The spectra obtained from the reference were then interpreted to establish it as a pure sample. The spectra obtained from the sample were compared to that of the pure sample.
2.4. Method Optimization
The wavelength for maximum absorbance (λmax) was obtained by running the UV spectral scan (200-400 nm) on a formerly prepared TMZ stock solution (≈50 μg/mL) in methanol. A stability study for a week has been conducted on eight different solvent systems, and five were selected for further study. Solvent A is monobasic potassium phosphate buffer of pH 6.8, Solvent B is HCl buffer of pH 2. The third solvent system is a 50:50 (v/v) mixture of Solvent A and methanol; the latter one is a 50:50 (v/v) mixture of solvent B and methanol, and the last one is methanol. Water and water: methanol in two different ratios (50:50; 70:30) were not selected as solvent systems due to slightly different spectral patterns. Solvent stability was determined by the relative standard deviation (%RSD) of the response of the drug at approximately 100 μg/mL concentration for five consecutive days in all five solvent systems. Validation of the suggested approach has been conducted according to ICH guidelines for linearity, sensitivity, accuracy, repeatability, intermediate precision, and specificity.
3. Preparation of Solutions
3.1. Preparation of Standard Stock Solutions
Five individual stock solutions of TMZ reference standard of 100 μg/mL were prepared by dissolving 35 mg of TMZ in 100 mL of methanol, Solvent A, Solvent B, Solvent A: MeOH (50:50; v/v) and Solvent B: MeOH (50:50; v/v).
3.2. Preparation of Sample
3.3. Buffer Preparation
A phosphate buffer solution was prepared by dissolving 6.805 g of potassium dihydrogen phosphate salt and 0.896 g of sodium hydroxide pellets in 900 mL of deionised water, and the volume was adjusted to 1000 mL by deionised water. The pH of the solution was modified to 6.8 using a weak solution of phosphoric acid if needed. The HCl buffer was prepared by combining 1.3557 mL of 35% HCl and 250 mL of 0.2 M KCl with 1000 mL of deionised water. The pH of the solution was modified to 2 using a weak solution of around 0.1 M potassium hydroxide (KOH) if necessary (USP 36).
3.4. Preparation of Placebo
The placebo combination was prepared by combining commonly used excipients in the appropriate proportions, as specified in Table 2. Stock solution of placebo was prepared by combining the average amount of excipient per tablet available in the commercial product with five different solvent mediums, resulting in a concentration of around 1.6 mg/mL. This solution was used for the specificity study of the developed method.
| Excipients (%) | Amount (mg) |
|---|---|
| Hydroxypropyl methylcellulose (30%) | 70 |
| Povidone K30 (5%) | 10 |
| Microcrystalline cellulose (25%) | 50 |
| Lactose (9.5%) | 19 |
| Magnesium stearate (3%) | 6 |
| Talc (5%) | 10 |
4. Method Validation
4.1. Linearity
The method’s linearity was determined by the linear regression equation using the TMZ calibration curve. A calibration curve was plotted by preparing eight distinct concentration levels in triplicate, spanning from 20% to 200% of the nominal concentration used in the experiment. A stock solution of the drug standard at a concentration of 0.35 mg/mL was prepared in each of the five solvent systems. After required dilution of the prepared stock solution a range of concentrations approximately 5.2–52.48 μg/mL were formed with respective solvent systems.
4.2. Sensitivity (Limit of Detection (LOD) and Limit of Quantitation (LOQ))
| Parameters | Solvent A | Solvent B | Solvent A: MeOH | Solvent B: MeOH | MeOH |
|---|---|---|---|---|---|
| λmax (nm) | 230 | 230 | 230 | 230 | 230 |
| Linearity (μg/mL) | 5–50 | 5–50 | 5–50 | 5–50 | 5–50 |
| Regression equation | y = 0.0249x − 0.0001 | y = 0.0281x + 0.0116 | y = 0.0269x + 0.0019 | y = 0.0249x + 0.0015 | y = 0.0269x + 0.0011 |
| Slope | 0.0249 | 0.0281 | 0.0256 | 0.0268 | 0.0269 |
| Intercept | −0.0001 | 0.0116 | 0.0039 | 0.0129 | 0.0019 |
| Correlation coefficient | 1 | 0.9995 | 0.9998 | 0.9992 | 0.9997 |
| LOD(μg∙mL−1) | 0.371 | 0.981 | 0.729 | 1.223 | 0.938 |
| LOQ(μg∙mL−1) | 1.125 | 2.975 | 2.211 | 3.706 | 2.844 |
4.3. Accuracy
5. Precision
5.1. Repeatability
The precision of the instrument was evaluated by measuring the %RSD of repeated scanning of TMZ standard samples (n = 6), while maintaining constant parameters of the proposed spectrophotometric method.
5.2. Intermediate Precision
5.3. Specificity and Selectivity
Specificity of the method was assessed by standard addition technique at varying concentrations of drug and excipients and by forced degradation study by thermal stress.
5.4. Forced Degradation Study by Thermal Stress
For thermal stress stability study, TMZ standard, sample, and excipient were kept in solid form in an air-tight glass container in a controlled temperature oven at 60° C for 5 days. Solutions were prepared by dissolving standard and sample in five different solvent systems and further diluted with respective solvents at two concentrations (approx. 21 μg/mL and 5.6 μg/mL). The excipient solution was prepared at the proportionate concentration found in the sample. The spectral scan was recorded at different time intervals up to 5 days.
5.5. Robustness
When subjected to minor changes in the system parameters typical in real-world situations, the ability of an analytical technique to remain stable refers to its robustness. In analytical chemistry, robustness testing ensures that small changes in factors like temperature, pH, or reagent concentration do not significantly impact the method’s outcome. During a robustness study, method parameters are varied intentionally to see if the method results are affected [23]. In this study, evaluation of the method’s robustness was conducted by altering the pH of the buffer solution.
6. Results and Discussion
A distinctive curve of TMZ is observed in all media when scanned within the ultraviolet wavelength range. The scans (Figure 2) reveal that all five solvent systems exhibit absorption maxima at 230 nm.

The aforementioned techniques have undergone validation for specificity, linearity, accuracy, repeatability, and intermediate precision. The linear methodology was determined to be applicable within the concentration range of around 5–50 μg/mL. The minimum concentration level at which TMZ can be reliably detected (LOD) and quantified (LOQ) was found to be 0.37 and 1.12 μg/mL for Solvent A, 0.98 and 2.97 μg/mL for Solvent B, 0.72 and 2.21 μg/mL for Solvent A: MeOH (50:50) solution, 1.22 and 3.70 μg/mL for Solvent B: MeOH (50:50) solution, and lastly 0.93 and 2.84 μg/mL for MeOH, respectively (Table 3).
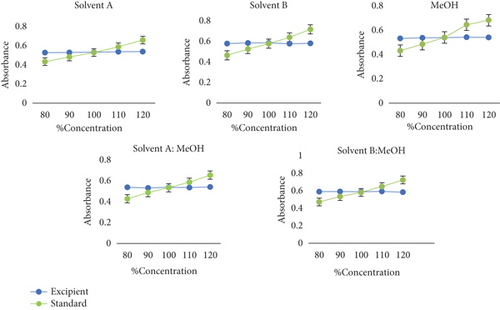
The favorable value of correlation coefficient and intercept is presented in Table 3. The developed methods were evaluated for their specificity in two conditions: fixed drug substance spiked with varying concentrations of excipient and fixed excipient spiked with varying concentrations of drug substance. The absorbance measured using the combination of the excipients did not interact with the absorbance of the reference standard (Table 4 and Figure 3).
| Fixed drug substance spiked with different concentration of excipient | Fixed excipient spiked with different concentration of drug substance | ||||||||||||
|---|---|---|---|---|---|---|---|---|---|---|---|---|---|
| Nominal drug conc. (μg/mL) | Excipient conc. (μg/mL) | Absorbance | Nominal excipient conc. (μg/mL) | Drug conc. (μg/mL) | Absorbance | ||||||||
| Solvent A | Solvent B | Solvent A: MeOH 50:50 | Solvent B: MeOH 50:50 | MeOH | Solvent A | Solvent B | Solvent A: MeOH 50:50 | Solvent B: MeOH 50:50 | MeOH | ||||
| 21 | 80.64 | 0.5288 | 0.5785 | 0.5389 | 0.5904 | 0.5904 | 100.8 | 16.8 | 0.4339 | 0.4646 | 0.4286 | 0.4724 | 0.4724 |
| 90.72 | 0.5301 | 0.5848 | 0.5330 | 0.5927 | 0.5927 | 18.9 | 0.4824 | 0.5253 | 0.4877 | 0.5344 | 0.5344 | ||
| 100.8 | 0.5320 | 0.5847 | 0.5383 | 0.5899 | 0.5899 | 21.0 | 0.5287 | 0.5775 | 0.5346 | 0.5820 | 0.5820 | ||
| 110.88 | 0.5373 | 0.5779 | 0.5361 | 0.5939 | 0.5939 | 23.1 | 0.5886 | 0.6393 | 0.5877 | 0.6492 | 0.6492 | ||
| 124.32 | 0.5393 | 0.5809 | 0.5420 | 0.5846 | 0.5846 | 25.9 | 0.6591 | 0.7179 | 0.6549 | 0.7246 | 0.7246 | ||
| RSD% | 0.8 | 0.5 | 0.6 | 0.6 | 0.6 | R2 | 0.999 | 0.999 | 0.999 | 0.999 | 0.999 | ||
The results of the forced degradation study by thermal stress conducted on TMZ standard and commercially available products at 60°C for various observation days are presented in Table 5.
| Assay concentration (%) ± %RSD | |||||
|---|---|---|---|---|---|
| Solvent systems | Initial (room temperature) | 24 h (60°C) | 72 h (60°C) | 120 h (60°C) | |
| Solvent A | Standard | 104.13 ± 0.8 | 104.66 ± 0.7 | 105.61 ± 0.5 | 95.49 ± 1.6 |
| Sample | 103.58 ± 1.5 | 111.78 ± 1.8 | 111.78 ± 1.7 | 98.59 ± 1.3 | |
| Solvent B | Standard | 94.83 ± 1.2 | 98.67 ± 0.5 | 106.88 ± 0.8 | 94.24 ± 1.3 |
| Sample | 96.91 ± 1.4 | 100.09 ± 1.2 | 99.50 ± 1.5 | 97.59 ± 0.7 | |
| Solvent A: MeOH (50:50) | Standard | 105.51 ± 1.1 | 105.57 ± 1.1 | 110.49 ± 1.3 | 99.55 ± 1.5 |
| Sample | 100.34 ± 1.2 | 99.91 ± 0.8 | 97.10 ± 1.1 | 89.51 ± 1.5 | |
| Solvent B: MeOH (50:50) | Standard | 105.02 ± 1.5 | 102.98 ± 0.6 | 91.69 ± 1.8 | 102.49 ± 0.8 |
| Sample | 120.00 ± 1.9 | 86.63 ± 1.9 | 72.11 ± 2.3 | 90.18 ± 2.1 | |
| MeOH | Standard | 97.57 ± 0.5 | 103.47 ± 1.7 | 92.40 ± 1.8 | 100.58 ± 1.5 |
| Sample | 105.60 ± 1.2 | 86.71 ± 2.2 | 88.31 ± 1.9 | 86.85 ± 1.9 | |
Some data indicated a significant change in the assay results of the marketed product and standard, specifically after subjecting TMZ to thermal stress at 60°C for various time periods. As the developed method was found precise for intra and interday study, the occurrence of these phenomena may be attributed to the generation of additional byproducts or degraded compounds, which may have a comparable absorption profile to TMZ [24]. Apart from assay results, UV spectra were compared and observed the changes of spectral pattern for few samples which is also indicative of the generation of degradation products (Figure 4).


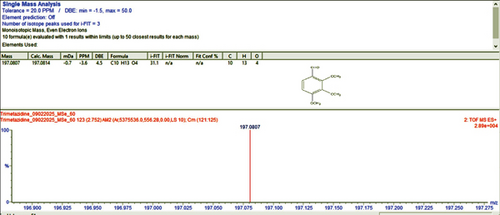
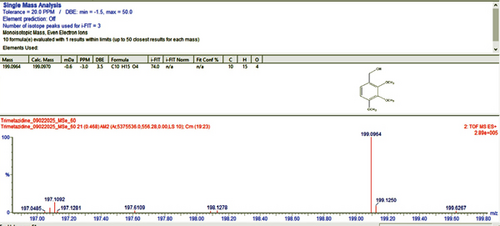
For qualitative screening of thermal degradation products, the sample was analyzed by high resolution mass spectrometry (HR-MS) (Waters Cyclic IMS) and detected the molecular mass with a molecular formula of two known degradation products, namely 2,3,4-trimethoxybenzyl alcohol and 2,3,4-trimethoxybenzaldehyde (Figure 5) [25, 26]. It is suggestive that these two degradation products, along with the other unidentified degradation products, may cause variations in assay results of thermal stress stability tested samples. Identification of unidentified degradation products is ongoing.
The nominal concentration of standard solutions used for accuracy, precision, and recovery analysis was around 25 μg/mL. Low recovery rates in a technique can sometimes be attributed to the incompatibility between the solvent and the mobile phase [27]. Across all five solvent systems, the mean recoveries in this work ranged from 97.47% to 104.16%, confirming the accuracy of these procedures (Table 6).
| Solvents | Label claim (mg/tab) | Estimated amount (mg/tab) | Spike level (%) | Amount of drug added (μg/mL) | Amount of drug recovered (μg/mL) | % recovery | RSD% |
|---|---|---|---|---|---|---|---|
| Solvent A | 35 | 202.9 | 80 | 31.05 | 31.93 | 102.86 | 2.3 |
| 100 | 35.26 | 35.81 | 101.58 | 0.1 | |||
| 120 | 39.48 | 39.82 | 100.87 | 0.9 | |||
| Solvent B | 35 | 200.2 | 80 | 31.19 | 31.20 | 100.02 | 0.5 |
| 100 | 35.46 | 35.0.89 | 101.22 | 0.3 | |||
| 120 | 39.69 | 39.40 | 99.27 | 0.5 | |||
| Solvent A: MeOH | 35 | 200 | 80 | 30.19 | 30.49 | 99.04 | 1.8 |
| 100 | 33.58 | 34.67 | 96.87 | 0.2 | |||
| 120 | 37.85 | 38.84 | 97.47 | 0.4 | |||
| Solvent B: MeOH | 35 | 200.2 | 80 | 31.89 | 31.83 | 100.18 | 1.8 |
| 100 | 35.71 | 36.01 | 99.16 | 0.3 | |||
| 120 | 39.88 | 40.18 | 99.26 | 0.9 | |||
| Methanol | 35 | 201.6 | 80 | 29.87 | 31.11 | 104.16 | 0.5 |
| 100 | 34.14 | 34.46 | 100.94 | 2.03 | |||
| 120 | 38.39 | 39.96 | 104.10 | 0.2 |
An intraday assay precision (RSD) of less than 2% and an interday assay precision of less than 2% indicate that the suggested method is precise (Tables 7 and 8).
| Solvent systems | Concentration (%) | 1st hour (% assay) | 3rd hour (% assay) | 8th hour (% assay) | %RSD |
|---|---|---|---|---|---|
| Solvent A | 80 | 99.61 | 96.79 | 94.70 | 1.93 |
| 100 | 99.60 | 98.37 | 98.37 | 1.71 | |
| 120 | 102.09 | 101.59 | 101.59 | 1.28 | |
| Solvent B | 80 | 100.46 | 99.25 | 99.42 | 1.65 |
| 100 | 98.95 | 101.52 | 99.31 | 1.39 | |
| 120 | 99.24 | 100.36 | 98.02 | 1.18 | |
| Solvent A: MeOH | 80 | 100.98 | 101.20 | 102.96 | 1.06 |
| 100 | 101.84 | 101.11 | 100.98 | 1.45 | |
| 120 | 100.90 | 100.30 | 102.02 | 1.86 | |
| Solvent B: MeOH | 80 | 100.23 | 99.79 | 99.78 | 0.76 |
| 100 | 99.97 | 101.87 | 100.02 | 1.93 | |
| 120 | 100.13 | 100.03 | 99.85 | 1.67 | |
| Methanol | 80 | 102.12 | 102.66 | 100.54 | 1.08 |
| 100 | 100.53 | 100.45 | 100.07 | 1.24 | |
| 120 | 102.41 | 100.60 | 101.31 | 0.89 | |
| Solvent systems | Con.% | Day 1 | Day 2 | Day 3 | %RSD |
|---|---|---|---|---|---|
| Solvent A | 80 | 97.03 | 98.04 | 99.14 | 1.07 |
| 100 | 98.78 | 102.47 | 101.39 | 1.87 | |
| 120 | 101.76 | 103.94 | 103.91 | 1.21 | |
| Solvent B | 80 | 99.71 | 99.44 | 97.03 | 1.49 |
| 100 | 99.93 | 100.70 | 98.67 | 1.85 | |
| 120 | 99.21 | 97.86 | 97.29 | 1.00 | |
| Solvent A:MeOH | 80 | 100.98 | 101.17 | 100.08 | 1.79 |
| 100 | 101.20 | 101.21 | 101.25 | 1.43 | |
| 120 | 102.96 | 101.95 | 101.94 | 1.13 | |
| Solvent B: MeOH | 80 | 100.17 | 99.89 | 98.07 | 1.02 |
| 100 | 100.39 | 100.03 | 99.76 | 1.67 | |
| 120 | 100.12 | 98.68 | 98.92 | 1.56 | |
| Methanol | 80 | 101.77 | 100.52 | 100.07 | 0.87 |
| 100 | 100.35 | 100.43 | 99.92 | 1.27 | |
| 120 | 101.60 | 101.06 | 99.59 | 0.97 | |
Two different brands of marketed TMZ were selected for assay test by the proposed methods. Analysis by the developed methods confirmed the presence of TMZ in a range of 97.02%–102.78% with 0.186 of %RSD, which is in the acceptable range (Table 9). The methods were found to be robust at a pH range of 1.8–2.2 and 6.6–7. (Figure 6).
| Solvent systems | Brand 1 | Brand 2 | ||||
|---|---|---|---|---|---|---|
| mg/tablet | Assay % | %RSD | mg/tablet | Assay % | %RSD | |
| Solvent A | 35.48 | 101.37% | 0.5 | 35.03 | 100.08% | 1.1 |
| Solvent B | 35.73 | 102.11% | 0.2 | 35.58 | 101.65% | 1.4 |
| Solvent A: MeOH (50:50) | 35. 54 | 100.03% | 1.5 | 35.41 | 100.02% | 1.2 |
| Solvent B: MeOH (50:50) | 34.97 | 99.87% | 1.2 | 34.89 | 99.86% | 1.5 |
| Methanol | 34.02 | 97.2% | 1.5 | 34.55 | 98.78% | 0.8 |
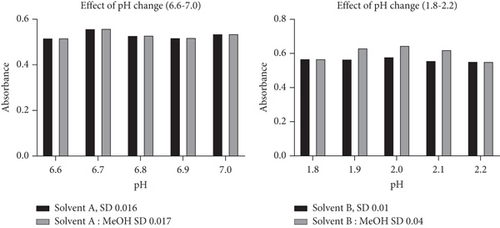
This implies that all of the developed methods are suitable for the analysis of TMZ in bulk and formulations, and the pH of the analytical media does not interfere with the accuracy and precision of the methods, although slight relations are found in sensitivity. The highest sensitivity was obtained for the use of phosphate buffer at pH 6.8 as media.
7. Conclusion
These methods yielded a satisfactory outcome in terms of the quantitative determination of the reference standard and pharmaceutical dosage formulation. Applying these analytical methods, a high level of analytical accuracy was achieved for the quantification of TMZ. Results indicate that this approach is a potent instrument with straightforward mathematical content and is more dependable than other spectrophotometric approaches. We highly recommend using these calibration models for regular analysis and quality control of commercial items. The methods described were determined to be straightforward, accurate, and precise, resulting in a satisfactory recovery of the analyte. This method can be readily and directly used for the analysis of TMZ pharmaceutical tablet formulations.
Conflicts of Interest
The authors declare no conflicts of interest.
Funding
The authors received no external funding.
Acknowledgments
The authors are grateful to Beximco Pharmaceuticals Ltd, Bangladesh, for providing trimetazidine. The authors are also highly grateful to Pharmaceutical Sciences Research Division, Bangladesh Council of Scientific and Industrial Research (BCSIR) Laboratories, Dhaka, Bangladesh, for providing all the laboratory facilities to carry out the work.
Open Research
Data Availability Statement
The authors confirm that the data supporting the findings of this study are available within the article.


