Damage Localization at Steel–Concrete Interface Using Nonlinear Ultrasonic Time Reversal Method
Abstract
Steel–concrete composite structures are prevalent in civil engineering, however, due to the temperature variation and fatigue loading, the interface between the steel tube and the core concrete is susceptible to various types of damage, including cracking, delamination, and debonding. Accurate localization of interface damage is crucial to ensure the safety of steel–concrete composite structures. The time-reversal (TR) method is commonly used in nondestructive testing for localizing structural linear damage due to its temporal and spatial focusing characteristics. However, the damage in the steel-concrete interface exhibits complex mechanical behavior and results in localization errors with the traditional TR method. To address this challenge, combined with the advantages of the VAM method, this paper proposes a nonlinear ultrasonic TR method to improve the accuracy of the TR method. This novel approach involves simultaneously exciting low-frequency (LF) and high-frequency (HF) signals using only one lead zirconate titanate (PZT) transducer, extracting the first-order modulation sideband signal, reversing and reemitting this signal, and utilizing the focused signal image to determine the location of damage at the interface. To validate the effectiveness of the proposed method, experiments were conducted on a concrete-filled steel tube with prefabricated interface damage to check its localization accuracy. The results clearly demonstrate an improvement in localization accuracy when using the proposed method compared to the conventional TR method. Specifically, the relative error in the coordinates for damage determined by the conventional TR method was significantly reduced from (25.89%, 18.82%) to (3.53%, 7.06%) with the proposed method. These findings underscore the superior performance of the proposed nonlinear ultrasonic TR method in localizing damage at the steel-concrete interface.
1. Introduction
Steel–concrete composite structures leverage the unique advantages of both steel and concrete, effectively enhancing the load-bearing capacity of the components. These structures are widely used in engineering, such as long-span bridges and high-rise buildings. However, the interface bonding between the steel tube and the core concrete is susceptible to damage, including debonding and delamination, due to construction quality issues, inherent material flaws, and the changes of external loading and environment [1–3]. These damages weaken the confinement of the steel tube against the concrete core, which leads to durability issues and significantly reduce the rigidity of components and pose a threat to the safety of structures. Therefore, precise localization and reinforcement of damage at the steel–concrete interface are essential to prevent potential accidents.
Ultrasonic inspection methods are commonly employed in structural nondestructive testing. These methods include computerized tomography [4, 5], synthetic aperture focusing technique [6], delay-and-sum method [7, 8], and time reversal (TR) method [9, 10]. Among these, the imaging results obtained by the computerized tomography and delay-and-sum method have a low resolution [11]; the synthetic aperture focusing technique has a large amount of data processing and is computationally inefficient. However, the TR method has been widely studied in acoustics and electromagnetics, as well as applications in modern biomedical engineering, underwater communications, and ultrasonic imaging due to its unique ability to focus waves adaptively across a wide detection range without requiring prior knowledge of the transducer properties, which can improve the resolution of damage imaging, and it is not easily disturbed by changes in the detection environment [12–14]. The TR process can be succinctly described as self-adapting and focusing of the probing signals at the excitation location. This involves emitting, receiving, reversing, and reemitting the signals using an array of transducers [9, 15]. Fink [9, 10] proposed a TR mirror and demonstrated its ability to focus an ultrasonic field through inhomogeneous media. Jeong [16] constructed the modular Gaussian beam model, demonstrating that the TR method can be used to generate the spatial and temporal focusing effects in anisotropic solids. The TR theory is well-developed and widely used in monitoring, detecting, and localizing damages in structures. Du et al. [17] proposed a virtual TR method for monitoring bolt preload and demonstrated its effectiveness in both single and multiple bolts. Agrahari and Kapuria [18] proposed a refined TR Lamb wave method for baseline-free damage detection and successfully identified the notch-type damage in an aluminum plate. Wang et al. [19] presented a digital imaging method based on the concept of TR to locate and estimate the size of structural damage. Kannusamy et al. [20] proposed a refined TR method based on Lamb waves to image and localize individual damage in thin isotropic plates. Liu et al. [21] proposed a baseline-free detection method using Lamb waves and the TR method to identify and locate delamination in composite plates. Ciampa and Meo [22] proposed a TR field imaging method for real-time detection of impact damage in anisotropic materials. Mu et al. [23] employed the particle swarm optimization algorithm to address the time-consuming issue of traditional TR localization methods.
However, spurious images can arise with the TR method due to various experimental factors [15], potentially leading to erroneous damage localization. Zhang et al. [24] proposed an approach for compensating signal dispersion in plate structures to improve imaging resolution in regions with multiple target damages. In addition, Zhang et al. [25] integrated the elliptical trajectory algorithm with the probability reconstruction algorithm for TR imaging, with the goal of improving imaging resolution and reducing spurious images. Previous studies have showed that the TR method can effectively localize strong scatterers concealed within a region, mainly due to the alterations in wave propagation caused by linear scattering at material inhomogeneities, such as reflections, refractions, and mode conversions. Unlike the “linear” scattering effect, in which the signal changes only in amplitude without the emergence of new frequency components; however, the damage at the steel–concrete interface exhibits complex nonlinear behavior, and the nonlinear scattering process produces high harmonics and modulated signals, which belong to a nonlinear signal component. These changes in frequency components can be called “nonlinear” scattering effects. Reversing all response signals may lead to the signals to converge on the source of excitation and damage location owing to the temporal and spatial focusing characteristics of the TR method, potentially resulting in erroneous damage localization. Hence, signal processing in TR for the steel–concrete interface should prioritize nonlinear components [26].
Nonlinear ultrasonic inspection methods are widely used in damage detection and localization. Ultrasonic waves interacting with damaged structures, can exhibit nonlinear features in response signals, including subharmonics, frequency mixing, slow dynamics, and modulated vibrations, can be observed. The damage can be detected and evaluated by identifying these distinct nonlinear features [27]. High harmonic wave [28], resonance frequency drift [29], and vibroacoustic modulation (VAM) [30] are commonly used techniques in detecting damages. In particular, VAM is renowned for its robustness against interference and sensitivity to minor damages, rendering it highly effective in detecting fatigue, cracking, and corrosion at the early stage. The VAM involves simultaneously exciting two different signals to the structure: a low frequency (LF) pumping vibration and a high frequency (HF) probing wave. The LF pumping vibration cyclically stretches and compresses the “imperfect” contact interface, causing it to open and close periodically, akin to a “breathing” motion. This introduces perturbation to the HF probing wave. As a result, nonlinear features such as modulation sidebands and high harmonics appear in the spectrum of the received signal. The magnitudes of sidebands and high harmonics indicate the extent of damage [31]. Klepka et al. [32] experimentally studied the fatigue crack identification of aluminum plates using VAM and revealed that energy dissipation is the primary mechanism behind nonlinear modulation. Donskoy et al. [30] revealed the quantitative characterization of modulated damage indicators and interface damages through experiments. Kim et al. [33] successfully identified cracks in wind turbines under operational loads using VAM. Yoder and Adams [34] introduced a scanning detection signal-based VAM and experimentally validated its efficacy on a steel beam in complex environments.
VAM has also been extensively studied for structural damage localization. Pieczonka [35] developed an imaging technique for nonlinear VAM sidebands and tested it on laminated thin composite plates for impact damage localization. Karve and Mahadevan [36] utilized a numerical model to investigate the performance of VAM in localizing hidden, breathing cracks in thick elastic slabs and proved that the method is robust in the presence of measurement noise. In addition, Karve et al. [37] combined VAM with Bayesian probability to localize the through-hole damage of concrete slabs under the action of alkali–carbon dioxide reaction. However, the interface damage in concrete-filled steel tube is different from through-hole damage in concrete slabs, the interface damage in steel–concrete structures exhibits complex nonlinear behavior. When using the conventional TR method to determine the damage location of steel–concrete structures, there will be a significant error. In addition, the previous studies of damage localization have primarily focused on the damage to the material itself. There is a notable lack of research on damage localization at the interfaces of two different materials, such as the steel–concrete interface.
To address this issue, this paper proposes a nonlinear ultrasonic TR method to enhance the accuracy of the conventional TR method. The proposed method involves the simultaneous excitation of LF and HF signals on the damaged structure. Subsequently, the first-order modulated sideband signals extracted from the response signals are reversed and re-excited. The resulting focused signals’ image is then analyzed to determine the damage location in the interface. By selectively reversing only the nonlinear signal which is generated by damage, the signal is precisely focused at the damage location, leveraging the temporal and spatial focusing characteristics of the TR method. As a result, the damage location can be accurately determined. To validate the effectiveness of the proposed method, experiments were conducted for localizing damage in the steel–concrete interface. A comparative experiment with the conventional TR method for damage localization was also designed. In addition, a relative error index is introduced to illustrate the damage localization accuracy.
2. Operation Procedure and Principles of the Proposed Methods
The proposed nonlinear ultrasonic TR localization method mainly includes three modules: the VAM module, the TR module, and the damage imaging module. The workflow of the nonlinear ultrasonic TR method is shown in Figure 1.
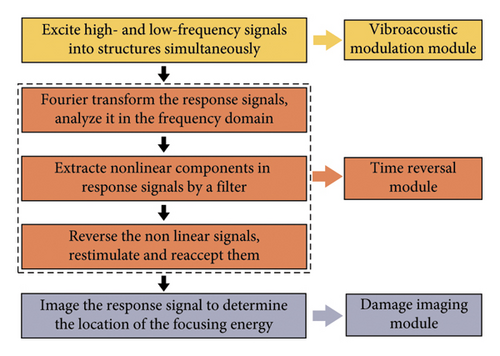
In the VAM module, the structure under investigation is excited with LF and HF signals using optimized parameters to introduce significant nonlinearities in the response signal. In this study, these signals are simultaneously applied to the structure using only one excitation actuator, after which the response signals are captured by a receiving sensor. To facilitate the operation, lead zirconate titanate (PZT) transducers are employed to serve dual roles as both the excitation actuator and the receiving sensor [38–40]. During the experiment, a network with N PZT sensors is used. Each PZT in this network acts as an actuator, with signals being excited sequentially in a numbered order. When one PZT is used as an actuator, the remaining N − 1 PZTs serve as receiving sensors for signal acquisition, resulting in a total of N × (N − 1) groups of data. Since the TR method is independent of the propagation path, that is, half of the data in the sensing path is repeated, so resulting in a total of N × (N − 1)/2 groups of data.
In the TR module, the response signals undergo Fourier transformation and subsequent analysis in the frequency domain. Nonlinear components within these signals are then extracted and utilized for re-exciting the structure. In this study, a filter is designed to extract the first-order modulated sideband signal. This extracted signal exhibits a high signal-to-noise ratio and contains crucial information related to the damage. Subsequently, the extracted nonlinear signal is reversed in the time domain and used to re-excite the structure. During the TR and re-excitation, the excitation process is identical to the signal excitation process in the VAM module.
In the damage imaging module, response signals from all sensing paths are collected, and the damage location is determined by applying the damage imaging algorithm.
The principle of the proposed nonlinear ultrasonic TR method is illustrated in Figure 2. A LF pumping wave and a HF probing wave are simultaneously applied to the steel–concrete composite structures. The frequency of the LF wave is denoted as fL, and that of the HF wave is denoted as fH. The resulting response signal contains not only the probing frequency and the pumping frequency but also additional frequency components, including high-order harmonics and sidebands around the probing signal. The amplitudes of these sidebands are directly proportional to the extent of damage, indicating that the more severe the damage corresponds to the stronger nonlinearities, the higher the modulation sidebands. Subsequently, the first-order sideband of the response signal, acting as the TR excitation signal, is extracted, reversed and re-emitted by the original receiving sensor. The response signal is then processed and imaged to identify the location of maximum signal energy, thereby determining the location of damage.
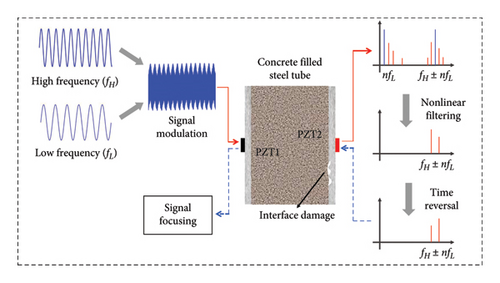
The generation of these nonlinear frequency components is attributed to the microscopically rough contact interface at the steel–concrete interface. Therefore, these contact interfaces can be considered as sources of nonlinear effects, and the energy of nonlinear components will coverage at the damage location after reversing and re-excitation. Prior studies have demonstrated that the amplitude of the first-order sideband signal of nonlinear components can indicate the severity of damage, imaging and localizing damage can be achieved based on the energy distribution of the modulated sideband [26, 42]. Therefore, the first-order sideband signals are extracted through filtering in this study.
The first term on the right side of equation (11) represents the modulated sideband signal fb(t) that simultaneously arrives at the destination from different actuators and paths, and this term is irrelevant to the value of the i and n. Since the phase differences among these signals are zero, they add up to form a main peak in the frequency domain. The second term on the right side of the equation represents the modulated sideband signals arriving at the different time, indicating that the value of tni is not equal to tnj for i ≠ j. Consequently, they contribute to generate smaller amplitudes and appear on both sides of the main peak in the frequency domain. This equation indicates that by extracting the first-order sideband signal and exciting it after TR, the signals transmitted from different paths can arrive at the damage location simultaneously, thereby achieving the focusing of signal energy and localization of the damage.
3. Experiments
3.1. Experimental Setup
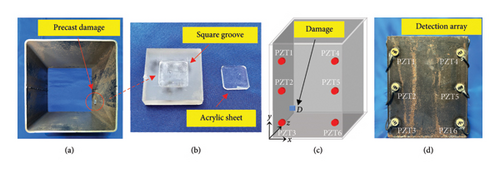
In order to compare the damage localization accuracy of the method proposed in this paper with the conventional TR method, a concrete-filled steel tube specimen with dimensions of 200 × 200 × 250 mm was fabricated. The core concrete had a design strength of C40, and the steel material was Q235. The specimen was created by pouring concrete into a square steel tube with a wall thickness of 3 mm. To simulate the interface damage between the steel tube and the concrete, an acrylic plate with a 10 × 10-mm square groove and a thickness of 1 mm was used. In addition, another acrylic sheet of the same size, thickness, and material as the groove was embedded inside and affixed to the inner wall of the steel tube at the position of (150, 150 mm) in the x and y coordinate system, which is considered as the damage D, as depicted in Figure 3. Six circular PZT transducers, each with a diameter of 15 mm and a thickness of 2 mm are securely attached to the outside surface of the specimen with epoxy to form the detection array. In order to express more clearly the relationship between the position of the PZT and the damage, we established a coordinate system as in Figure 3(c) and use the position of the center of gravity of the PZTs and damage as the value of z in their respective coordinates, respectively, and the x and y coordinates are established at the outside surface of the specimen, the coordinates of the PZT transducers and damage are given in Table 1.
| Transducer no. | Coordinates (x, y, z) (Unit: mm) |
|---|---|
| PZT 1 | (20, 210, −1) |
| PZT 2 | (20, 125, −1) |
| PZT 3 | (20, 40, −1) |
| PZT 4 | (180, 210, −1) |
| PZT 5 | (180, 125, −1) |
| PZT 6 | (180, 40, −1) |
| D | (150, 150, 0.5) |
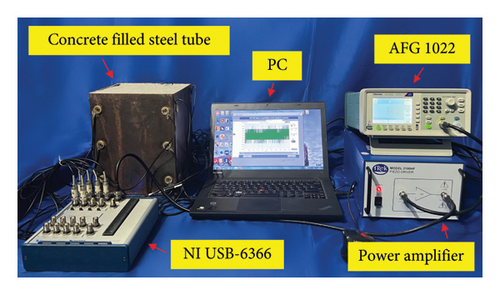
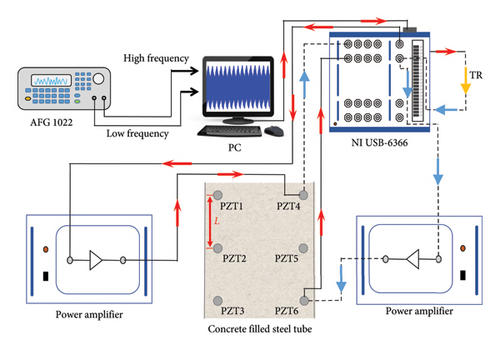
A function generator (Tektronix AFG 1022) was employed to excite the swept sine wave and determine the optimal parameters of frequencies and amplitudes for the excitation signal in each sensing path. Subsequently, the function generator was connected to a power amplifier (Trek 2100 HF-H-CE) to improve the signal strength. A multifunction data acquisition board (NI USB-6366) interfaced with a custom LabVIEW program was used to sample the signals at a frequency of 1 MHz. The experimental instrumentation setup is shown in Figure 4, and the schematic diagram of the experimental process is shown in Figure 5.
3.2. Excitation Technique
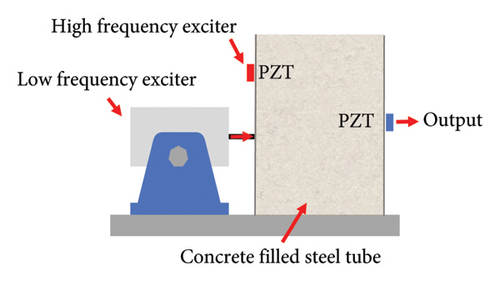
The VAM module plays a key role in nonlinear ultrasonic-based damage localization methods. The principle of VAM involves simultaneously exciting two different signals into the damaged structure: a LF pumping vibration and a HF probing wave. Typically, this vibration is provided by an electromagnetic exciter, as depicted in Figure 6(a). However, for damage localization using VAM, a large number of sensors are required to capture the signal of the detection array, which can be inconvenient and uneconomical for experiments. To address this issue, this paper explores a technique that utilizes only one piezoelectric transducer to simultaneously excite LF and HF signals, as illustrated in Figure 6(b).
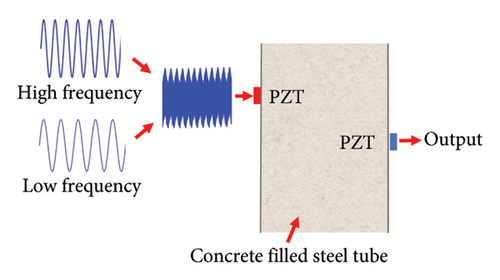
The proposed excitation method operates as follows: initially, the HF and LF signals, each with optimal parameters and the same length are combined. Subsequently, the combined signal is excited by a single transducer and received by other sensors, resulting in the acquisition of the response signal. To illustrate the effect of the proposed excitation method, both the traditional excitation method and the proposed method were respectively utilized to stimulate the HF and LF signals with the same parameters. Taking the PZT 3-PZT 4 sensing path as an example, the response signals in the frequency domain are depicted in Figure 7.
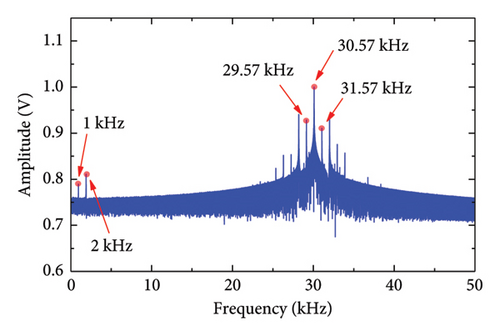
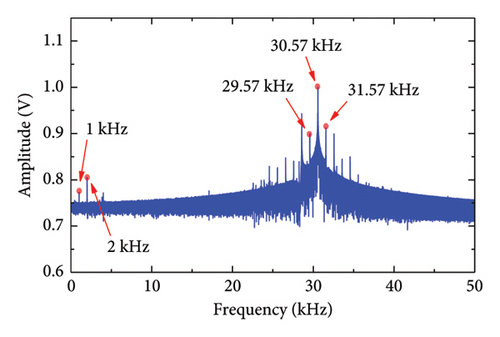
As shown in Figure 7, the spectrum of the response signals obtained using two different excitation methods clearly depicts the LF (1 kHz) and HF (30.57 kHz) components of the excitation signals. The high-order harmonic signal (2 kHz) of the LF can also be observed. In addition, the first-order sideband (29.57 and 31.57 kHz) and other nonlinear components can also be observed on both sides of the HF. These results demonstrate that the proposed excitation method can effectively generate nonlinearity in the ultrasonic response signals. Compared to the traditional excitation method using a shaker, the proposed excitation method is cost-effective and easy to operate, making it an ideal method for excitation.
3.3. Parameters of the Excitation Signal
The sweeping test was conducted to determine the parameters of excitation signals. Subsequently, the optimal parameters of the excitation signal with maximum MID were finally obtained and listed in Table 2.
| HF signal | LF signal | ||
|---|---|---|---|
| Sampling frequency (MHz) | 1 | Sampling frequency (MHz) | 1 |
| Frequency (kHz) | 29.41 | Frequency (kHz) | 1.05 |
| Amplitude (V) | 1 | Amplitude (V) | 8 |
4. Experimental Results and Discussion
4.1. Results
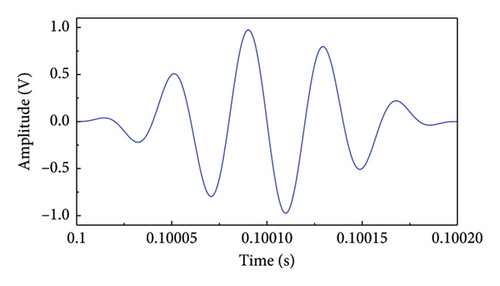
After determining all parameters, including frequency and amplitude for LF and HF components, the damage identification experiments were conducted. The frequency spectrum of the response signal is shown in Figure 9(a), illustrating high-order harmonics to the right of the fundamental LF component and first-order modulation sideband around the fundamental HF component. These nonlinear features of the response signal correspond to the interface damage.
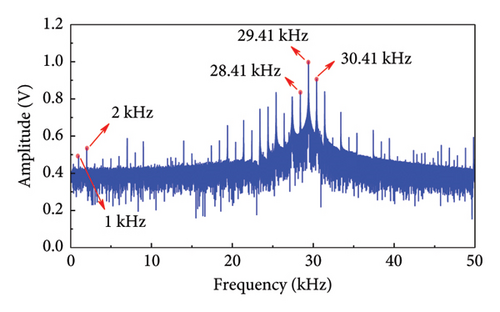
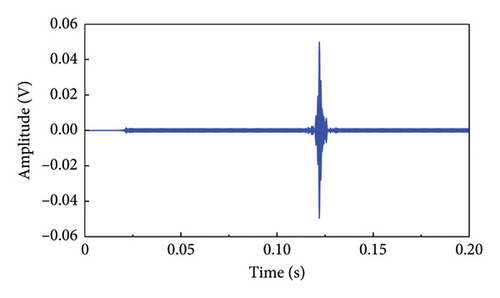
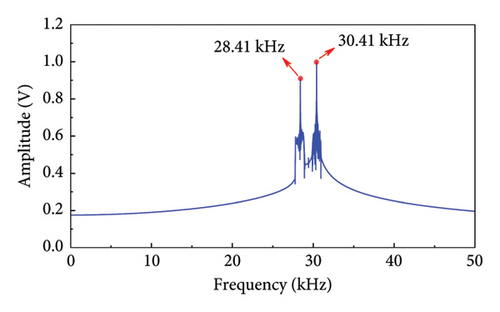
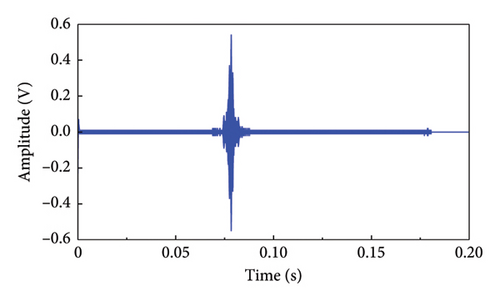
The analysis in this paper focuses on using the first-order modulation sideband around the HF component to identify damage and employing a designed filter for extraction. The key points of the filtering process are as follows: (1) a band-pass filter designed with a Kaiser window was applied to filter the left and right components of the first-order modulation signal, (2) a band-stop filter designed with a Kaiser window was used to remove the frequency components surrounding the fundamental HF component, and (3) the first-order modulation sideband was extracted. The filter parameters are detailed in Table 3. Figures 9(b) and 9(c) illustrate the first-order modulation sideband signal in the time and frequency domains, respectively. Following this, the first-order sideband signal was reversed, propagated back to its original location, and received by the transducer. Finally, the received signal containing damage information is focused, as shown in Figure 9(d), where the amplitude of the focused signal is significantly amplified. The described experimental process was then repeated to acquire the full-path focused signals, which were subsequently imaged according to equation (12).
| Band-pass filter | Band-stop filter | ||
|---|---|---|---|
| Window function | Kaiser | Window function | Kaiser |
| Sampling frequency (MHz) | 1 | Sampling frequency (MHz) | 1 |
| Fstop1 (kHz) | 28.06 | Fpass1 (kHz) | 29.11 |
| Fpass1 (kHz) | 28.26 | Fstop1 (kHz) | 29.31 |
| Fpass2 (kHz) | 30.56 | Fstop2 (kHz) | 29.51 |
| Fstop2 (kHz) | 30.76 | Fpass2 (kHz) | 29.71 |
| Order | 25,093 | Order | 18,128 |
| Delay (ms) | 12.5 | Delay (ms) | 9.06 |
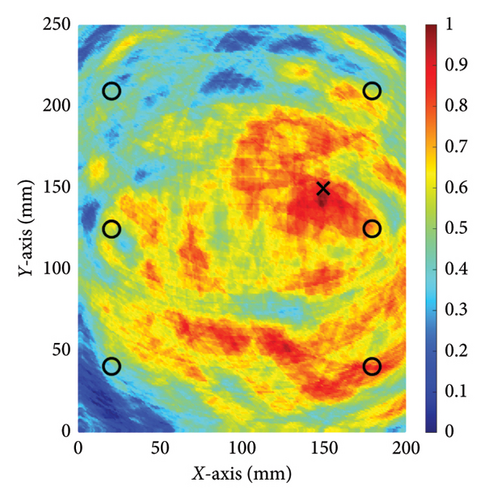
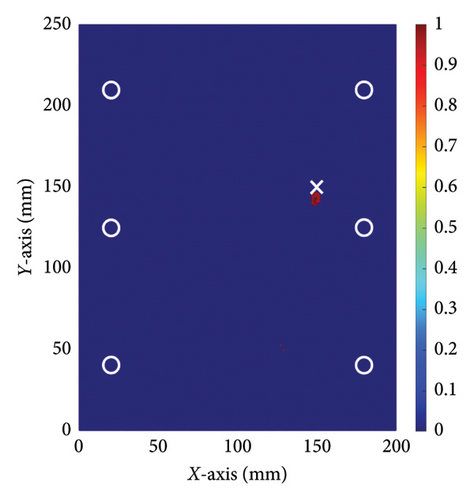
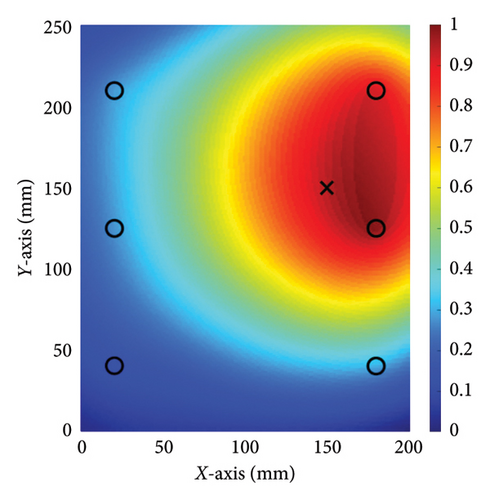
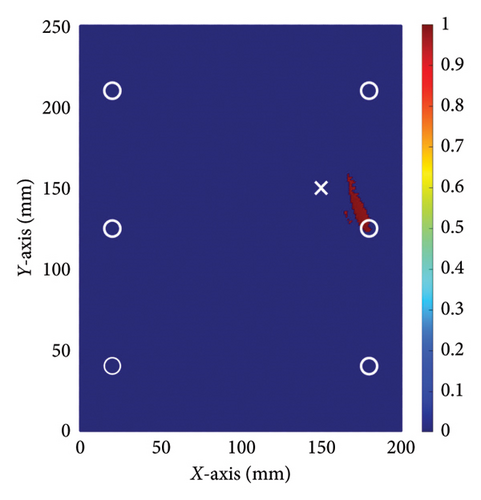
To compare the effectiveness of the damage localization accuracy between the method proposed in this paper and the conventional TR method, experiments were conducted using both methods with the aim of assessing their performance. The identification results were visualized with the normalized pixel values based on equation (12). The Figure 10(b) shows a binary image created from Figure 10(a) by only accounting for image pixels whose intensity is larger than an arbitrary threshold value, which in this study was chosen as 95% of the maximum intensity of the reconstructed damage localization image [8]. In the figure, the symbol ‘○’ denotes the position where piezoelectric transducers were placed, and the symbol ‘×’ indicates the actual location of the damage. In Table 1, we used three-dimensional coordinates to determine the location of the PZT sensors and damage. However, the z coordinates of damage location and PZT location do not belong to the scope of damage localization, so the x and y coordinates are subsequently used to represent the determined damage location and the calculation of positioning errors. It can be observed from Figure 10 that the pixel values around the location (147, 144 mm) display significantly higher values compared to other areas, suggesting that this is the location of the damage. Figure 11 shows the image obtained using the conventional TR method. In this figure, it is evident that the pixel values surrounding the location (172, 134 mm) are significantly larger than those in other areas, indicating that this is the location of the damage.
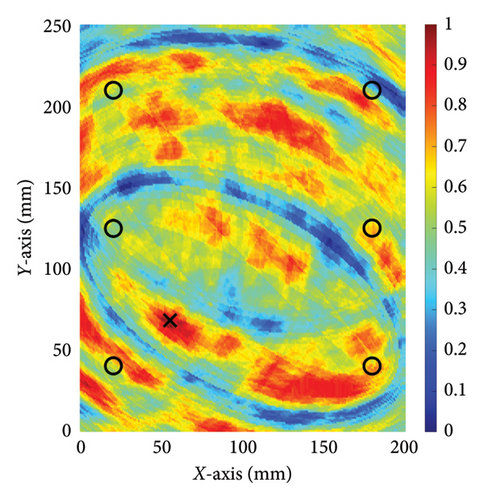
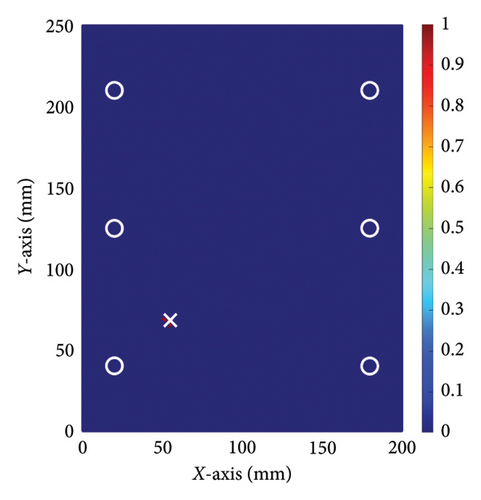
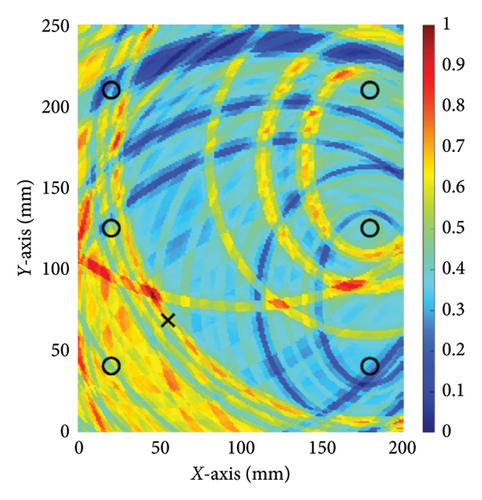
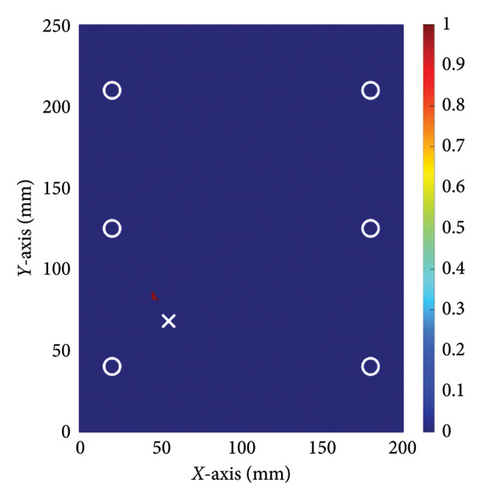
To further validate the effectiveness of the method proposed in this paper, experiments were conducted on another specimen with the same dimension as the previous one, but with the damage located at a different position. In this experiment, the damage was located at coordinates (55, 70 mm), while all other experimental settings remained the same as in the previous one. The experiments followed the same procedure, and a comparative study was also conducted using the conventional TR method. Figures 12 and 13 show the damage imaging for the two methods, respectively. It is evident that the proposed method still performs better than the conventional TR method in locating this damage.
4.2. Discussion
The results of relative errors are listed in Table 4. In the first experiment, the actual location of the interface damage is at (150, 150 mm). The central coordinate of the damage location determined by the conventional TR method is (172, 134 mm), resulting in the relative errors of coordinates of (25.89%, 18.82%). In contrast, the central coordinate of the damage location determined by the proposed method is (147, 144 mm), resulting in relative errors of coordinates of (3.53%, 7.06%). In the second experiment, the relative errors of the damage location determined by the conventional TR method are (11.7%, 15.3%), while the relative errors of the damage location determined by the proposed method are only (2.35%, 4.7%). The results of two experiments show that employing the method proposed in this paper significantly reduces the relative error in damage localization. Compared to the conventional TR method, the proposed approach can more accurately depict the position of damage at the steel-concrete interface. These experimental results suggest that the nonlinear ultrasonic TR method enhances the accuracy of damage localization at the steel–concrete interface and reduces the relative error of damage localization.
| Experiment no. | Damage location | Coordinates (mm) | Coordinate error d (mm) | Relative error (δx, δx) |
|---|---|---|---|---|
| 1 | Actual (x, y) | (150, 150) | — | — |
| Conventional TR (x1, y1) | (172, 134) | (22, −16) | (25.89%, 18.82%) | |
| Proposed method (x2, y2) | (147, 144) | (−3, −6) | (3.53%, 7.06%) | |
| 2 | Actual (x, y) | (55, 70) | — | — |
| Conventional TR (x1, y1) | (45, 83) | (−10, 13) | (11.7%, 15.3%) | |
| Proposed method (x2, y2) | (57, 66) | (2, −4) | (2.35%, 4.7%) | |
- Note: coordinate error is d = (x1 − x, y1 − y).
5. Conclusion and Future Work
- 1.
The improved nonlinear ultrasonic TR method differs from the conventional approach by exclusively employing the extracted nonlinear components for damage localization. The temporal and spatial focusing characteristics of this method enhance the concentration of the nonlinear component on the damage area.
- 2.
The enhanced excitation technique in this study utilizes a single-piezoelectric transducer to simultaneously generate both HF and LF signals, which ensure that the response signal appears significant modulated phenomenon under simple operation, improving the convenience of the VAM method.
- 3.
Experimental results indicate that the nonlinear ultrasonic TR method exhibits reduced error in damage localization compared to the conventional approach. Specifically, the relative errors in the damage coordinates determined by the conventional method decrease significantly from (25.89%, 18.82%) to (3.53%, 7.06%) with the proposed method.
Currently, the method proposed in this paper is limited to identifying a single damage in the steel–concrete interface. However, considering the diverse-types and severities of interface damages in concrete-filled steel tubes, it is crucial to accurately identify the locations of multiple damage on the steel–concrete interface. Therefore, our future work will focus on applying the proposed method to identify multiple damages on the steel–concrete interface and conducting repeatable experiments to validate its stability. In addition, to guarantee its effectiveness in engineering application, future research will investigate the influence of noise and other variables on experimental results.
Conflicts of Interest
The authors declare no conflicts of interest.
Funding
This research was supported by the General Project of the Natural Science Foundation of China (Grant No. 52178274).
Open Research
Data Availability Statement
The data used to support the findings of this study are available from the corresponding author upon request.


