A Concrete Resistivity Method Based on a Simple Measuring Cell for Onsite Corrosion Monitoring: Study on Concrete Under Varying Conditions
Abstract
Concrete resistivity (ρ) is commonly monitored in situ using sensors based on the rebar-disc (RDM) or four-electrode (FEM) methods. This study validates, for the first time in reinforced concrete, an innovative corrosion sensor approach (CSA) previously tested only in simulated pore solutions. The CSA uses a single embedded two-electrode sensor that also allows the corrosion rate, offering a significant advantage for structural health monitoring. CSA resistivity values were broadly consistent with those from established reference methods: 2.9% higher than the RDM and 20% lower than the two-electrode method. Larger differences were observed with the FEM, decreasing when a finite-element cell factor (103%) was applied instead of one for semi-infinite elements (208%). This trend aligns with expected differences between FEM surface resistivity and bulk values. Additionally, a simple correction factor is proposed to normalise ρ to the reference temperature (T) of 20°C, expressed as 1/(a·exp((b)·T)), with a and b equal to 1.7251 and 0.027 for low-resistivity concretes and 2.4851 and 0.046 for medium- to high-resistivity concretes. A general model for the full resistivity range yielded a = 2.0687 and b = 0.036. While further research is needed to explore wider corrosion scenarios, the results highlight the potential of the CSA as a practical tool for both laboratory and in situ corrosion assessment.
1. Introduction
Reinforcement corrosion gives cause for considerable concern given that its adverse impact on reinforced concrete structural integrity raises maintenance costs and compromises safety [1, 2]. The likelihood of reinforcement corrosion is known to depend on the quality of the concrete cover, that is, concrete porosity and pore interconnectivity, as well as on the water saturation degree, the ionic conductivity of the electrolyte in the pore network and temperature [3]. Assessing all these parameters onsite usually entails time-consuming, expensive and/or destructive tests [4]. Once the reinforcement has depassivated, concrete resistivity and the oxygen availability at the steel-concrete interface are the main factors controlling the corrosion rate [5]. In light of the complexity involved in measuring oxygen concentration in situ, resistivity measurement, along with corrosion potential, are among the foremost nondestructive tests used to assess the risk of rebar corrosion in reinforced concrete [6, 7].
Feliu et al. [8] found an inverse relationship between concrete resistivity and reinforcement corrosion rate, a finding corroborated by Glass et al. [9], who also showed that the correlation depends heavily on environmental relative humidity. Lopez and González [10], in turn, added a third factor, the saturation level of concrete pores. Despite all the evidence of the substantial effect of resistivity on the corrosion rate, no clear consensus has been reached on the threshold resistivity values indicative of the risk of reinforcement corrosion [11]. Table 1 gives the four resistivity-dependent corrosion rate levels set out in RILEM TC-154 [12].
| Resistivity (Ω·m) | Probable corrosion rate |
|---|---|
| > 1000 | Negligible |
| 1000–500 | Low |
| 500–100 | Moderate |
| < 100 | High |
Concrete resistivity depends on design- and production-determined controllable factors (water/cement ratio, cement type, mineral admixtures, degree of hydration and curing conditions), as well as uncontrollable depending on the environmental exposure conditions prevailing (temperature, relative humidity and chloride content) [13–15]. Given the effect of the last three parameters listed, resistivity must be monitored across structures’ entire service lives to ensure that any changes able to impact their durability are detected in advance. Nondestructive techniques have consequently been developed over the years to measure concrete resistivity onsite. The methods most widely used include the Wenner, or four-electrode method (FEM), defined for use in mass concrete by the standard UNE-EN 12390-19 [16] and the rebar-disc method (RDM) proposed by Newman [17] and Feliu et al. [18]. Resistivity values can be readily found with the simple sensor array applied in these techniques [15]. Excellent Wenner method sensors have been developed by Wickramanayake et al. [19] and du Plooy et al. [20]. Normally surface-mounted, such sensors are subject to a number of conditioning factors; however, wet sponges are required to secure electrical contact between the electrodes and the concrete; the position of the rebars must be known in advance; the presence of high impedance layers (e.g. inhibitor coatings) is incompatible with their use; and any measurements deemed nonrepresentative as a result of the nonuniform distribution of moisture in concrete must be disregarded [21]. Moreover, these systems are designed for periodic measurements recorded by operators but not to be permanently installed for ongoing monitoring.
The resulting scenario has prompted considerable interest in embeddable resistivity-monitoring sensors [22, 23], in particular multielectrode sensors. Examples of the latter are the anode-ladder-system by Raupach and Schießl [24], Priou et al.’s 32-aligned-electrode sensor [25], SensorTec’s parallel ring sensor [26] and the 19-electrode ladder-shaped sensor proposed by Badr et al. [27]. The latter two are designed for measuring resistivity at different depths in the concrete cover. Other innovative methods have also come forward recently, such as Sophocleous et al.’s [28] screen-printed sensor. These specific-purpose sensors constitute significant progress. Nonetheless, as resistivity is a qualitative parameter, it is of particular value when used in embedded multisensor corrosion systems in conjunction with other sensors designed to measure variables such as corrosion potential, corrosion rate, galvanic current, chloride content, pH or oxygen availability [29, 30]. Market examples include the multisensor developed by Duffó and Farina [31] and Virginia Technologies’ ECI-2 multiparameter instrument [32], which calculates resistivity by applying a geometric factor to the current recorded between two or four stainless steel electrodes comprising the respective specific resistivity sensor.
The need to use a specific sensor for each parameter monitored may entail an increase in multisensor system complexity and cost. Moreover, in resistivity sensors, the geometric factor applied is of crucial importance, for the solution sets used in its calibration must attempt to handle the extremely wide spectrum of resistivity values that can be found in concrete, while also taking sensor geometric variables (electrode areas, spacing and orientation) into account [33–36]. Although according to the literature concrete resistivity may lie between 101 Ω·m to 106 Ω·m depending on the humidity and type of material [12, 37, 38], in most cases the upper end of the scale is no higher than 104 Ω·m.
This article introduces an innovative corrosion sensor approach (CSA) for onsite monitoring of resistivity in concrete structures [39–41]. A key advantage of this method is that it allows simultaneous measurement of resistivity and other corrosion-related parameters, such as corrosion potential and corrosion rate, using a single sensor. In addition, the sensor enables continuous and remote monitoring, making it particularly suitable for installation in areas of the structure that become inaccessible once construction is completed. The CSA method is based on an embedded corrosion sensor integrated into INESSCOM, an autonomous system for real-time wireless corrosion monitoring. A further strength lies in the simplicity and versatility of the sensor cell array, which can be easily adapted to other corrosion monitoring systems based on standard reference techniques such as linear polarisation resistance (LPR) [42, 43]. In the CSA, resistivity is found on the grounds of electrical resistance (RE), measured between the sensor’s working electrode (WE) and the reinforcement, to which the cell factor applied aims to be apt for any type of use, for it accommodates all the measuring cell’s most prominent geometric variables. Both the techniques for measuring RE and the expression for calculating the cell factor were established in a prior study on the sensor’s response in solution with a wide range of resistivity [44].
The present work aims to verify the reliability of the CSA in concrete by defining the deviations with respect to different reference methods under a wide range of conditions, as well as to evaluate the influence of temperature on resistivity. The latter is intended to find a factor to normalise the CSA resistivity with respect to temperature, a feature of particular interest where standardised conditions are called for, such as in the laboratory characterisation of materials. In the discussion below, a review of the reference methods for measuring resistivity is followed by a description of the CSA proposal. The empirical study used specimens prepared with two different concretes exposed to varying conditions (including temperature) to establish the broadest and most highly varied spectrum of resistivity values possible for comparison of methods.
This study aspires to determine the grounds for including the new method proposed in corrosion measurement systems such as INESSCOM, thereby monitoring both concrete resistivity and corrosion rate with a single sensor. Ultimately, it aims to eliminate the need for additional sensors (other than a temperature sensor, such as a simple thermocouple), methods or complex electronic devices, a substantial advantage seldom present in structural health monitoring.
2. Background
This section describes the methods to measure resistivity in reinforced concrete to be reviewed hereunder. All are based on equation (1), although each with a specific k factor. The procedures at issue, namely the two-electrode (TEM), FEM, RDM and concentric cylinder (CCM) methods, are used as a comparative reference for the CSA proposed here as an improvement on present practice.
2.1. Reference Methods
2.1.1. Direct or TEM
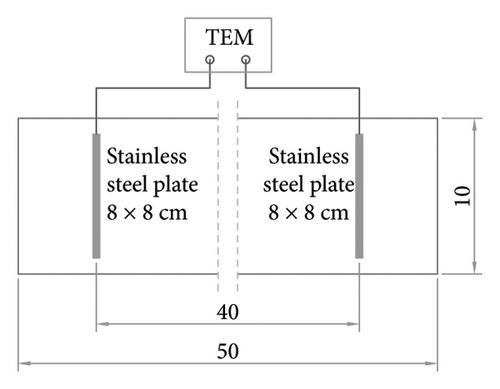
This procedure, which involves the use of two flat steel electrodes positioned in parallel at the ends of the concrete specimen to be assessed (as specified in the standard UNE-EN 12390-19 [16] and ASTM C1876 [46]), is illustrated in Figure 1(a). Resistivity is calculated (equation (1)) by measuring the alternating current-based electrical resistance (RE) between the two electrodes and applying the cell factor k = S/L, where S is the cross-sectional area of the concrete specimen assessed (in cm2) and L is the interelectrode spacing (in cm). The specifications laid down in the respective standards are seldom applied. Rather, researchers prefer to use the most suitable setup for the purpose of their work, as is the case in the present study (Figure 2(a)). The literature describes a number of types of embedded and surface electrodes (stainless steel or copper plates, meshes or gauzes) [33].
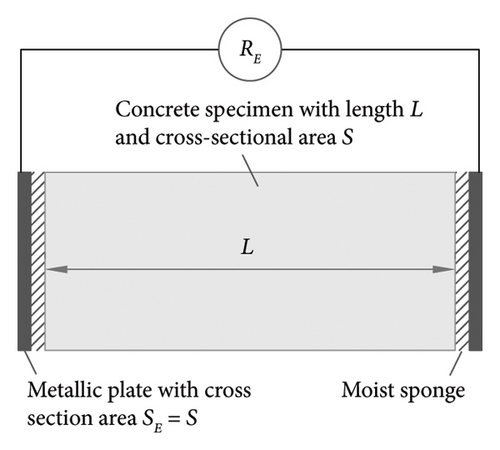
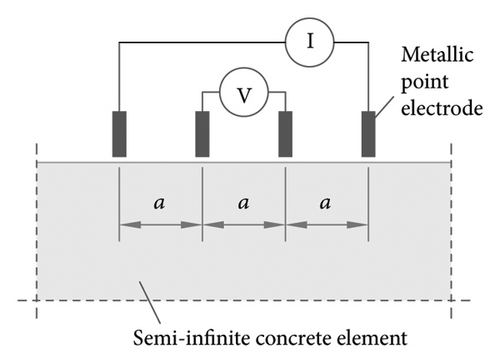
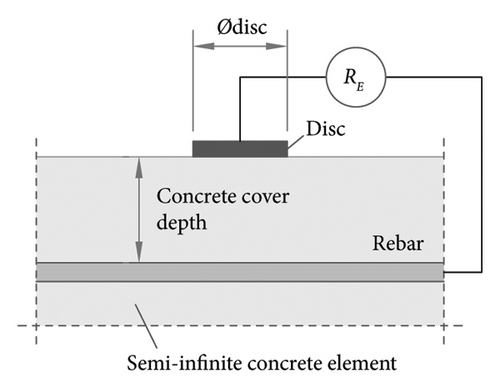
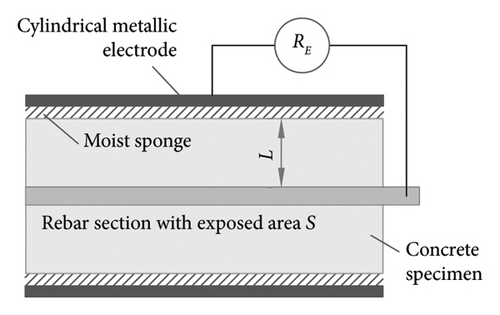
As described in a previous paper [47], measurements prove to be reliable when the electrode area (SE) is greater than or equal to S. That is not the case in real structures, where SE < S, which would imply the need for prior calibration for different S/ SE relationships. Therefore, this method is normally applied to standardised cylindrical/prismatic specimens or cores taken from existing structures devoid of reinforcement, thus ensuring SE = S. In other words, onsite application of this technique is attendant upon destructive coring.
2.1.2. FEM
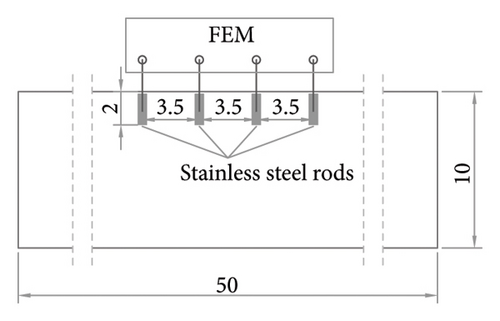
As the FEM is designed to determine resistivity in uniform, semi-infinite volumes of concrete, it is the procedure used for in situ structural assessment [48]. Resistivity is found from the measurement taken with four separate steel electrodes aligned along the concrete surface, as illustrated in Figure 1(b). The outer two electrodes measure the intensity (I) of the alternating current applied, and the inner two electrodes measure the resulting voltage (V). Electrical resistance (RE) is found as RE = V/I. The geometric factor to convert RE to resistivity (ρ) (equation (1)) in the case of semi-infinite elements (as is the case for the in situ measurement) is k = 2·π·a, where a is the distance between electrodes in cm.
This method yields a measure of surface resistivity with values closely correlated to but generally higher than those found with the TEM for bulk electrical resistivity [12, 49]. The reliability of the FEM, designed to assess mass concrete specimens, may be altered by a number of factors, all of which have been studied [13, 50], including electrode spacing (a) relative to the size and geometry of the member measured [14, 48, 51], reinforcement depth and distance from the area measured [52, 53] and the measurement frequency (Hz) [19]. The effect of those variables on resistivity measurement can only be computed by including further factors in equation (1) that must normally be established for each type of use. Although that affords significantly higher reliability, it may render resistivity calculations more complex, thereby lowering method applicability onsite. In the case of elements with finite geometry, feasible approaches have been proposed to determine a specific geometric factor based on the element’s geometry and the electrode spacing [50, 54], thus approximating the results to bulk resistivity. Under atmospheric conditions (nonwater saturation), the FEM method may lead to measurement errors, as the lack of surface moisture in the concrete can generate high contact resistances at the electrodes, resulting in an overestimation of resistivity or, in extreme cases, an inability to inject current and perform the measurement. Cheytani and Chan [55] have demonstrated that the use of embedded electrodes in the FEM helps to overcome this limitation.
2.1.3. RDM
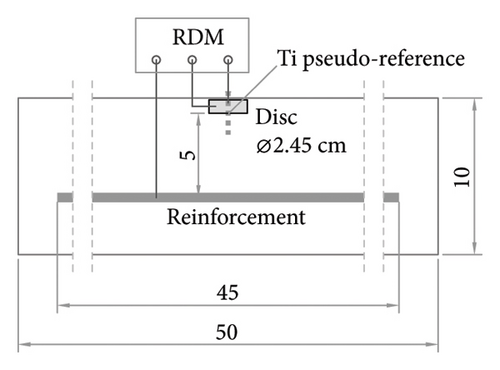
Also known as Newman’s method, this procedure is based on measuring electrical resistance (RE) between the reinforcement and a metallic disc of known diameter (Ødisc) positioned on the surface in parallel with the rebar, as shown in Figure 1(c) [12]. The RE reading is normally based on an interrupted current galvanostatic pulse.
Here, factor k for converting RE into resistivity (equation (1)) depends on concrete cover thickness and rebar and disc diameter. Feliu et al. [18], technique pioneers, determined that k = 2· Ødisc, provided the k value is less than the thickness of the concrete cover in cm. In specimens with a very thin cover, the disc may need to be positioned differently that is, not immediately over the rebar [52]. Other authors (Samson et al. [4], for instance) proposed variations on the method to correct for that boundary condition. The need to connect the electrode to the embedded rebar is also often deemed a limitation to the method compared to the FEM. Nonetheless, resistivity measurements are rarely deployed alone but in conjunction with the corrosion potential (ECORR) and corrosion rate (VCORR), which also call for connection to the reinforcement except in very specific cases [56–58]. Consequently, where a structure is intended to be assessed for corrosion, it is normally fitted with a channel for electrical connection to the steel, which elude that potential limitation to onsite application of the RDM.
2.1.4. CCM
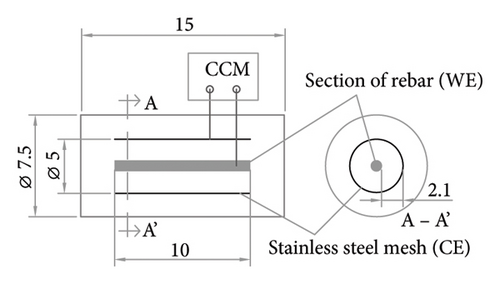
This method is based on a measuring cell proposed by Lakshminarayanan et al. [59], also described in [52], to determine resistivity in concrete specimens. As Figure 1(d) shows, this two-electrode cell consists in a section of embedded rebar of known length set inside a steel cylinder. The electrical resistance (RE) measured between the two electrodes by applying a high-frequency alternating current is converted to resistivity (equation (1)), defining the k factor as in the TEM, that is, k = S/L. Here, S is the cross-sectional area of the embedded rebar exposed to the concrete, and L is the distance to the cylindrical electrode. Similar to the TEM, the CCM is a method primarily designed for use in laboratory specimens, although it could also be applied to structures in new-builds if the electrodes are embedded in the structure during construction.
2.2. CSA
The method analysed in the present study, CSA, entails the use of a readily implemented embedded sensor consisting in just two electrodes: (i) a WE comprising a carbon steel element with a composition nearly the same as in the rebars; and (ii) a counter electrode (CE) consisting in the rebar itself in the area to be assessed in the respective structure. By incorporating a reference electrode into this setup, the corrosion rate can also be determined either by applying any of the more common techniques (such as LPR [42, 43]) or a novel technique that deploys potentiostatic pulses, described in detail in earlier papers [39, 44, 60, 61], so the description of the method in this section partly reproduces their wording. The sensor operating principle is illustrated in Figure 3, where a typical sensor configuration is shown as an example, that is a section of rebar acting as the WE and the rebars in the area of the structure involved surrounding the WE acting as CEs (CE = CE1 + CE2 + CE3 + CE4).
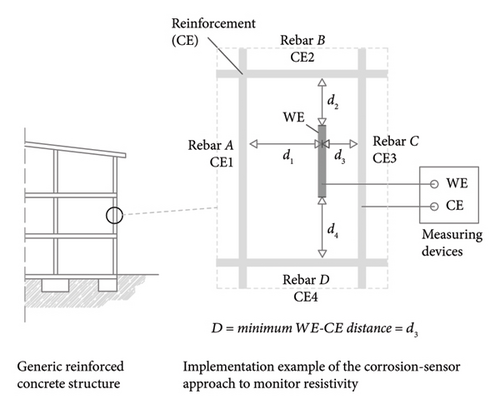
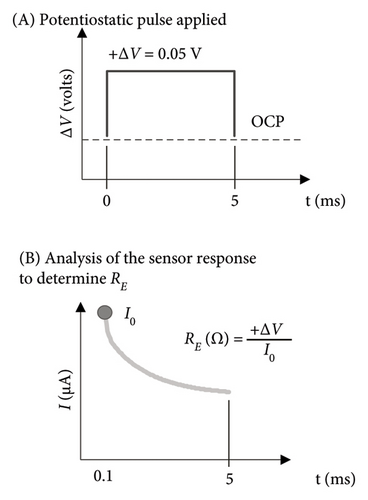
For a better understanding, a case study on the determination of the k cell factor for the CSA method is presented in Appendix A.
- •
Applying alternating current measurements (RE−AC) between the WE and the CE, using, as recommended by other authors [45, 62], a signal of 1 kHz excitation frequency.
- •
Further to the sensor’s response to application of a procedure based on the potential step voltammetry (PSV) technique (RE−PSV). As shown in Figure 3(b), a 5 ms ΔV = 0.05V potential step is applied, and the response is recorded as current intensity (I0) at t = 0.1 milliseconds (≈t ⟶ 0). Electrical resistance is found as RE−PSV = ΔV/I0.
RE−PSV measurement should be adopted in cases where the CSA is used with INESSCOM technology, for as the corrosion rate measurement is also based on the PSV technique, that option rules out any need to add further components to the electronic system. With the RE−AC measurement, the CSA method can be adapted to any sensor system with a measuring cell similar to the one shown in Figure 3(a).
3. Materials and Methods
3.1. Concrete Specimens
Specimens were prepared with two types of concrete with similar water/cement ratios (0.56–0.57) but different types of cement to cover a sufficiently wide range of resistivity values. Concrete-1, prepared with blended limestone cement (CEM-II/B-L), was deployed to cover the low to medium resistivity range, while Concrete-2, prepared with slag-bearing blended cement (CEM-III/C), was used to cover the high resistivity range. Siliceous aggregates were used. The detailed composition of concrete mix designs is given in Table 2.
| Mix | Cement type | Cement | Sand (0/4) | Gravel (4/12) | Water | w/c ratio |
|---|---|---|---|---|---|---|
| Concrete-1 | CEM II/B-L 32.5 N | 282 | 1017 | 872 | 162 | 0.57 |
| Concrete-2 | CEM III/C 32.5 N | 282 | 1017 | 872 | 158 | 0.56 |
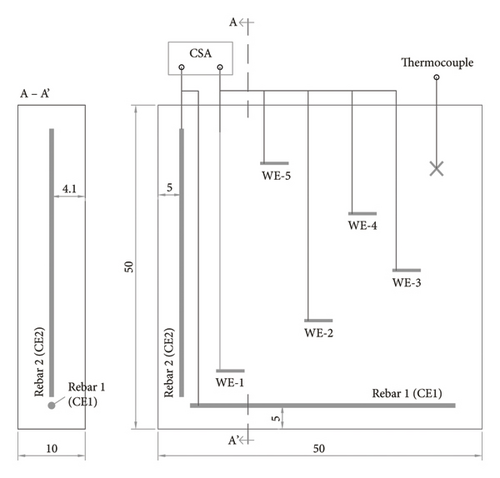
The specimen types prepared for the measuring methods described in Section 2 are illustrated in Figures 2 and 4. Prismatic 10 × 10 × 50 cm3 specimens were used for the methods TEM, FEM and RDM (Figures 2(a), 2(b), 2(c)), a 7.5 cm diameter, 15 cm high cylindrical specimen for the CCM (Figure 2(d)) and a 50 × 50 × 10 cm3 slab for the method to be validated, CSA (Figure 4). Three specimens were prepared with Concrete-1 and three with Concrete-2 for each method, with the exception of the method CSA, for which a single slab was manufactured with each concrete. The specimens so prepared were stored in a climatic chamber at 20 ± 2°C and 100% relative humidity for 24 h, after which they were demoulded and subjected to the different exposure conditions detailed in Section 3.2.
For the TEM, two square (8 × 8 cm2) stainless steel plates 6 mm thick were embedded in parallel and spaced at L = 40 cm (Figure 2(a)), a setup used previously by other authors [34, 63]. Here, S = 10 × 10 cm2 = 100 cm2, that is, the cross-section of the sample. In the FEM, the specimens were fitted with four 5.8 mm diameter, 2 cm long smooth stainless-steel bars embedded in the concrete and spaced at a = 3.5 cm (Figure 2(b)). In the RDM, an 8 mm diameter, 45 cm long corrugated stainless-steel bar was embedded at 5 cm from a 2 mm thick stainless-steel ring with an outer diameter of 2.45 cm and an inner diameter of 0.8 cm (Figure 2(c)). A pseudo-reference electrode made from a 1 mm diameter titanium wire activated with mixed-metal oxide (Ti-MMO) was positioned in the centre of the ring. In the CCM, the WE, an 8 mm diameter corrugated carbon steel bar embedded in the centre of the specimen, had a total SWE of 25.13 cm2, in as much as 10 cm of its length was exposed to the concrete. A stainless-steel mesh (0.14 mm wire diameter and 0.495 mm aperture) served as the CE, which was wrapped around the WE at a spacing of L = 2.1 cm (Figure 2(d)).
The slab used in the method CSA was fitted with two embedded rebars set at right angles and spaced at 5 cm from the respective sides of the specimen (Figure 4). The two rebars acted as separate and electrically insulated electrodes (CE1 and CE2) that could be interconnected via external wires to act jointly (CE=CE1 + CE2). As in both CE1 and CE2, the length exposed to the concrete came to 40 cm, SCE1 = SCE2 = 100.53 cm2. The five WEs installed were prepared with a section of rebar with the same composition as the CE, here exposed to the concrete along a length of 4.5 cm, whereby SWE = 11.31 cm2. The concrete cover at the top and bottom of the slab was 4.1 cm thick, in both the CEs and the WEs. A type K thermocouple was cast at 5 cm from the exposed concrete surface of the slab to record the inner temperature of the concrete in an area of the slab where it would not interfere with the other measurements.
| WE-CE1 distance d1 (cm) | WE-CE2 distance d2 (cm) | Minimum distance D (cm) | D/d1 | D/d2 | SCE1_EQ (cm2) Equation (6) |
SCE2_EQ (cm2) Equation (6) |
SCE (cm2) Equation (5) |
SEQ (cm2) Equation (3) |
|
|---|---|---|---|---|---|---|---|---|---|
| WE-1 | 5.5 | 5.0 | d2 = 5 | 0.91 | 1 | 91.39 | 100.53 | 191.92 | 10.68 |
| WE-2 | 19.5 | 13.5 | d2 = 13.5 | 0.69 | 1 | 69.60 | 100.53 | 170.13 | 10.60 |
| WE-3 | 33.5 | 22.0 | d2 = 22 | 0.66 | 1 | 66.02 | 100.53 | 166.55 | 10.59 |
| WE-4 | 26.5 | 30.5 | d1 = 26.5 | 1 | 0.87 | 100.53 | 87.35 | 187.88 | 10.67 |
| WE-5 | 12.5 | 39.0 | d1 = 12.5 | 1 | 0.32 | 100.53 | 32.22 | 132.75 | 10.42 |
In the CSA, the WEs were installed strategically to ensure different spacing from CE1 (WE-CE1 = d1) and CE2 (WE-CE2 = d2). Specifically, d1 = 5.5, 12.5, 19.5, 26.5 and 33.5 cm; and d2 = 5, 13.5, 22, 30.5 and 39 cm. The aim was to validate the CSA over a very wide range of WE-CE distances, while also envisaging the three most representative WE-CE setups: parallel (cell WE-CE1), perpendicular (cell WE-CE2) and both parallel and perpendicular (cell WE-CE1+CE2) (Figure 4). In the third case, equations (3), (5)–(7) would have to be applied as described in Section 2.2 to determine the sensor’s equivalent working area (SEQ), a parameter required to find the cell factor k (equation (2)). The findings for the cell WE-CE1+CE2 are given in Table 3. Where CE1 or CE2 were used separately (cells WE-C1 and WE-CE2), the SEQ would be found by applying equation (3) directly, giving an SEQ = 10.17 cm2.
All the 8 mm diameter corrugated carbon steel rebars embedded in the specimens were sealed at both ends with epoxy resin and set inside a polymeric tube to delimit the exposed area and protect the electrical connection to the copper wire installed at one of the ends. An epoxy resin-coated copper wire was also installed in all the other embedded steel electrodes (plates, meshes and discs) for the measurement.
3.2. Measuring Procedure
- •
Stage 1: The demoulded specimens were stored in a climatic chamber at 20 ± 2°C and 100% relative humidity for 28 days. This was the stage when the network of highly saturated concrete pores began to consolidate. The aim was to obtain low-to-medium range resistivity measurements.
- •
Stage 2: After removal from the chamber, the specimens were exposed to laboratory ambient conditions (T = 20 ± 2°C, RH = 43 ± 5%) for 84 days. As concrete pore saturation declined in this stage, the resistivity measurements were expected to lie in the medium-to-high range.
- •
Stage 3: The specimens were ultimately stored in an RH- and T-adjustable climatic chamber where they were exposed to varying temperatures, first at 47% and subsequently at 100% RH. At both RH values, the temperature cycle was divided into three ranges: 25°C–45°C, 45°C–5°C and 5°C–25°C. Temperatures were ramped at a rate of 5°C every 12 h. The possible effects of temperature and RH on resistivity measurements were analysed in this stage. By varying those two parameters, this stage was also intended to afford a wide range of resistivity measurements.
Resistivity measurements were taken in these stages as described in Section 2.1. In stages 1 and 2, readings were generally recorded twice a week. In stage 3, they were taken in the last half-hour of each 12 h interval at a constant temperature, on the assumption that by that time the inner temperature in the concrete had reached the steady state. In stage 3, the temperatures were deemed to be as recorded from the thermocouple embedded in the concrete slabs (Figure 4) using a Fluke 87V multi-metre.
In the methods TEM, CCM and CSA, the interelectrode electrical resistance (RE) needed to find resistivity (equation (1)) was determined on a Keysight Technologies U1733C handheld alternating current LCR metre operating with a sinusoidal wave of 1.05 V amplitude and 1 kHz frequency applied for 15 s. In the RDM, RE was found with an interrupted current galvanostatic pulse described elsewhere [18, 64], applying a pulse between 1 μA and 200 μA, depending on the concrete resistance, and 50 milliseconds in duration. In the method CSA, the potentiostatic pulse procedure proposed in Figure 3(b) was applied as an innovative alternative to determine RE.
In the FEM, RE was obtained from the current and voltage recorded at the outer and inner electrodes (Figure 2(b)), respectively, when an excitation 24 V sinusoidal signal at 1 kHz was applied for 15 s to the outer electrodes from the authors’ self-made power source that used a Vemer VN313300 TMD 15/24 transformer. Current was recorded on Fluke 87 V and voltage on RS PRO IDM73-IV multi-metres. This methodology, implemented with the four-electrode system illustrated in Figure 2(b), was calibrated prior to embedment against a Proceq Resipod commercial instrument on prismatic specimens with the same geometry and composition as the ones described in Section 3.1. The widest deviation recorded for any single measurement was 9%, while the mean was < 4%, results consistent with those reported in the literature [62].
In the case of TEM, FEM, RDM and CCM methods, the corresponding cell factors described in Section 2.1 have been considered. In the case of the CSA, the measurement and analysis procedure has been carried out according to Section 2.2.
Polarisation resistance (RP) was found from the slope on the linear region of the polarization curve resulting from applying a linear potential scan from open circuit potential (OCP) −0.02 V to OCP +0.02 V at a scan rate of 0.010 V/minute according to [66]. The OCP corresponds to the potential difference of WE1 with respect to the CE. The OCP used was the value found once the OCP stabilised (∂V/∂t ≤ 0.03 mV/s). The LPR technique was applied using a two-electrode cell configuration, where WE1 of the slab was used as the WE, and Rebar 1 (CE1) and Rebar 2 (CE2) were used together as the CE (Figure 4). As demonstrated in a previous study [42], this type of two-electrode cell provides reliable results when the CE area (SCE) is approximately 20 times greater than the WE area (SWE). This condition is closely met by the cell used in this study for the iCORR measurement, where SWE1 = 11.31 cm2 and SCE1+CE2 = 201.06 cm2, resulting in SCE1+CE2/SWE1 = 17.8.
The galvanostatic and potentiostatic techniques used to obtain the RE in the RDM and CSA methods, respectively, as well as the potentiodynamic technique applied to measure the RP used to determine the iCORR, were carried out using a Metrohm Autolab PGSTAT100 instrument, and the Nova 1.11 software was used for signal processing.
4. Results and Discussion
- 1.
Potentiostatic method for determining electrical resistance: analysis of the reliability of the modified potentiostatic (PSV) method proposed to measure electrical resistance (RE) in the CSA, comparing the readings to alternating current technique measurements.
- 2.
Reliability of cell factor values: study of the decrease in variability attained with the product RE ·k, that is, the result of applying the cell factor k proposed for the CSA to the RE measurement to find resistivity. Different sensor cells are used, taking into account possible variations when implemented onsite (electrode arrangement and spacing).
- 3.
Resistivity comparison: comparison of CSA resistivity measurements to reference technique results. The entire set of measurements (stages 1, 2 and 3) was analysed, covering a broad spectrum of resistivity values. Corrosion rate measurements obtained in stage 3 are also presented.
- 4.
Temperature calibration: assessment of how CSA-measured resistivity is affected by temperature (stage 3); the expression proposed to normalise the measurement to 20°C is geared in particular to use the procedure in laboratory concrete characterisation studies.
4.1. Potentiostatic Method for Determining Electrical Resistance
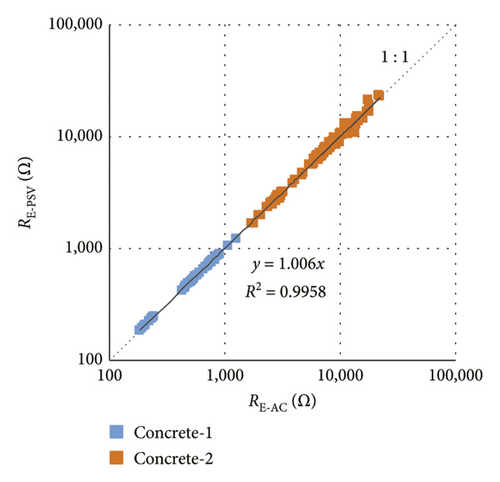
The reliability of the PSV method is discussed under this heading. Illustrated in Figure 3(b), PSV was deployed in the CSA to determine the concrete electrical resistance (RE) value to be entered in equation (1) to find resistivity. Figure 5 compares the PSV-determined RE (RE−PSV) to the values found with the alternating current technique (RE−AC) between each WE and CE (CE1 + CE2) in the measuring cell depicted in Figure 4 across the entire study period (stages 1, 2 and 3). As can be seen, Concrete-2 shows notably higher values than Concrete-1, which could be related to differences in porosity as a consequence of the type of cement used (Table 2). It is known that blast furnace slag cements, such as Portland cement type III used in Concrete-2, lead to the formation of denser microstructure within the cement paste matrix and therefore to a lower porosity [67], compared to the use of limestone cements [68], as is the case of Portland cement type II used in Concrete-1. In any case, the main objective of this section is to compare the two RE measurement techniques. As shown in Figure 5, the findings for the two approaches were found to be very closely and linearly correlated (R2 = 0.9958) when the two types of concrete (Concrete-1 and Concrete-2) were taken together, with no perceptible differences between the concretes in terms of the pattern observed in the linear correlation. A glance at the slope of the regression line shows that PSV yielded values about 0.6% higher than the alternating current technique. Given that practically negligible difference, the PSV technique was deemed to be wholly reliable for determining RE in the CSA.
4.2. Reliability of Cell Factor Values
The reliability of the CSA cell factor k as defined in equation (2), needed to convert RE into resistivity with equation (1), is studied under this heading. As discussed in detail in Section 2.3.1, the k value depends on certain measuring cell-related variables, including the spacing between the WE and CE, along with the equivalent working area of the sensor (SEQ).
The measuring set up used in the slab depicted in Figure 4 was designed to provide a sufficiently wide range of WE-CE distances in three representative WE-CE setups (Table 3): parallel (WE-CE1), perpendicular (WE-CE2) and joint (WE-CE1 + CE2). The k values for the five WEs (with different WE-CE spacing) in the three cell types (WE-CE1, WE-CE2 and WE-CE1 + CE2) are listed in Table 4.
| Cell type WE-CE1 | Cell type WE-CE2 | Cell type WE-CE1 + 2 | |
|---|---|---|---|
| WE-1 | 5.16 | 5.22 | 5.48 |
| WE-2 | 3.96 | 4.40 | 4.59 |
| WE-3 | 3.21 | 3.80 | 3.96 |
| WE-4 | 3.55 | 3.35 | 3.72 |
| WE-5 | 4.48 | 2.99 | 4.60 |
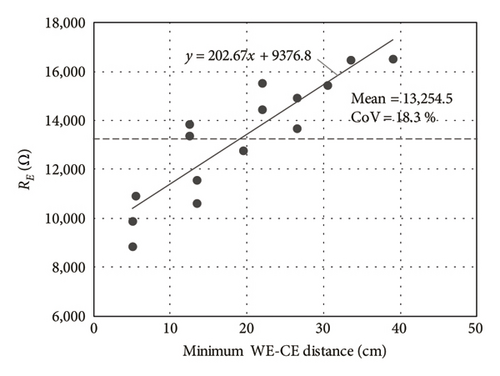
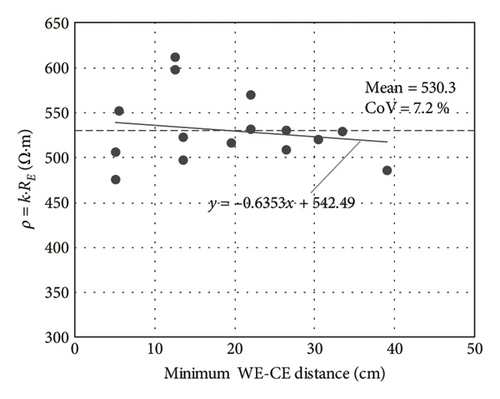
Figure 6 graphs the mean coefficient of variation (CoV) for the study period as a whole (stages 1, 2 and 3) when the aforementioned k values were applied to the RE readings in the respective cells (Table 4). Each of the mean CoV values in Figure 6 was obtained as , where n is the number of measurements made over the three stages; in this case, n = 66, and CoVi is the CoV obtained in each of these measurements for the five WEs (with different WE-CE spacing) in each cell type (WE-CE1, WE-CE2 and WE-CE1 + CE2), as well as considering as a whole the measurements with all cells (All). The CoVs for k·RE, that is, resistivity (ρ), were observed to be lower than for RE. As shown in Figure 7, which graphs the findings for one of the measurements, the RE reading was linearly related and directly proportional to the WE-CE distance. That geometric relationship declined to negligibility, as intended, when the k factor was applied to resistivity calculations (ρ = k·RE). That explains the lower CoV found for the ρ measurements in the cells (Figure 6).
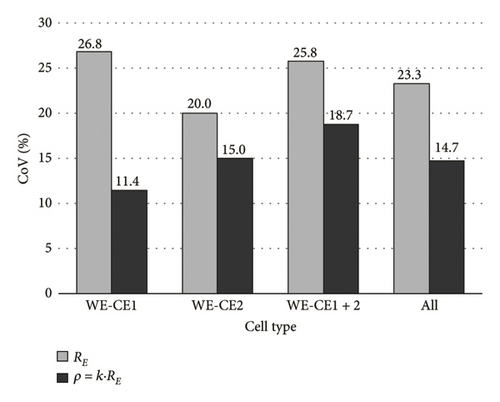
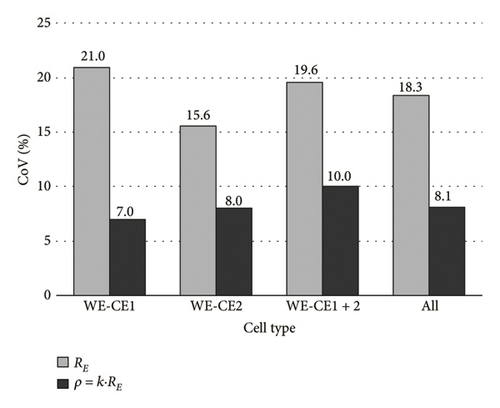
Further analysis of Figure 6 revealed that when all the measurements were obtained for all the cells studied (All), the CoV was 23.3% for RE and 14.6% for k·RE in Concrete-1 and 18.3% for RE and 8.1% for k·RE in Concrete-2. The inference is that measurements varied less widely in the higher resistivity concrete (Concrete-2). Although the CoVs obtained in the cells were similar within each concrete type, k·RE was observed to vary less in the parallel setup (WE-CE1), while the widest variation was found for the joint parallel and perpendicular setup (WE-CE1+CE2). In the latter case, in as much as cell type WE-CE1+CE2 entailed using a CE with more than one rebar, the sensor equivalent area (SEQ) had to be found from a series of parameters related to the WE-CE distance (Table 3). That greater number of variables in resistivity calculations would explain the wider variation observed in WE-CE1+CE2 cell measurements.
As a rule, ρ exhibited narrower variability in all the cells (≈8%–18%) than RE (≈16%–27%), confirming the normalisation capacity of the CSA cell factor k defined in equation (2). Since the measurements have been performed with different cells simulating the most typical in situ implementation configurations of the method, the variability found for resistivity could be reasonable.
4.3. Resistivity Comparison
The discussion in Sections 4.1 and 4.2 affords proof of the validity of the two main factors involved in CSA resistivity measurement, namely potentiostatic pulse-determined RE and cell factor k. On those grounds, the CSA can be reliably compared to the reference procedures.
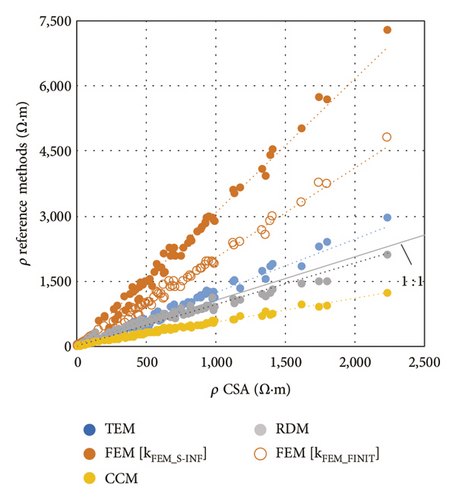
The correlation between ρ as computed with the CSA and the same parameter found with the reference methods across the entire study period is graphed in Figure 8(a). The regression analysis parameters obtained are given in Table 5. The entire set of measurements (stages 1, 2 and 3) are included in the analysis, covering a broad spectrum of resistivity values, that is, for the CSA values, between ≈5 and 2200 Ω·m, with the measurements of Concrete-1 lying between ≈5 and 150 Ω·m and those of Concrete-2 between ≈150 and 2200 Ω·m.
| Reference method | TEM | FEM [kFEM_S−INF] | FEM [kFEM_FINIT] | RDM | CCM |
|---|---|---|---|---|---|
| Slope | 1.2384 | 3.0808 | 2.0261 | 0.9722 | 0.5588 |
| R2 | 0.9902 | 0.9965 | 0.9965 | 0.9835 | 0.9956 |
While the CSA measurements were closely and linearly related to all the references (R2 = 0.9835–0.9965), the deviation found (as per the regression slope) exhibited significant differences. The RDM measurements were visibly the closest to the CSA values, with a mere 2.86% upward deviation in the latter. One meaningful similarity between the two procedures was the use of pulse-based techniques, potentiostatic in the CSA and galvanostatic in the RDM. In other words, both methods are based on direct current techniques that analyse the short-term transitory response in the steel-concrete system.
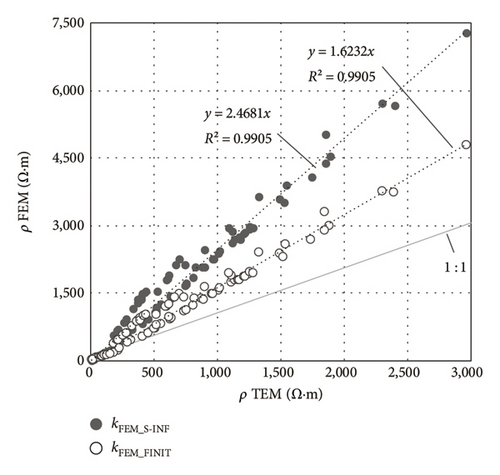
The deviation between the FEM resistivity measurements and the values found with the reference method for determining bulk resistivity, TEM (Figure 8(b)), [33, 46, 49], came to 147% and 62% in the case of considering kFEM_S−INF or kFEM_FINIT in the FEM, respectively. These figures are in line with the findings reported for these two techniques by other authors, such as Morris et al. [51], who observed a correction factor of 2.63 (163%); Gudimettla et al. [69] observed 1.91 (91%), and Ghosh et al. [49] observed ≈2.00–3.33 (≈100–233%). Such deviation might be the outcome of the known fact that the FEM measures surface resistivity [13, 48]. The deviation observed here in the FEM-CSA regression was as expected, for the CSA may be deemed to provide a measurement close to bulk resistivity in as much as it is taken with electrodes embedded in the specimen. Specifically, the CSA resistivity values were 20% lower than those recorded by the TEM. Compared to the CCM, the CSA tended to overestimate resistivity by 79%.
The inference to be drawn from the foregoing is the existence of considerable deviations among the resistivity measurements delivered by the reference methods themselves, depending on whether and to what extent such measurements address the two types of resistivity attributed to concrete. That in turn was the outcome of the type of study at issue: (i) bulk resistivity for laboratory studies of the properties of the cementitious matrix; or (ii) surface resistivity for onsite assessment of the reinforcement cover and therefore of corrosion risk. The CSA method proposed exhibited a close resemblance to the RDM, the reference procedure for onsite inspection of reinforcement cover resistivity. Although the FEM is also used in onsite measurements, the resistivity values found exhibited a substantial upward deviation relative to the CSA, especially if an appropriate geometric factor for finite elements is not used in the FEM. The TEM is the method of choice for laboratory studies, geared to studying the concrete matrix, although the CCM, for which no undue differences with the CSA were observed here, is also used in that context.
Despite the above discussion, it is worth noting the possibility that the deviations between methods could partially be affected by differences in the specimen size used for their implementation (Figure 2). This factor is known to influence the adsorption properties of the concrete samples [70, 71], so there might have been some differences in the internal moisture content of the samples (especially during Stages 2 and 3) and therefore some deviation in the resistivity by the different methods. A slight increase in the dispersion of values can be observed, starting at approximately 200 Ω·m, particularly in the FEM-TEM regression (Figure 8). This trend may be attributed to the greater dispersion of the electric field resulting from the lower conductivity of the medium [47], which would, to some extent, amplify the differences between methods, as has also been observed in the results reported by other authors [72].
Even so, the differences observed between methods may be deemed admissible, given the breadth of the resistivity ranges associated with corrosion risk of steel in concrete and the absence of any single criterion on the upper and lower values in each range [73]. For that reason, in practice, resistivity is assessed in conjunction with other parameters such as ECORR and/or VCORR, analysing its pattern over time for a more reliable assessment of the condition of concrete reinforcement. In this regard, it should be noted that a correlation between resistivity and these parameters, especially VCORR, is only to be expected under reinforcement depassivation conditions [12]. These conditions were not present in this study. Although resistivity values below 100 Ω m—associated with a high corrosion risk according to the criterion in Table 1—were reached in the case of Concrete-1, corrosion activation of the reinforcement is not expected due to the absence of a depassivating agent (chloride ions and/or carbonation of concrete). This can be verified in Table 6, which presents the VCORR values (expressed as current density, iCORR, in μA/cm2) for WE1 of the slabs (Figure 4), along with the resistivity values obtained using the CSA method under the various humidity and temperature conditions considered in stage 3. The values shown in Table 6 are the averages of two determinations performed for each temperature, except for 5°C and 45ºC, where only one determination was conducted, and for 25°C, where three determinations were performed. In all cases, the iCORR is clearly below the depassivation threshold of 0.1 μA/cm2 established by the UNE 112072 standard [74] and the RILEM recommendation [75], including the most unfavourable case of Concrete-1 at 100% RHENV and a test temperature of 45°C, where, despite a resistivity of 17.8 Ω·m, indicating a high corrosion risk, the iCORR obtained was 0.087 μA/cm2.
| RHENV (%) | Test temperature (°C) | Concrete-1 | Concrete-2 | ||
|---|---|---|---|---|---|
| iCORR (μA/cm2) | ρ CSA (Ω·m) | iCORR (μA/cm2) | ρ CSA (Ω·m) | ||
| 47 | 5 | 0.036 | 71.3 | 0.013 | 1568.0 |
| 10 | 0.037 | 61.0 | 0.014 | 1315.0 | |
| 15 | 0.036 | 52.6 | 0.014 | 992.6 | |
| 20 | 0.037 | 46.2 | 0.014 | 795.4 | |
| 25 | 0.038 | 39.6 | 0.016 | 623.3 | |
| 30 | 0.038 | 33.1 | 0.019 | 492.4 | |
| 35 | 0.040 | 30.0 | 0.025 | 398.1 | |
| 40 | 0.047 | 26.7 | 0.032 | 344.0 | |
| 45 | 0.058 | 24.5 | 0.042 | 270.9 | |
| 100 | 5 | 0.047 | 51.4 | 0.009 | 1470.8 |
| 10 | 0.050 | 45.5 | 0.010 | 1165.4 | |
| 15 | 0.051 | 38.7 | 0.011 | 920.6 | |
| 20 | 0.054 | 33.7 | 0.011 | 743.0 | |
| 25 | 0.055 | 29.5 | 0.012 | 585.3 | |
| 30 | 0.056 | 25.2 | 0.016 | 451.3 | |
| 35 | 0.062 | 22.7 | 0.020 | 375.1 | |
| 40 | 0.080 | 20.6 | 0.022 | 308.1 | |
| 45 | 0.087 | 18.7 | 0.028 | 259.6 | |
4.4. Temperature Calibration
Resistivity is affected by different factors that are difficult to control in situ, such as temperature, humidity or the penetration of aggressive agents into the porous network. Among them, temperature is the reference parameter when establishing resistivity calibrations and normalisations [76–79], as it is an easily measurable parameter. The impact of temperature on CSA-measured resistivity was studied in stage 3 to define a temperature correction factor that might enhance the precision of the method, especially in the case of laboratory studies on material properties.
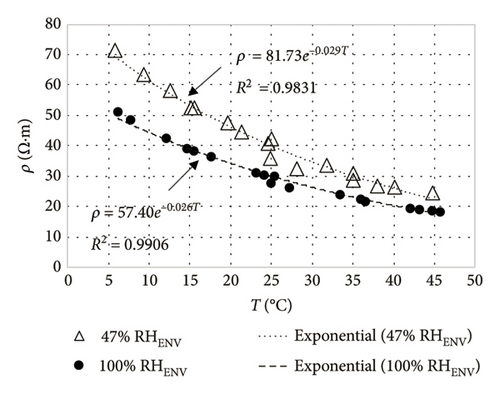
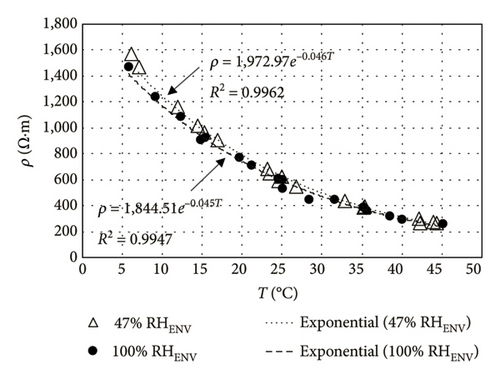
The resistivity measurements found with the method CSA at environmental exposure relative humidity (RHENV) of 47% or 100% are plotted against temperature in Figure 9, where resistivity is shown to decline exponentially with rising temperature. Whereas in Concrete-1, the ρ versus T relationship was affected by RHENV, with rises in relative humidity inducing declines in the ρ values (Figure 9(a)), and in Concrete-2, the ρ versus T curve was not significantly modified by RHENV (Figure 9(b)). The explanation would lie in the lower capillary porosity in Concrete-2 than in Concrete-1, which follows from the discussion provided in Section 4.1 about the RE results shown in Figure 5. Therefore, the moisture content in the Concrete-1 pore structure, and therefore its resistivity, would be more susceptible to changes in environmental RH. Least squares-fitting of the experimental ρ versus T curves (Figure 9(a)) for Concrete-1 yielded the exponential functions shown in equation (10) (47% RHENV) and (11) (100% RHENV). The analogous expressions calculated for Concrete-2 (Figure 9(b)) are given as equations (12) and (13).
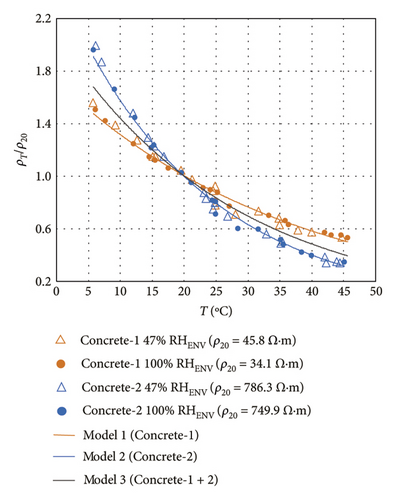
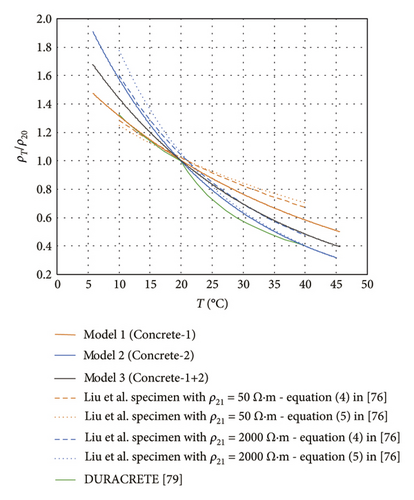
The correlation pattern differed slightly in Concretes-1 and -2, although no significant differences were observed between the values for 47% and 100% RHENV within a given concrete type. Hence, the three exponential models are envisaged in Figure 10: model 1 for Concrete-1, model 2 for Concrete-2 and model 3 for Concrete 1 + 2 measurements. The parameters found by least squares-fitting of the experimental ρT/ ρ20 versus T curve (Figure 10(a)) as per the general expression given in equation (14) are listed in Table 8. While the correlation found was high in all three models, the lowest R2 value found, as expected, was for model 3 (0.9368), where the dataset comprised all the measurements.
| Exponential model | Experimental data considered | Model parameter | |||
|---|---|---|---|---|---|
| Concrete type | RHENV condition | a | b | R2 | |
| Model-1 | Concrete 1 | 47 and 100 | 1.7251 | 0.027 | 0.9850 |
| Model-2 | Concrete 2 | 47 and 100 | 2.4851 | 0.046 | 0.9952 |
| Model-3 | Concretes 1 and 2 | 47 and 100 | 2.0687 | 0.036 | 0.9368 |
Figure 10(b) compares the ρT/ρ20 versus T curves for models 1, 2 and 3 to the curves reported in the DuraCrete project [79] and the ones calculated by Liu and Presuel-Moreno [76] for specimens with ρ21 = 50 Ω·m and 2000 Ω·m, determined from activation energy (J/mol). That parameter was found by applying one of two equations depending on the mix properties: for concretes containing ≥ 20% fly ash and > 50% slag (equation (4) in [76]) and for materials bearing < 20% fly ash and ≤ 50% slag (equation (5) in [76]). The curves obtained by Liu and Presuel-Moreno for the two calculation procedures proposed did not appear to deliver any significant differences for a given specimen. Models built for concretes with approximately the same resistivities yielded very similar results. In other words, model 1, which used Concrete-1 with a ρ20 of 34.1 Ω·m to 45.8 Ω·m (Table 7), yielded curves closely resembling Liu et al.’s for a specimen with ρ21 = 50 Ω·m, whereas the curve resulting from model 2, using Concrete-2 with ρ20 = 749.9 Ω m to 786.3 Ω·m (Table 7), was similar to the Liu et al. curves for a specimen with ρ21 = 2000 Ω·m. As model 3 was derived from measurements for both Concrete-1 and Concrete-2, the results followed an intermediate pattern. Two trends can be distinguished in the DuraCrete model. At temperatures > 20°C, the DuraCrete ρT / ρ20 values were similar to the results for low resistivity concretes (model 1 and Liu et al. ρ21 = 50 Ω m specimens), whereas at temperatures < 20°C, the DuraCrete ρT / ρ20 values came close to the findings for high resistivity concretes (model 2 and Liu and Presuel-Moreno ρ21 = 2000 Ω m specimens). The findings discussed in this paragraph confirm the reliability of the ρT / ρ20 values used in the models (1, 2 and 3) built in this study.
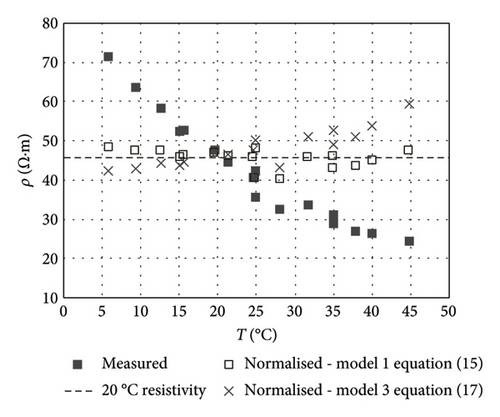
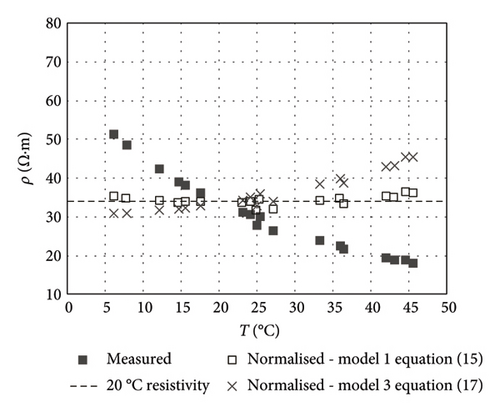
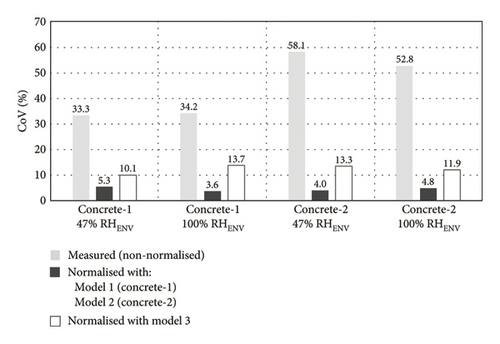
The three aforementioned equations are proposed to calculate CSA-measured resistivity normalised to 20°C (ρ20). The measured and normalised resistivity values found with equations (15)–(17) are compared in Figure 11. The most consistent normalisation was found for each concrete by applying the model built with the measurements taken with that material, as expected and as confirmed by the comparison of the CoVs graphed in Figure 12. The CoV for Concrete-1, at 33.3% (47% RHENV) and 34.2% (100% RHENV) prior to normalisation, declined to 5.3% and 3.6% after applying model 1. In Concrete-2, the CoV of 58.1% (47% RHENV) and 52.8% (100% RHENV) for non-normalised measurements dipped to 4.0% and 4.8% in model 2. Model 3 brought the CoV down to 10.1% and 13.7% for Concrete-1 and 13.3% and 11.9% for Concrete-2. As expected, model 3 normalised less effectively than models 1 and 2. Nonetheless, the error committed (CoV ≈ 10%–14%) in estimating the respective value would be admissible, given the wide range of resistivity values associated with the corrosion risk and the absence of a clear consensus on the upper and lower thresholds for each range [11, 12]. The lesser reliability of model 3 would in any event be offset by its applicability to any reinforced concrete member regardless of mix composition and the environmental exposure RH conditions to which it may be exposed.
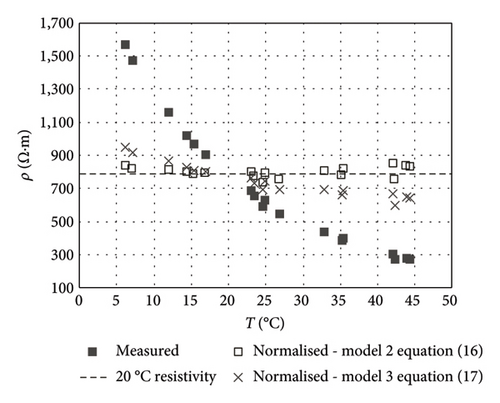
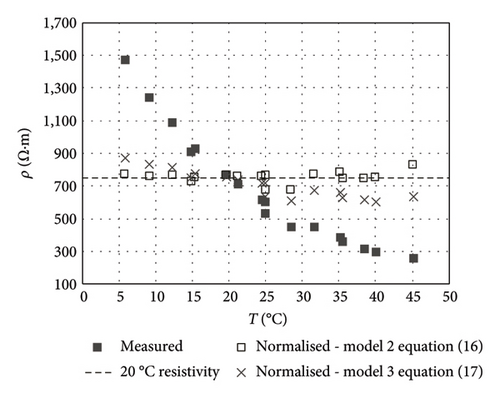
It should be noted that the normalisation capability of the proposed models has been evaluated here by applying them on the values used for their construction. Consequently, further work is needed to address more comprehensive validations.
4.5. Proposal for Estimating Resistivity
The study discussed in this paper aimed to validate the proposal for measuring resistivity with the CSA method, both for monitoring existing structures in the field and characterising materials in the laboratory.
Further to the proof provided in Section 4.2, applying the k factor lowered the CoV associated with the use of different electrode setups in the CSA sensor from ≈16% to 26% for RE to ≈ 8%–18% for RE ·k. To avoid unnecessary complexity in SEQ calculations, the WE should be set as close as possible to one of the rebars (the CE) at a sufficient distance D to ensure that the concrete fully covers the electrodes but, as previously stated in [44], at least six times that distance away from all the other rebars in the member. Wherever possible, the WE should be positioned parallel to the rebar acting as the CE, for i.e. the arrangement for which the CoV was observed to be lowest. In cases where the reinforcement arrangement prevents these conditions from being met when installing the sensor (e.g., in densely reinforced structures), all bars located at a distance from the WE ≤ 6⋅D will be considered in SCE determination (equation (6)), where D is the shortest distance between the WE and the closest CE bar. If two or more CE bars are at the same distance from the WE, they will be considered as a single bar (CE-i), whose area (SCE−i in equation (6)) is the sum of the areas of these bars.
In order to implement the proposed correction of the temperature effect, it is sufficient to incorporate a thermocouple to the CSA measurement cell, which is really simple and inexpensive. In fact, temperature recording is a common practice in structural health monitoring [29], thus facilitating the interpretation of the other monitored parameters. Of particular interest are material property studies that generally compare the performance of different concretes or dosages under standard conditions; being able to normalise resistivity measurements to the value at a temperature of 20°C using the factor proposed (equations (21) and (22)) constitutes a considerable advantage.
5. Conclusions
- •
Resistivity can be determined using either the alternating current or the PSV technique, with differences between the two methods being minimal (less than 0.6%). The potentiostatic technique may be preferable in practical applications, as it can be more easily integrated with corrosion rate measurements within a unified testing procedure.
- •
The cell factor k depends primarily on specimen geometry, electrode size, arrangement and spacing. This factor is determined numerically, without the need for experimental calibration tests. To avoid unnecessary complexity calculations, the sensor should be positioned either parallel or perpendicular and as close as possible to one of the rebars, keeping the rest of the rebars at least 6 times the distance.
- •
CSA resistivity values were broadly consistent with those provided by established reference techniques. In particular, the CSA showed only a 2.9% deviation from the RDM, the most consistent among onsite procedures. Although larger differences were observed with other methods (e.g., −20% vs. TEM, +79% vs. CCM and 103%–208% vs. FEM depending on the cell factor), these deviations fall within the range typically reported between standard methodologies in other experimental studies.
- •
The influence of temperature on CSA resistivity measurements was consistent with trends reported in the literature. To account for this, a correction expression is proposed to normalise values to 20°C: ρ20 = ρT · 1/(a·exp(b·T)), where ρT is the resistivity at temperature T. Parameters a and b were 1.7251 and 0.027 for low-resistivity concretes and 2.4851 and 0.046 for medium- to high-resistivity concretes, respectively. A general model suitable for the full resistivity range studied was also defined (a = 2.0687 and b = 0.036). This standardisation facilitates reliable comparisons under consistent conditions, though further validation is needed for broader application.
- •
A simplified expression, ρ = RE · SWE/1.7339, is proposed to estimate resistivity in situ with the CSA method in real-life structures. In this case, the sensor should be placed parallel to one of the rebar, and the distance between them should be as small as possible, ensuring that the sensor is suitably concrete-covered.
- •
The CSA sensor uses a single cell to measure not only resistivity but also corrosion potential and corrosion rate, the latter obtainable via the potentiostatic pulse procedure developed by the authors or standard methods such as LPR. As it enables continuous and remote real-time monitoring, the sensor is well-suited for long-term use in areas that become inaccessible after construction.
- •
Further research is needed to expand the application of the CSA method to reinforcement depassivation scenarios not covered in this study. Only under such conditions can the accuracy of resistivity measurements for corrosion assessment be compared with corrosion potential and corrosion rate techniques.
Conflicts of Interest
The authors declare no conflicts of interest.
Funding
This research was supported by the Ministry of Economy and Competitiveness (Ministerio de Economía y Competitividad) of Spain [PID2020-119744RB-C21 and PID2020-119744RB-C22] and the Universitat Politècnica de València [SP20180245].
Acknowledgements
The authors gratefully acknowledge the invaluable assistance provided by Ana Labanda Navas and Isaías Benjamín Gonzalo, CSIC-IETcc laboratory technicians, in the experiments conducted.
Appendix A: Case Study for CSA Cell Factor Determination
In this Appendix, a case study is presented illustrating the process of determining the k cell factor of the CSA method for implementation in a hypothetical reinforced concrete slab specimen, whose schematic is shown in Figure A1. The embedded electrodes of the CSA sensor consist of i) a set of seven rebars forming the specimen’s reinforcement, acting together as the CE, and ii) a shorter rebar section with identical characteristics to the specimen’s reinforcement, acting as the WE. As usual, the rebars comprising the CE are in physical and, therefore, electrical contact with each other, while the WE is electrically isolated from the CE.
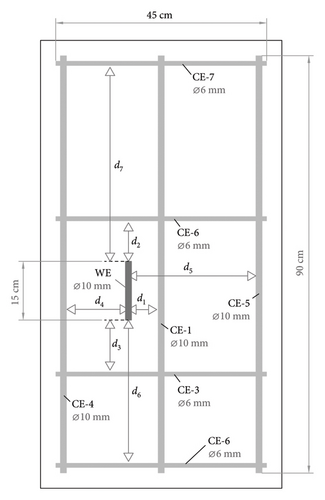
The five phases required to determine the k cell factor associated with the implementation of the CSA method shown in Figure A1 are described below. The sequence of steps and the results obtained during the process are summarised in Table A1.
| Phase | Parameter | CE | WE | ||||||
|---|---|---|---|---|---|---|---|---|---|
| CE-1 | CE-2 | CE-3 | CE-4 | CE-5 | CE-6 | CE-7 | |||
| A.1 | Diameter, Ø (cm) | 1.0 | 0.6 | 0.6 | 1.0 | 1.0 | 0.6 | 0.6 | 1.0 |
| Length, L (cm) | 90 | 45 | 45 | 90 | 90 | 45 | 45 | 15 | |
| WE-CEi distance, di (cm) | d1∗ | d2 | d3 | d4 | d5 | d6 | d7 | — | |
| 6 | 8 | 10 | 13 | 26 | 30 | 42 | |||
| di/D | 1 | 1.3 | 1.7 | 2.2 | 4.3 | 6 | 7 | — | |
| CE-i to be considered? (di/D ≤ 6) | Yes | Yes | Yes | Yes | Yes | Yes | No | — | |
| A.2 | WE area, SWE (cm2)∗∗ | — | — | — | — | — | — | — | 47.1 |
| A.3 | CE-i area, SCE−i (cm2)∗∗ | 282.7 | 113.1 | 113.1 | 282.7 | 282.7 | 113.1 | — | — |
|
282.7 | 69.4 | 47.5 | 76.0 | 23.4 | 7.3 | — | — | |
|
SCE_EQ = SCE−1_EQ + SCE−2_EQ + SCE−3_EQ + SCE−4_EQ + SCE−5_EQ + SCE−6_EQ = 282.7 + 52.0 + 35.6 + 76.0 + 23.4 + 5.5 = 475.2 cm2 | — | |||||||
| A.4 |
|
||||||||
|
|
||||||||
|
|||||||||
| A.5 |
|
k = (42.9 cm2/0.0427·6 cm + 1.7339) = 0.215 | |||||||
|
ρ(Ω·m) = RE(Ω)·0.215 | ||||||||
- ∗Assumed as parameter D.
- ∗∗Calculated by applying π·Ø·L.
Determination of basic geometric parameters of the sensor cell, which involves determining the diameter (Ø) and length (L) of the WE, as well as of each of the bars (CE−i) that form the CE. It is also necessary to determine the distance of each CE−i from the WE (di), as illustrated in Figure A1.
The CE bars are numbered based on their distance from the WE (di) (from smallest to largest). The distance of the closest bar is established as the reference minimum distance (D), that is, bar CE−1 with d1 = D = 6 cm. In the subsequent phases, CE bars whose distance from the WE (di) exceeds six times D are not considered, that is, di/D > 6. This is the case for bar CE−7 (d7/D = 7).
-
Calculate the area of each of the considered CE-i bars (SCE−i) by applying
(A.2) -
where ØCE−i and LCE−i are the diameter and length of the corresponding CE-i bar, respectively, in cm.
-
Calculate the equivalent area of each CE−i (SCE−i_EQ) based on the parameter SCE−i as follows:
(A.3) -
where the constant k3 has a value of 1.7.
-
Determine the total equivalent area of the CE (SCE_EQ), which is obtained by summing the equivalent areas of the various CE−i (SCE−i_EQ):
(A.4)
- •
If SCE_EQ/SWE < 12:
(A.5) - •
If SCE_EQ/SWE ≥ 12:
(A.6)
Open Research
Data Availability Statement
The data that support the findings of this study are available from the corresponding author upon reasonable request.


