Combining GPR, Passive Seismic, and Load Testing With Computational Models in the Assessment of Historical Bridges: The Case Study of the Comboa Bridge
Abstract
The preservation of historical bridges usually requires extensive structural evaluations for possible damage detection. Therefore, effective techniques are essential for diagnosis and, consequently, proper maintenance and rehabilitation actions. The combination of techniques provides complementary data that support decision making. A complete assessment was applied in the study of the Comboa Bridge, a medieval masonry structure in river Verdugo, in Galicia (Spain). It has three irregular arches, and the first visual inspection denotes the existence of important cracking and vegetation in the stonework. One of the most representative nondestructive testing (NDT) techniques for in situ evaluation is ground-penetrating radar (GPR) that offers detailed insights into subsurface conditions, revealing information about materials, voids, and deterioration, while loading tests and passive seismic methods provide dynamic responses that are related to type of structure and possible damage. This method was combined with loading tests to obtain deflections of the bridge deck and passive seismic for analyzing the dynamic behavior. Moreover, 3D models of the structure were set up using light detection and ranging (LiDAR), performed with terrestrial laser scanning, and unmanned aerial vehicle (UAV) surveying. By combining 3D models with NDT techniques, the results provide comprehensive information that enhances the understanding of a bridge’s condition and safety. These results are used for calibrating the dynamic computational model of the structure in order to obtain the vibration modes. Each technique used in the study presents limitations, which are addressed and discussed herein. Furthermore, the site conditions can also affect the results, as the effectiveness of these methods can vary greatly, depending on the materials and structures, which influences the electromagnetic and mechanical wave propagation. Additionally, the frequency of the waves may not effectively mark all relevant structural features or smaller damage. When used together, the NDT methods can complement each other’s strengths, but challenges remain. Overall, while these techniques are valuable tools for assessing historical bridges, awareness of their limitations is crucial for accurate interpretation and effective decision making in preservation efforts. The results obtained in the Comboa Bridge demonstrate improved accuracy in identifying structural anomalies. Additionally, recommendations to overcome some of these challenges in case of historical bridge assessment and also for the continuous monitoring and adequate maintenance actions to preserve the bridge integrity and safety are presented.
1. Introduction
The preservation of historical structures, such as medieval bridges, poses significant challenges due to their fragility and susceptibility to degradation over time. These structures, often built with ancient techniques and materials, require careful analysis to ensure their longevity while respecting their historical and cultural value. Nondestructive testing (NDT) methods play a crucial role in this endeavor by enabling the detection of internal damage, assessing the current state of conservation, and providing valuable data for informed decision making. Furthermore, advanced NDT techniques allow for the creation of detailed three-dimensional models of the structures, which are essential for documentation, preservation planning, and effective restoration efforts. However, while NDT techniques offer invaluable tools for the assessment and preservation of historical structures, they are not without limitations [1, 2]. One primary challenge lies in the depth of penetration and resolution of certain methods, which may restrict the ability to detect fine or deeply embedded defects. Another significant limitation is the adaptability of NDT techniques to the irregular and unique characteristics of historical structures. Many medieval bridges, for example, are composed of a combination of materials, such as stone, mortar, filling material, and timber, which may interact differently under specific testing conditions. This variability can complicate the analysis and limit the accuracy of the results. Moreover, the implementation of NDT methods can sometimes be hindered by accessibility issues, especially in large or intricately designed structures where certain areas are difficult to reach without scaffolding or specialized equipment. The cost and time associated with some advanced techniques, such as 3D scanning or ground-penetrating radar (GPR), can also pose constraints, particularly in projects with limited budgets or tight deadlines. Finally, while NDT aims to avoid causing damage, some techniques, like those involving contact sensors or heavy equipment, may inadvertently affect fragile surfaces or materials. These limitations underline the importance of carefully selecting and combining appropriate NDT methods while complementing them with other investigative approaches to achieve a comprehensive understanding of the structure. Additionally, the results of NDT often require expert interpretation [3], as the data obtained can be complex, ambiguous, or influenced by factors such as material heterogeneity or environmental conditions. The primary cause of ambiguity in NDT data interpretation arises from the inverse problem. This refers to the challenge of deducing the internal properties, defects, or features of a structure based on indirect measurements, such as wave propagation, electrical signals, or thermal responses. The inverse problem is inherently ill-posed in many cases, meaning that small changes in the measured data can correspond to vastly different internal conditions, making the interpretation of results nonunique or uncertain. It must be considered that these techniques are based on the measurements of physical data on the surface of the medium, inferring the internal characteristics of the structure. The difficulty in this process lies in the factor that multiple internal configurations can produce similar measurement results. For instance, a void and a crack may both reflect ultrasonic waves in a comparable manner, making it difficult to distinguish between them. Another difficulty lies in the impossibility of obtaining data from the whole structure. NDT techniques often provide limited or localized data due to constraints in sensor placement, material accessibility, or penetration depth. These incomplete data can result in ambiguities in the reconstruction of the internal structure. The difficulty increases in field studies because of noise; measurements are subject to noise from environmental factors, equipment limitations, or operator errors. This noise can obscure subtle features and introduce further uncertainty into the interpretation. Finally, in the particular case of historical structures, the heterogeneity of materials and the lack of constructive information and documentation can prevent the accurate interpretation of complex signals. To reduce the ambiguity and obtain proper interpretations of data, it is useful to utilize the combination of multiple NDT methods [4], such as ultrasonic testing with GPR, to provide complementary data and reduce ambiguities. In addition, advanced numerical simulation can also help in the data interpretation [5] because computational models simulate the forward problem. The experimental data are used to calibrate the numerical models, iteratively refining interpretations. These models could be also used in prediction of damage and behavior of the structure.
The case presented in this paper is the combined study of the Comboa Bridge, with the application of NDT techniques: GPR, passive seismic, low-weight deflectometer, light detection and ranging (LiDAR) and unmanned aerial vehicle (UAV) inspection, and computational models. The main remarks are the results and analysis of a medieval bridge using the combination of different NDT techniques and numerical models, remarking strengths and challenges.
1.1. The Comboa Bridge
The Comboa Bridge is a medieval bridge located in Galicia, Spain, crossing the Verdugo River in the Council of Soutomaior (province of Pontevedra) (Figure 1). This bridge is a remarkable example of medieval engineering and is deeply tied to the history of the region, serving as a vital connection for pilgrims, travelers, and merchants in historical times. Over the centuries, the bridge has become a symbol of the region’s rich history and resilience. It has witnessed countless historical events and changes in the surrounding landscape. Today, it stands as a testament to medieval engineering representing an important historical and architectural value.
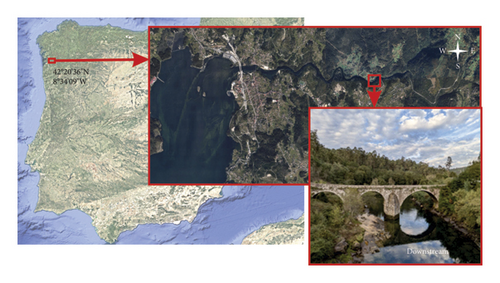
The exact date of construction is not fully documented, but it is believed to have been built during the Middle Ages, likely between the 12th and 14th centuries. During this period, bridges were essential for facilitating trade, communication, and movement across rivers, particularly in a region like Galicia, which has a complex network of waterways. It is believed that this bridge played a significant role in the regional infrastructure, connecting rural areas to urban centers and serving pilgrims traveling to Santiago de Compostela, one of the most important religious destinations in medieval Europe.
The bridge reflects typical medieval construction techniques, emphasizing durability and functionality. It was constructed using local stone, such as granite, known for its strength and availability in the region. The use of stone ensured the structure’s resilience against the strong currents of the Verdugo River. Its structure is based on a multiarched design, characteristic of medieval bridges. It spans 64.5 m in length and 3 m in width and consists of three arches: two semicircular and the largest one, with a 16.9 m span, slightly pointed. This is a typical feature of medieval bridges, reflecting Romanesque and Gothic styles. This type of structure distributes the weight of the bridge and allows for the passage of water during floods. The foundations and piers are built to withstand the force of the river, often reinforced with cutwaters (triangular projections) to reduce water resistance on both sides. The voussoir stones are carefully cut and placed to form the arches, with a keystone at the center to lock the structure in place and the deck is slightly inclined to allow rainwater to drain away efficiently, reducing wear over time.
1.2. Visual Analysis
The bridge has been renovated several times, being the only bridge in this zone and used by people and vehicles until 1980, when a modern bridge was built parallel to it. The last restoration took place in 2019. Part of the tasks consisted of cleaning the bridge with nonabrasive products and removing the asphalt layer that covered the roadway. A new gravel pavement was installed to ensure complete integration with its esthetic, and the original drainage system of the bridge was restored by utilizing its existing drains, incorporating a symmetrical 1% cross slope into the new pavement.
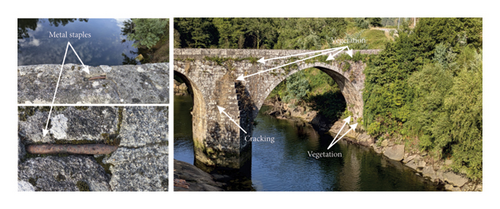
As shown in Figure 2, a preliminary visual inspection reveals damage in certain areas of the bridge, the presence of vegetation, and previous restoration elements, such as metal staples connecting the ashlar blocks.
2. NDT Assessment: Methodologies Used in the Comboa Bridge
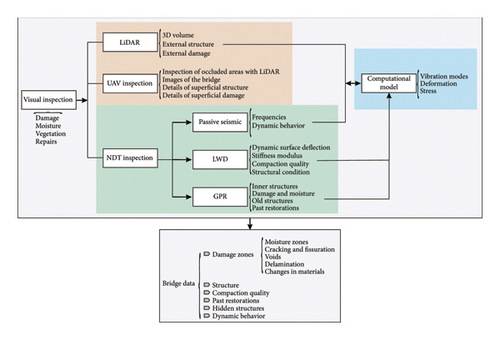
The study methodology consists mainly of three parts. First, a visual survey of the bridge and surface damage assessment is conducted using visual inspection, LiDAR scanning, and UAV assessment. The outcome of this phase is a detailed three-dimensional model of the structure. Second, the bridge is investigated using NDT techniques, including GPR, passive seismic testing, and falling weight deflectometer (FWD) measurements. The results from these tests provide valuable information about the internal structure, potential hidden defects, and the bridge dynamic behavior. Finally, the 3D model and the data obtained from the NDT methods are used to develop a computational model of the bridge, which allows for the analysis of its dynamic structural response. The procedure is schematized in the diagram of Figure 3.
2.1. GPR Survey
GPR is a noninvasive geophysical method widely used in different areas as archeology, civil engineering, forensics, and others. Particularly, it is used in the assessment of historical structures (e.g., [6]) to determine the state of conservation and to investigate the inner features and arrangement. One of the applications focuses on the assessment and preservation of historical bridges [7]. Its primary purpose is to provide detailed information about the subsurface structure and materials without causing damage to the bridge itself. Despite certain limitations, it is a versatile and effective tool that complements other methods like visual inspection, coring, and other nondestructive techniques, ensuring the longevity and safety of these culturally remarkable structures [8]. It is useful to detect changes in the materials used in the construction, for example, detecting the contact between the external ashlar stones and the inner mortar. In addition, the method is also capable of detecting damage inside the structure, such as cracks, voids, delamination, or moisture, and detecting metallic elements used, in many cases, in old restorations (staples, anchors, rebar, reinforcements, etc.) [9–13]. However, GPR could be used not only for detecting subsurface anomalies associated to changes in materials and damage but also for revealing additional characteristics of buried structures. For example, GPR can help identify former architectural shapes such as ancient arches, wall foundations, or floor patterns that are no longer visible on the surface. These insights can be crucial in archaeological and historical investigations, allowing researchers to reconstruct past layouts and understand the evolution of a site over time.
The method operates by emitting high-frequency electromagnetic waves into the structure. These waves propagate through materials and reflect back to the surface when encountering interfaces with different electromagnetic properties (for example, in the case of stones and voids, or metallic elements inside the structure). A receiver antenna records the returning signals that are later processed to generate images or maps of the subsurface features. Both antennas, transmitter and receiver, are usually placed on the surface of the structure. The methodology presents several advantages compared with other NDT techniques. One of the main advantages is that the method is completely noninvasive and allows assessing the structure without causing any physical damage, preserving both the bridge’s integrity and its historical character. In addition, it is a suitable complementary method of the visual inspection of other diagnostic methods because it provides detailed subsurface information. On the other hand, GPR can be applied to a large number of materials and conditions of the structure, including stones, mortar, concrete, and bricks (e.g., [14]), and it enables fast surveys over large areas, which is critical in minimizing disruption to traffic or public use. However, the method presents also limitations that must be considered [15]. One of them is the dependence on the electromagnetic properties of materials. In some cases, penetration depth is highly limited when the conductivity of the medium increases as a consequence of the strong attenuation of the propagated signal. This fact hinders the study of media affected by high water content and salinity. Related to the attenuation, other possible limitation is the penetration depth because it limits the survey and the studied zone. Another difficulty is related to the interpretation of the data in the case of complex media because the images obtained in the survey can be confusing and difficult to interpret [16]. Data acquisition could also be complicated in the case of narrow areas, high structures, or vertical walls that make accessibility difficult.
2.2. Passive Seismic and Horizontal to Vertical Spectral Ratio (HVSR)
Passive seismic methods are geophysical techniques that use naturally occurring vibrations to analyze the properties of structures. These vibrations are ambient vibrations from natural sources (wind, water currents, and microtremors) and human activity (traffic, machinery, and pedestrians). These vibrations propagate as seismic waves and are recorded with a seismometer placed on the surface. In the context of structural assessment, particularly in historical bridges, passive seismic techniques are invaluable because they are noninvasive, cost-effective, and capable of providing essential data without causing harm to sensitive structures. All the structures have natural frequencies (resonance frequencies) determined by their geometry, material properties, and boundary conditions. Passive seismic methods capture these frequencies to assess structural integrity. Two of the most used techniques based on ambient vibrations are the analysis of the vibrations and the HVSR (e.g., [17, 18]). In the first analysis, the objective is to measure the natural vibration modes of the structure in order to determine its dynamic properties in different points of the structure: natural frequencies, mode shapes, and damping ratios [19]. Changes of these properties in one specific zone could be a sign of internal damage or deterioration of the structure. The HVSR analyzes the ratio between the horizontal and vertical vibration components in order to identify the resonance frequencies, which is related to the dynamic behavior of the structure, and helps identify subsurface features, such as voids, cracks, or changes in material properties. This method is applicable to a wide range of structural materials, including masonry, concrete, and stone, and it is also suitable for large and complex structures like historical bridges [20]. Another technique that can provide interesting information, although not widely used, is drawing the particle movement at its measured point. This technique consists in drawing the modal motion of each measured point. This can be done applying a narrow band filter at the triaxial recorded signals and subsequently drawing the movement [21]. In this paper, we only used the spectral analysis of the vibrations and particle movement technique.
In the specific study of masonry bridges, this survey method is used to identify the natural frequencies and mode shapes of historical bridges, providing insights into their dynamic behavior (e.g., [21, 22]). Variations from expected behavior may indicate degradation, loss of stiffness, or structural damage. In addition, by monitoring changes in resonance frequencies or damping ratios, it is possible to detect cracks, voids, or localized damage in the structure. In some cases, mainly combined with computational modeling, it is feasible to estimate the stiffness and strength of materials such as stone, brick, or mortar. The method is also used to study bridge foundations (e.g., [23]). One interesting application of this technique, due to the straightforwardness of data acquisition, is monitoring the structure. Measurements in different periods could track structural changes and evaluate the effectiveness of restoration efforts [24].
The method is ideal for fragile structures, as it does not require drilling, coring, or other intrusive actions and does not require the generation of artificial seismic waves, minimizing impact on bridge use or the surrounding environment. Compared to other methodologies, the passive seismic survey requires low equipment, diminishing the operational costs. However, as other NDT methods, it consists of indirect measurements and presents certain limitations. One of the most important limitations is that the quality of data depends on the availability and consistency of ambient vibrations, which may vary by location and time. Another limitation is that the method is time consuming because it requires almost 20 min of record for measurement point. Interpretation could be also difficult in the case of heterogeneous structures like historical bridges requiring expertise and complementary information. The analysis of data could be also complicated in the case of irregularities in historical bridges, such as uneven surfaces or complex geometries, which can complicate the analysis.
2.3. Light Weight Deflectometer (LWD)
The LWD is a testing device commonly used to assess the structural health and condition of pavements, roads, and bridges, including masonry bridges. Its application in masonry bridges involves evaluating the deflection response of the bridge under a controlled load, which can provide valuable insights into the structural performance and condition of the bridge. The method of LWD consists of a weight that is dropped onto the surface of the bridge (or pavement), applying a load of 8 to 15 kN. The load is applied on a circular plate through buffers and sensors placed around the area of the load that measure how the surface deflects in response. The deflection is typically recorded at one to three points around the load application site, being usually measured at the deck surface. The arches supporting the bridge are indirectly assessed through the response of the deck. Large deflections could be indicators of weaknesses or damage in specific areas, most likely associated to cracks [25] or deformations in the masonry or mortar, or even to a general structural degradation. The usual assessment requires application of loads and data acquisition at different points of the bridge. Comparing deflections at different locations can reveal any uneven settlement or localized weaknesses. In addition, LWD could be used to define the dynamic behavior of the bridge because the method enables the identification of natural frequencies and vibration modes [26].
This type of test is useful for long-term monitoring of masonry bridges. Repeated LWD testing at regular intervals can track changes in deflection patterns over time, which might indicate a gradual degradation of the bridge condition (e.g., [27]). This ongoing monitoring helps in planning maintenance and repairs, ensuring the bridge remains structurally safe and functional. Therefore, as the LWD provides valuable deflection data, it is usually part of a broader set of diagnostic tools for inspecting masonry bridges. However, it is useful to complement the results with the information provided by other methodologies to obtain a comprehensive view of the overall health of the bridge because the method primarily measures deflection at the surface and evaluates the structural condition of the top layers (up to 60 cm depth) and may not directly measure the internal condition of the masonry or underlying layers.
2.4. LiDAR
LiDAR technology has emerged as a powerful tool for enhancing the assessment and preservation of these structures due to its ability to generate high-resolution, three-dimensional representations of bridges with remarkable accuracy, allowing nondestructive data collection. It operates by emitting laser pulses that reflect off surfaces, measuring the time it takes for signals to return. This process enables the creation of detailed point clouds that accurately represent the geometry of masonry bridges. Due to the high precision and accuracy in the results, LiDAR provides detailed 3D models of the geometry, detecting even minor deformations and surface irregularities that might indicate structural features or problems. Data acquisition to obtain these models is quick, allowing the analysis of big structures with inaccessible zones.
Considering a static terrestrial laser scanning, the system consists of two main components: a laser scanner and a Global Navigation Satellite System (GNSS). The laser scanner emits rapid pulses of laser light that reflect off surfaces and return to the sensor, allowing to obtain the 3D information. In addition, the GNSS/GPS determines the exact position of the LiDAR system, ensuring accurate georeferencing of the collected data.
LiDAR technology is particularly useful in several key aspects of historical masonry bridge assessment. For example, by comparing successive LiDAR scans over time, it is possible to monitor deformations, cracks, and other structural changes that may indicate deterioration. On the other hand, the detailed 3D geometric models of the structure obtained with this methodology can be used to conduct computational simulations of stress and deformations of dynamic behavior. However, the most direct applications of the collected data are the assessments of the surface of the structure because the information provided can identify damage such as erosion, missing masonry elements, and other surface degradation that could impact the structural integrity [28].
There are several works that combined geometric documentation by LiDAR with other NDT techniques, such as GPR (e.g., [29, 30]), to enhance diagnosis while allowing for advanced structural analysis [31].
The three-dimensional models are also a valuable tool in the documentation and digital preservation of cultural heritage because they serve as digital records for conservation planning and heritage documentation [32].
Despite those many advantages, the use of LiDAR in historical masonry bridge assessment faces certain challenges. Factors such as cost, data processing complexity, and environmental conditions (vegetation, water currents, and abrupt topography) can affect the access to the complete structure and the efficiency of LiDAR scanning [33].
2.5. Computational Methods
Finite element method (FEM) and computational modeling are essential tools in assessing the structural behavior of historical stone bridges. The models are based on 3D representations of the structure. Therefore, the accurate LiDAR results are a proper base of this computational process. In addition, by integrating passive seismic measurements, GPR data, and LWD measurements, it is possible to create detailed simulations that enhance understanding of bridge conditions and potential failure mechanisms. These models allow to analyze the structural response of the bridge because FEM enables simulation of how bridges respond to various loads and environmental conditions, identifying weak points and stress concentrations. It is highly useful in seismic vulnerability studies to determine the strength and stability in front of important accelerations. Passive seismic measurements combined with FEM models help assess how bridges react to seismic activity, guiding retrofitting strategies [34]. By combing computational modeling with LWD tests, it could be possible to determine and predict possible deck deformations and layer stiffness.
The accuracy of computational models needs the data obtained with GPR and other NDT surveys to define inner targets and structures, and the results from passive seismic measurements could allow the calibration of the models based on their dynamic behavior. The models can be used in the development of maintenance strategies, ensuring the long-term stability and preservation of these historical masonry bridges [35, 36].
The main challenges in the use of computational models are focused on the material complexity, mainly of these historical structures; on the data integration and calibration to define accurate results; on the computational costs; on the uncertainty of data used to build the models; and, finally, on the aging of structures. Accurately modeling masonry materials is difficult due to their heterogeneous and anisotropic nature, requiring advanced constitutive models. It is highly important to select proper strategies and methodologies used in the modeling [37]. Moreover, the combination of passive seismic measurements, GPR, LWD, and LiDAR requires careful calibration to ensure reliable simulations, but it must be considered the uncertainties and possible lack of information in the results obtained with NDT. Incomplete or outdated structural data can lead to inaccuracies in model predictions, emphasizing the need for continuous data updates. Finally, the long-term factors such as weathering, moisture ingress, and degradation need to be incorporated into simulations for realistic assessments.
3. Data Acquisition Methodology and Processing
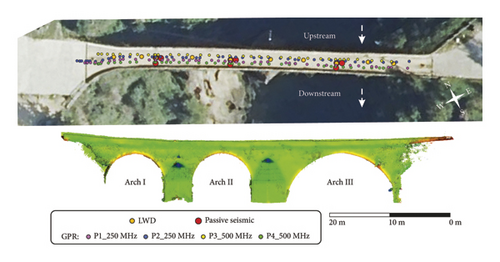
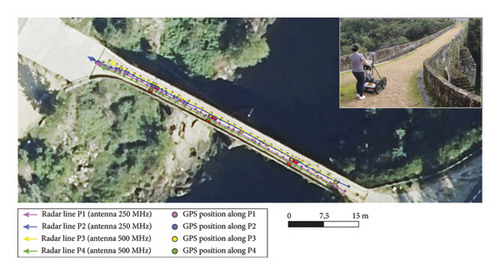
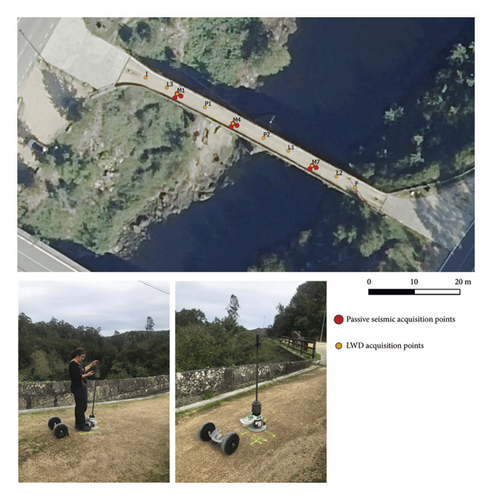
Three NDT techniques were used in the assessment of the bridge: GPR, passive seismic, and LWD, and the 3D model of the structure was obtained with LiDAR. Locations of the different data acquisition points are shown in Figure 4. Measurements with passive seismic and LWD were in specific points, whose position was determined with a GPS. GPR data were acquired in different radar lines along the bridge deck. Figure 4 shows all the GPR profile lines conducted with both frequency antennas used. A GPS was connected to the GPR system to assign coordinates to the GPR traces recorded along each of these profile lines.
3.1. Passive Seismic
The survey was carried out obtaining data in three points at each one of the arches. Figure 5 shows the scheme with the position and name of the seismic points. One of the points was centered, the second point was located eccentrically, approximately 1 m from the center, and the third one was moved toward the bridge railing in the upstream direction.
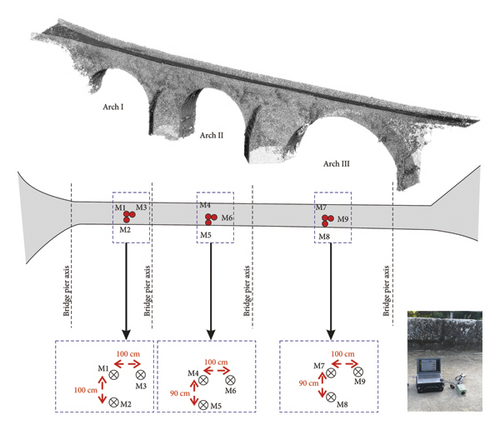
Passive seismic data were acquired with a Taurus triaxial accelerograph that measures in a frequency range until 430 Hz with a sensitivity of 0.5% and a dynamic range higher than 141 dB. Measurements consist of acceleration records of 20 min to assure sufficiently good record to compute spectra. Measurements were carried out in 2 days (July 30 and October 14, 2024), in a total of 9 points. Points M1, M2, M3, M4, and M7 were repeated the second day. The temperature change between the two days was from 24°C–27°C on July 31 to 16°C–17°C on October 14, as measured at the meteorological station located 4 km from the Comboa Bridge.
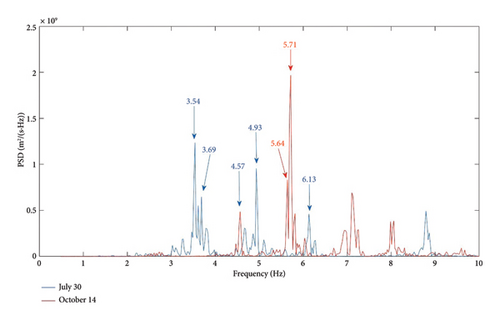
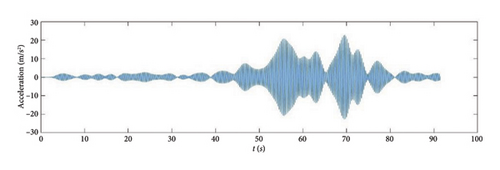
Accelerograms were processed in a classical way. First, good windows of 40.95 s were manually selected in order to discard windows with anomalous energy (Figure 6), that is, windows that show spurious impacts or signals produced by local forced vibration (close pedestrian passage, etc.). With this window length, the frequential resolution is of 0.025 Hz. After window selection, power spectral density is computed and drawn (Figure 7) using a triangular smoothing of a 0.5 Hz band.

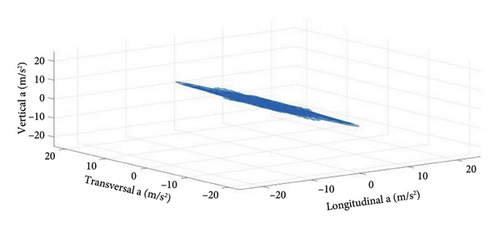
For particle movement technique, first of all, the signal was filtered by 8-point Butterworth filter in a range including only one mode and subsequently drawn in 3D graphs (Figure 8). As shown in the figure, the modal response at point M7 is characterized solely by a longitudinal displacement component.
3.2. GPR
The GPR survey was carried out with a ProEx system using ground-coupled antennas of 500 and 250 MHz. The data acquisition parameters selected were (1) 2 cm of trace-interval distance and a total time window of 93 ns (composed of 1032 samples per trace) for the 500 MHz antenna and (2) 2 cm of trace-interval distance and a total time window of 127 ns (composed of 608 samples per trace) for the 250 MHz antenna. A total of 4 longitudinal 2D profile lines were conducted along the longitudinal profile of the bridge (2 profile lines with each antenna), coinciding with the location of the passive seismic and LWD measurements (Figure 8). To measure the profile length and to control the trace-interval distance, the antennas were mounted in a survey cart with an odometer wheel (Figure 9). Additionally, a Stonex S900A GPS RTK (real-time kinematic) was synchronized with the GPR system to provide precise GNSS coordinates for the recorded traces (with a horizontal precision of 2.5 mm + 0.1 ppm RMS). These positioning data are essential for georeferencing the GPR data, ensuring the correlation between all the techniques in data interpretation.
The signals registered were processed with the ReflexW software, by applying the processing sequence described in Table 1: time-zero correction, dewow (DC-subtract), gain function, and background removal.
| Filters | Parameters | |
|---|---|---|
| 500 MHz | 250 MHz | |
| Time-zero correction | −4.41 ns | −7.21 ns |
| Subtract-mean (dewow) | Time window: 2 ns | Time window: 4 ns |
| Gain function | Linear: 0.5 and exponential: 0.64 | Linear: 0.5 and exponential: 0.5 |
| Background removal | By default | By default |
3.3. LWD Test
Tests were performed on the bridge with the LWD PRIMA 100. A 300 mm diameter loading plate was used, and a 10 kg weight was applied, which resulted in an induced load of about 15 kN. The equipment has an integrated load cell that allows the precise measure of the load applied [38, 39]. Deflections were measured by a geophone placed in the center of the load plate. Figure 10 shows the data acquisition procedure. Between 5 and 10 drops were performed per test point, until the deflection measured remained similar between the last two drops (±3%).
3.4. LiDAR and UAV Surveying
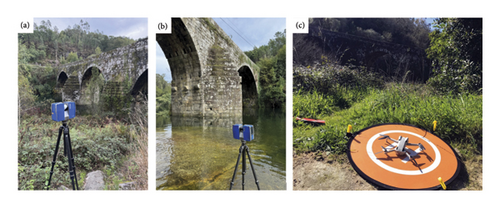
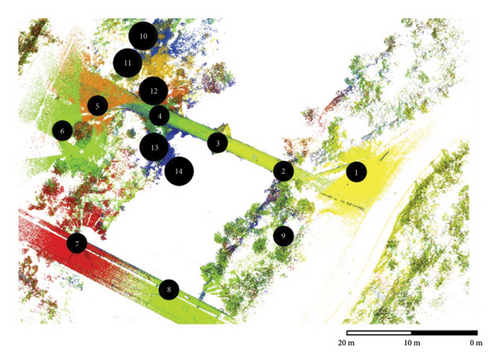
Given the extension of the bridge and the reduced visibility caused by the surrounding vegetation, 14 scan positions were deployed with a Faro Focus 3D X330 [40]; technical specifications are summarized in Table 2. The scan positions were approximately distributed equidistant, and overlaps were considered for later registration. The selection of each scan position was based on previous experience considering the range of the equipment, in terms of point density generated, and the visibility, regarding the bridge and also between positions to ensure a correct registration of each position. The target point density must guarantee the correct application of computational analysis. The scanning positions were located in the following areas: the upper deck of the bridge, on the upstream side, beneath the western arch (Arch I) (a), and at the downstream wall. (Figure 11).
| Measurement range | From 0.6 to 330 m |
| Ranging error (25 m, one sigma) | ±2 mm |
| Step size (vertical/horizontal) | 0.009°/0.009° |
| Field of view (vertical/horizontal) | 300°/360° |
| Beam divergence | 0.011° |
| Measurement rate (points per second) | 122.000–976.000 |
| Laser wavelength | 1550 nm |
The distribution of the scan positions can be seen in Figure 12. The point cloud registration was performed on the central scan (Scan position 3 in Figure 12), taking at least four pairs of equivalent points in each point cloud. Reference and error per registration are compiled in Table 3. The average RMS error of scan registrations was 2.9 cm. The noise points and elements outside the bridge were filtered out and manually removed.
| To align | Reference scan | RMS error (cm) |
|---|---|---|
| 1 | 2 | 5.8 |
| 2 | 3 (main reference) | 1.9 |
| 4 | 3 (main reference) | 0.4 |
| 5 | 4 | 1.7 |
| 6 | 4 | 2.5 |
| 7 | 6 | 4.0 |
| 8 | 5&7 | 6.7 |
| 9 | 1&8 | 4.0 |
| 10 | 3&6 | 1.5 |
| 11 | 10 | 2.0 |
| 12 | 11 | 3.2 |
| 13 | 12 | 2.3 |
| 14 | 3&7 | 2.2 |
- Note: Position 3 corresponds to the main reference.
Due to the limited visibility caused by bridge geometry and the high vegetation on the edges of the river, the LiDAR positions did not allow a complete scanning of the western part of Arch III. Since computational analysis required a complete model, it was decided to use a symmetrical point cloud of the scanned area of Arch III to complete the model. LiDAR data have an advantage over UAV photogrammetric data because the laser can penetrate the vegetation on the bridge, so the structure of the bridge is captured in more detail.
A Ball Pivoting Algorithm (BPA) was applied as a surface reconstruction method to generate a mesh from the unstructured point cloud [41]. BPA works by rolling a virtual ball of a given radius over the point cloud, pivoting around the existing edges to form triangles. The process starts with a seed triangle, and the ball pivots around its edges to find new points to form additional triangles, progressively expanding the mesh.
To overcome the limitations of LiDAR in documenting and visualizing the real condition of Arch III, a UAV survey was conducted at an altitude of 50 m AGL (above ground level), in compliance with current regulations. The system used was the DJI Mini4Pro, equipped with an RGB (red, green, blue) camera (CMOS 1/1.3″ sensor featuring a 24 mm focal length and a resolution of 48 MP (effective megapixels)) and GNSS positioning (see Figure 11). A photogrammetric survey was first carried out to capture the overall 3D model of the bridge with RGB texture. As a result, orthomosaics of the top view and 3D point clouds of the bridge structure were produced using the software Agisoft Metashape. However, orthomosaics of the upstream and downstream walls could not be obtained because regular image capture was not possible in these parts of the structure due to the presence of vegetation, thus making impossible the necessary image overlap required for photogrammetric processing. To address this issue, 3D texturing was generated for the walls, and additional pictures were taken to document the walls and vaults of the bridge.
4. NDT Experimental Results
4.1. Passive Seismic
The first important result to point out is the multiple peaks present in almost all the resonant frequencies (Figure 7). This characteristic of the spectra indicates damage, because, as more important is the structural damage, higher is the number of peaks in the resonant frequencies.
Another interesting result is the high difference between results obtained in July and October (Figure 13). The first mode has a frequency between 3.44 and 3.79 Hz for July measurements and between 3.34 and 3.54 Hz of October data, but this resonant frequency does not appear in M7, M8, M9, and M6 measurements of October. This first mode is transversal (Figure 8).
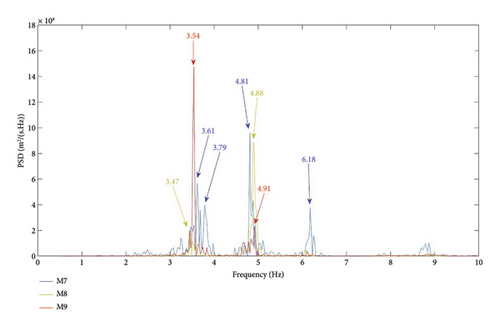
The second mode is also longitudinal with frequencies between 4.84 Hz and 4.93 Hz for July measurements and 4.32 Hz to 4.69 for October measurements but, also, disappears for M1, M2, and M3 points.
The first longitudinal mode appears at a frequency of 5.64 Hz to 5.89 Hz for July measurements but not at point M4 (the only one on the shorter arch). This mode has also vertical and transversal comportment. For measurements carried out in October, the first longitudinal mode appears at a frequency of 5.00 to 5.42 Hz appearing in all points (Figure 7). The results suggest the existence of cracks that widen when the weather is colder due to the thermal contraction of the materials and partially close when the temperature rises due to material expansion. These cracks would be significant enough to disconnect the largest arch from the others. This phenomenon would explain why the transversal mode observed in the other two arches is not recorded in this one. There are other higher modes, but they are difficult to be interpreted.
4.2. GPR
Figure 14 presents the results produced with the 250 MHz antenna. From the interpretation of the data, several structural elements are clearly identified, including the reflections generated at the intrados of the vaults (arch-air interfaces) and the level of the cutwaters within the masonry, which is likely due to a different stone compaction or the transition (interface) between solid blocks and filling. In addition, a hyperbolic shape is observed at the edges of the arches, which may be caused by the presence of a larger base ashlar (typically called salmer) or the influence of the adjacent cushions (base of the piers or cutwaters). Another reflection easily detectable is the river level (air-water interfaces), along with the typical corner reflections generated from the perpendicular interfaces between the lateral walls of the vault and the water level [42].
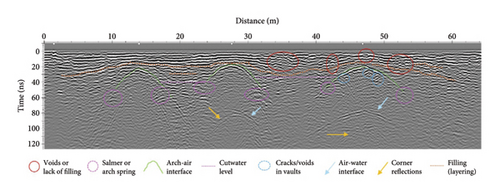
Regarding damage detection, GPR has revealed areas of masonry with missing filling or voids, likely caused by the presence of roots from vegetation growing in external ashlars. This is particularly evident at the cladding between the larger arches (Arch II and Arch III) and the extrados of Arch III vault. Another damage detected is the presence of cracks or voids in the ashlars at the intrados of Arch III vault. On this bridge, it should also be noted that there are remains of the arch’s construction formwork, including both corbels (supports) coinciding with the arch springs and putlog holes (or putholes) throughout the vault.
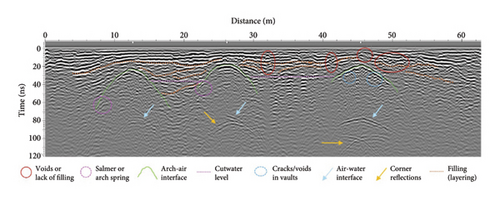
The 500 MHz data (Figure 15) revealed similar results, confirming the interpretation obtained with the 250 MHz data. However, the higher resolution of the 500 MHz antenna provides a more detailed definition of the damage. In this regard, it was possible to extend the detection of cracking to the other two arches as well. Furthermore, the resolution of this antenna allowed for the distinction of the arch-ring thicknesses, thanks to the differentiation between the reflections produced at the filling-arch/stone and arch-air interfaces.

It can be observed that the filling layers follow the shape of arches (orange and yellow lines in Figures 14 and 15). The anomalies could indicate that near the pillars and abutments, the filling material consists mainly of stone fragments bounded by some mortar.
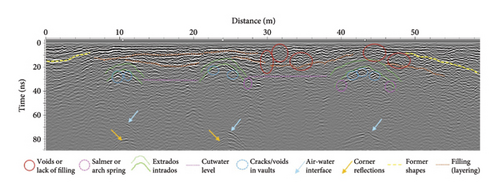
Figure 13 presents an important change on the slope of the hyperbolic anomaly associated to the reflection on the base of Arch III. The part corresponding to the right of the image has higher slope, indicating lower wave velocity in filling materials that can be associated to an increase of moisture in this part of the arch.
4.3. LWD
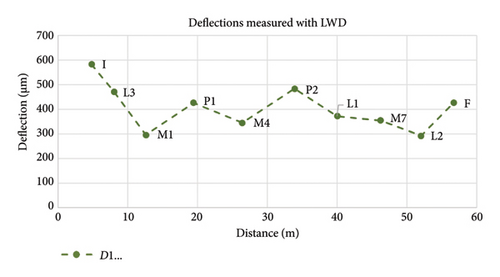
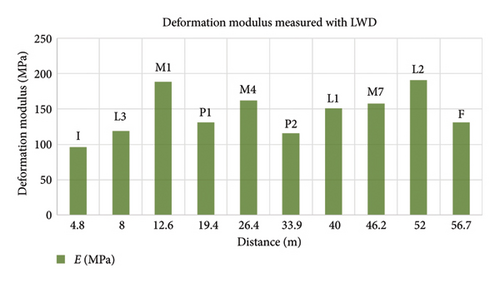
The deflections normalized for 15 kN load are presented in Figure 16. Ten measurements were performed at about 6 m apart but focusing on the location of the seismic tests and the main characteristic elements of the bridge. Points M1, M4, and M7 correspond to measurements on the center or arches I, II, and III, respectively. Minimum deflections are measured in M1 and M4. Higher deflections are observed in points P1 and P2 corresponding to measurements at the center of the piers between arches I and II (point P1) and arches II and III (point P2). Points L1, L2, and L3 are placed on the connection between arches and piers, while points I and F correspond to the measurements at both sides of the bridge. It is noticeable the low deflection measured in points L1 and L2, compared to L3.
4.4. Integrated Result Analysis
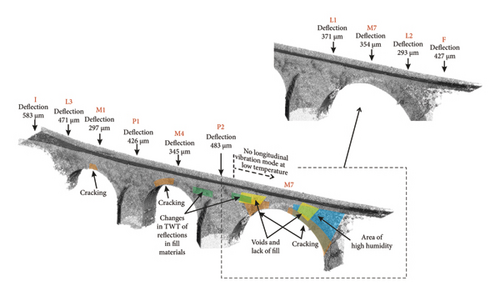
The combination of results seems to highlight that the wider arch is the most damaged one. Visual inspection shows the existence of cracks and vegetation affecting different sectors of the bridge, mainly the arches and the areas closest to the slopes. The most damaged arch is the one with the greatest span, supported by one of the slopes and a pillar that, in turn, rests on the riverbed. GPR data reveal an important change on the wave propagation velocity, observed in the shape of the reflection on the lower part of the arch: the branch of the hyperbolic anomaly that is associated to the part with contact of the arch with the slope corresponds to a higher wave travel time (abutment side of Arch III, Figure 15), indicating lower velocities in the zone. This phenomenon is most likely due to an increase of humidity in the structure. In addition, anomalies indicate the existence of damage and cracks. This interpretation of high damage is coherent with the presence of diverse peaks in the vibration modes. It is also remarkable to see the differences in the higher frequency peaks associated to changes in temperature, indicating lower frequency values in the case of lower temperatures (measurements in October). Moreover, the first longitudinal mode is observed in August (higher temperatures) and disappears in some October measurement points (lower temperatures). This fact could be produced as a consequence of damage and the behavior of materials with changes of temperature: higher temperatures dilate the materials and cracks are narrower, while lower temperatures contract materials producing wider cracks. Therefore, the behavior of the bridge depends on the weather, and the bigger arch remains disconnected from the rest of the bridge in the case of lower temperatures.
Comparing results to the LWD, it is noticeable that the minimum deflection values are observed in the center of the arches (points M1, M4, and M7 in Figures 15 and 16), and high deflections are obtained at pillar location and abutments (points P1, P2, I, L3, and F in Figures 15 and 16). It can be observed that, contrary of what should be expected, the deflection is low in the part of the biggest arch where GPR denotes higher damage (point L2 in Figure 16). This can be since LWD assesses only the upper layers (up to 60 cm) of the bridge deck, while its thickness is higher than 88 cm, as shown in Figure 18. Additionally, the tests were done 6 m apart. Therefore, LWD does not detect the damage observed in GPR files. This highlights the importance of complementarity testing for assessing the structural health of bridges.
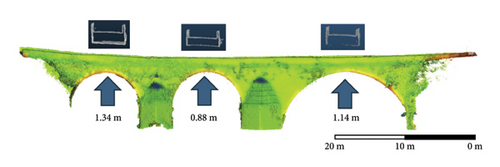
Figure 19 shows a combined interpretation indicating the most damaged zones.
5. LiDAR and Computational Models
5.1. Computational Analysis Methodology
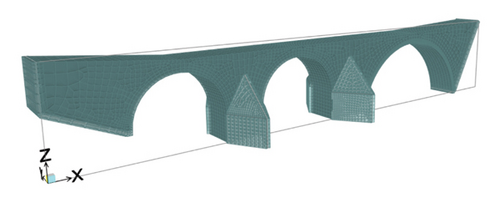
The structural behavior of the medieval masonry bridge was analyzed using a three-dimensional finite element model developed in the software CSI SAP2000 V26. The model employed an 8-node isoparametric element (hexahedral, 6 faces) to discretize the geometry (Figure 20). Discontinuities and crack propagation were not explicitly modeled in this study as well as nonlinear effects, including damage. These considerations will be investigated in a subsequent phase of this research.
That finite element model approach presents inherent limitations, primarily related to material modeling constraints, uncertainties in geometric and material properties, and simplifications in boundary conditions. The constitutive model of the material does not fully account for the anisotropic and heterogeneous nature of masonry, which may influence local stress distributions. Additionally, variations in masonry composition introduce uncertainties (i.e., fractures, moisture saturation, and vegetation-induced degradation). The geometric discrepancies in archival construction data necessitated the use of averaged dimensions, particularly for the arch span width. The soil-structure interaction was simplified by assuming semi-rigid supports at the abutments, allowing limited displacement at the soil-contact interface.
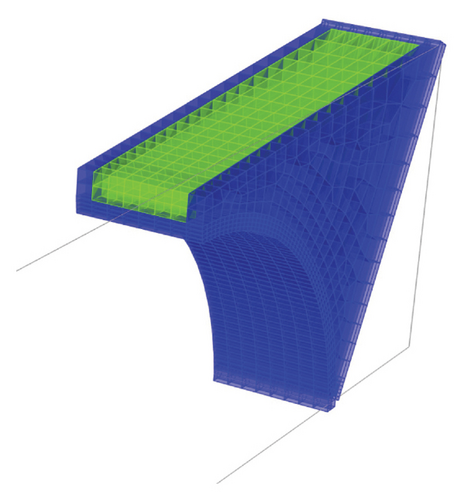
A macro-modeling strategy was adopted, treating the masonry as a continuum with homogenized linear elastic properties. The constitutive law assumed isotropic behavior, with material properties derived from regional granite characteristics [44]. The elastic modulus of the granite elements was set to 11.038 GPa, and Poisson’s ratio to 0.29. The backfill material was modeled with an elastic modulus of 0.1 GPa and Poisson’s ratio of 0.15, to account for its interaction with the masonry structure. Self-weight loads were applied based on these physical properties summarized in Table 4, while live loads were excluded to isolate the undamaged vibrational characteristics. Figure 21 presents the details of the model geometry showing the two main materials considered in the computational analysis: a skin built with granite stones and filling material.
| Element | E (GPa) | ν | γ (kN/m3) |
|---|---|---|---|
| Abutments | 11.0 | 0.29 | 28 |
| Arches | 11.0 | 0.29 | 28 |
| Backfill | 0.1 | 0.15 | 23 |
| Pavement | 11.0 | 0.29 | 28 |
| Piers | 11.0 | 0.29 | 28 |
| Spandrels | 11.0 | 0.29 | 28 |
Boundary conditions were carefully defined to replicate realistic constraints. The base of the piers was assigned fixed supports, reflecting the assumption of high-stiffness bedrock inferred from surveys. At both ends of the bridge, supports perpendicular to the foundation were allowed to slide, simulating interaction with the inclined foundation, which is settled on organic soil that may exhibit reduced lateral stiffness.
It is important to note that neglecting crack propagation, discontinuities, and explicit damage mechanisms introduces simplifications that may influence the reliability of the modal calibration and the conclusions of this study. Localized damage and discontinuities can alter the global stiffness distribution and dynamic characteristics, potentially leading to an underestimation or omission of specific changes in the vibration modes that are sensitive to such effects [45, 46]. Therefore, while the present model provides valuable insights into the overall structural response and allows for a first calibration against experimental data, the results should be interpreted with these limitations in mind [47, 48]. Future research phases will incorporate more advanced modeling strategies, such as nonlinear analysis and explicit crack or damage modeling, to better capture the actual condition of the structure.
5.2. Calibration and Results
The FEM was calibrated using the measured frequencies obtained from operational modal analysis to improve its accuracy. To align the numerical results with the experimental data, the stiffness of the solid elements was reduced by a factor of 51.5%, a modification that successfully matched the first modal frequency. Notably, this adjustment is consistent with the effective stiffness recommendations for masonry structures, as specified in the Eurocode 8 (EC8) Part 1 [49].
Table 5 presents a summary of the first 10 vibration modes of the bridge, characterized by their periods, frequencies, and participating mass ratios in translational (X, Y, Z) and rotational (RX, RY, RZ) directions. The fundamental mode (Mode 1) exhibited a period of 0.273 s (3.66 Hz) and was dominated by transverse (Y, 25%) and torsional (RZ, 25%) movements, indicating a combined lateral and rotational response. Because Mode 1 couples lateral sway with deck torsion, any eccentric dynamic action, such as cross-wind gusts or obliquely incident seismic waves, can efficiently excite this mode. Therefore, there is a concentration of shear and out-of-plane bending at the arch–pier interfaces and spandrel walls, which are the zones most susceptible to further cracking and long-term degradation [20]. Likewise, a sudden increase in river discharge that impinges on the arch intrados may mobilize the same coupled response, amplifying stresses and exacerbating scour-related differential movements at the abutments. Mode 2, with a period of 0.165 s (6.04 Hz), showed strong longitudinal (X, 76%) participation, representing primary axial vibration. Mode 3 (0.164 s, 6.08 Hz) displayed mixed transverse (Y, 14%) and minor torsional (RZ, 2.8%) contributions. Modes 4 and 6 featured significant transverse (Y) and torsional (RZ) components, while Mode 5 included minimal vertical (Z, 2%) motion. Higher modes (7–10) exhibited progressively smaller participating masses, with negligible contributions in most directions, suggesting localized or complex coupled vibrations.
| Mode | Period | Frequency | Modal mass participation ratios (%) | |||||
|---|---|---|---|---|---|---|---|---|
| s | Hz | X | Y | Z | RX | RY | RZ | |
| 1 | 0.273 | 3.66 | 0.0 | 25.0 | 0.0 | 10.0 | 0.0 | 25.0 |
| 2 | 0.165 | 6.04 | 76.0 | 0.3 | 0.1 | 0.0 | 0.9 | 0.1 |
| 3 | 0.164 | 6.08 | 1.3 | 14.0 | 0.0 | 1.8 | 0.0 | 2.8 |
| 4 | 0.147 | 6.82 | 0.0 | 25.0 | 0.0 | 9.0 | 0.0 | 13.0 |
| 5 | 0.141 | 7.09 | 0.4 | 0.0 | 2.0 | 0.0 | 0.2 | 0.0 |
| 6 | 0.139 | 7.18 | 0.0 | 0.0 | 0.0 | 0.1 | 0.0 | 12.0 |
| 7 | 0.126 | 7.93 | 0.3 | 0.0 | 0.7 | 0.0 | 1.2 | 0.0 |
| 8 | 0.114 | 8.75 | 0.0 | 1.8 | 0.0 | 0.2 | 0.0 | 0.2 |
| 9 | 0.105 | 9.53 | 0.0 | 0.4 | 0.0 | 0.4 | 0.0 | 5.7 |
| 10 | 0.097 | 10.34 | 0.0 | 0.6 | 0.0 | 0.7 | 0.0 | 0.2 |
The modal shapes corresponding to the first four vibration modes are illustrated in Figure 22, which displays the deformed configurations of the bridge at each natural frequency. The color scale indicates maximum displacement in blue and minimal displacement in red.
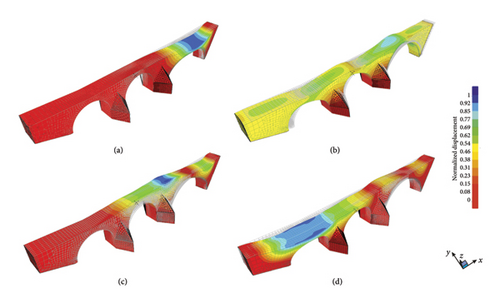
The first mode shows a clear global deformation pattern with significant lateral displacement of the main arch combined with torsional rotation. Mode 2 exhibits predominantly longitudinal displacement along the bridge axis, while Modes 3 and 4 display coupled transverse and torsional movements. Subsequent modes demonstrate progressively more complex deformation shapes.
5.3. Visual Analysis on LiDAR and UAV Surveying Data
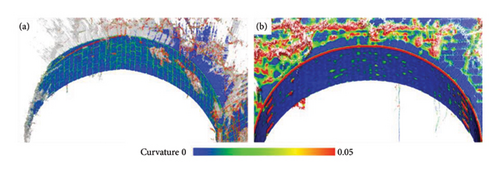
A visual analysis of the arches supports the results obtained by the previous techniques. The curvature was calculated in the point cloud for the arches I and II to highlight defects (areas with abrupt changes of the surface and protrusions). Curvature is understood as sudden changes of slope when compared to the surface continuity and the regular expected shape of the bridge; therefore, curvature represents, for example, joints between ashlars, cracking, or even vegetation. The search radius for the curvature analysis was adapted according to the LiDAR point density of 1 cm for Arch I and 10 cm for Arch II. The results (Figure 23) show many areas of vegetation growth between the stones in both arches (red and green colors), and to a lesser extent, small areas where material is missing between the stone joints. Arch III is not included because the density of vegetation obstructs assessment with LiDAR. Moreover, the accessibility to this arch was limited by the topography and the river. Therefore, it was analyzed through a visual inspection from the imagery obtained with the UAV RGB sensor.
Arch III was difficult to be assessed with LiDAR due to its position in the river; the current speed at the time of the tests makes impossible the access to obtain enough good images. Additionally, the presence of vegetation made it even more difficult to observe ashlars with this technique. Vegetation effect is also present in the left part of Arch I, obscuring the information. Therefore, a campaign of data acquisition by UAV surveying was used to overcome this challenge.
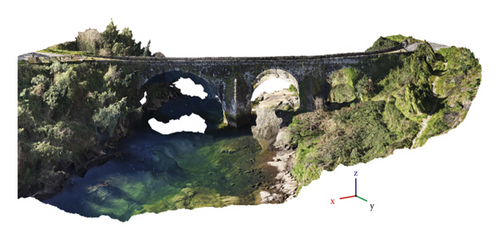
In Figure 24 obtained with UAV, it is clearly visible the vegetation that covers part of Arch III and the river flow under Arch III that makes impossible the access to obtain LiDAR images of this section of the bridge.
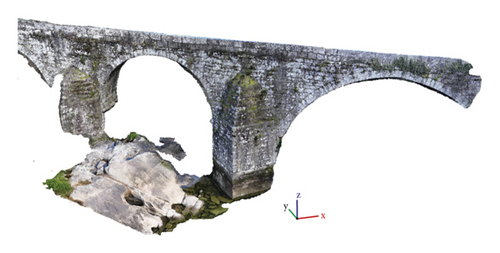
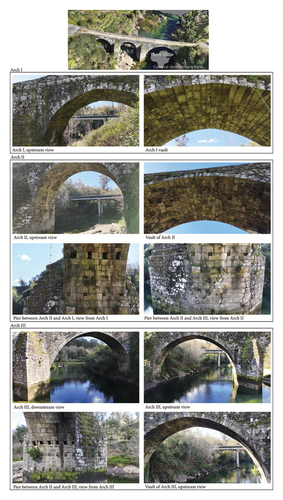
UAV image recognition denotes different external states of conservation of the arches. Figure 25 presents details of the three arches. Arch I presents a good state of conservation. Vegetation is observed between ashlars, but there is no evidence of important cracks or voids. The vault of Arch II and the pier between arches I and II also present a good state of conservation. However, the pier between arches II and III presents evident damage. Vertical cracks and loss of materials are observed, and the structure was reinforced with staples.
6. Discussion and Conclusion
This paper is focused on the assessment of a medieval bridge combining different technologies. The Comboa Bridge is a medieval bridge located in Galicia, Spain, and represents a remarkable example of medieval engineering. It is built with three irregular arches crossing a significant flow river. It spans 64.5 m in length and 3 m in width.
The bridge was assessed with nondestructive technique methods: GPR, passive seismic, and LWD, combined with visual inspection, LiDAR, and UAV surveying. The data were processed and compared, and the results were integrated in a computational model to define the structural health and dynamic behavior. The 3D volume and geometry were obtained by means of LiDAR. The model was simplified to be used in the computational analysis.
Despite the recent restoration and the apparent condition observed with visual inspection that indicates a good state of preservation of the bridge deck, NDT results evidence zones highly damaged. It is also noticeable the existence of vegetation covering some parts of the bridge structure, and some cracking in two of the pillars. Vegetation affects the bridge and makes it difficult to monitor and inspect with LiDAR and UAV.
A conclusion that summarizes the obtained results is that important cracks significantly affect the frequency modes and shapes. The change in the frequency modes ranges from 3% to 11%. Other important feature is the lack of the first longitudinal mode in Arch III in cold season (October), appearing with low amplitude in summer. This could indicate that Arch III behaves dynamically separately from the rest of the structure, most likely as consequence of cracking, that isolates this arch. In summer, with higher temperatures, dilatation of materials partially closes the cracks, being this effect less evident. The effect of the increase of cracking in cold weather could reduce the stability of the bridge under dynamic loads.
- •
Visual inspection and the application of technologies such as LiDAR and UAV inspection allowed to determine the different features and pathologies of the bridge surface, obtaining with accuracy their location and information about their shape and severity. Nevertheless, measurements are challenging due to vegetation on the surface of the bridge and in the foundations, and also due to impossibility to access to some parts of the bridge (mainly Arch III) because of the river stream. Therefore, LiDAR visual inspection was complemented with UAV surveying. However, in this later case, the contrasts between light and shadows also made it difficult for the complete assessment of the surface. This inspection denotes the most important damage in the pier between Arch II and Arch III, with visible cracks and displacement of stones.
- •
Other aspects observed in the UAV imagery are the damage in the vaults as consequence of cracking, moisture, and vegetation and also the existence of other features as the stonemasonry marks and the holes used to support the scaffolding during construction of the bridge. These holes are also visible in the LiDAR cloud.
- •
Seismic measurements were carried out in two different periods: summer (with high temperature and dry weather) and autumn (low temperatures and wet weather). Those measurements demonstrate seasonal changes in the behavior of the bridge, between autumn and summer. These effects can indicate the existence of cracks that affect the structure depending on the temperature, being more significant at lower temperatures. It could be caused because at high temperatures occur the expansion of materials and consequently, the partially closing of these cracks. At lower temperatures the cracks are wider, and, consequently, the longitudinal vibration mode does not appear in Arch III in the measurements carried out in autumn, which suggests that this arch is partially decoupled from the rest of the bridge due to the damage.
- •
GPR data are consistent with the results of the other tests, since most of the anomalous areas that are associated with damage are found in Arch III and in the two piles that support it. Reflections that seem to correspond to layers in filling materials are observed with a more irregular pattern in these areas, possibly showing subsidence and lack of materials. Other remarkable observation is the change in the reflection shape of the vault of Arch III that could be associated with a change in humidity.
- •
GPR B-scans also demonstrate a change in the shape of the reflection in the vault of the arch that could be associated with a change in humidity. This result is also consistent with the visual observations, since it corresponds to the area where the most vegetation is observed.
- •
Load test measurement (LWD) is consistent with the results of passive seismic, since the deflections are higher in the pillars and abutments, being greater in the pillar between Arch II and III, and lower in the center of the arches. The central deflection is slightly higher in Ach III.
- •
All these aspects denote that a single method is not enough for accurate characterization of the structure, and a combination of methodologies provides better assessment.
- •
The images obtained from the cloud points with LiDAR provide a good geometrical characterization of the bridge structure for the computational model setup.
- •
The bridge was modeled as a skin stone structure filled with heterogeneous and softer materials. The piers were considered founded on rock (visible in LiDAR and UAV data), except where sedimentary cover was visible. The different parts of the structure were assumed to be isotropic and homogeneous.
- •
The model was then calibrated by using the seismic experimental measurements. This calibration required changes in the initial characteristics of the materials adopted in the first iteration.
- •
Results after calibration indicate a good agreement with the frequencies of the first vibration mode (about 3.6 Hz). However, a measured vibration at about 4 Hz is not obtained in the dynamic numerical model. The remaining higher frequencies obtained in the model were consistent with the direct seismic measurements. In general, the frequencies obtained in the first iterations of the model present higher frequencies than the measured ones. Possible causes of this distinct response could be:
- •
Existence of important damage that modifies the dynamic response of the bridge.
- •
A combination of damage with a heterogeneous filling material.
- •
Less compacted filling material.
- •
Changes in the moisture in different parts of the structure of the bridge (moisture sensitivity between seasons).
- •
- •
Difficulties in accessing and visibility for measurements with UAV and LiDAR in environments with dense vegetation.
- •
Physical calibration of GPR data due to lack of coring and material information.
- •
Difficulties in accessing GPR data from pillars, piers, and foundations.
- •
The limited information provided by LWD, restricted to the bridge deck, highlights the need for complementary load tests.
- •
Interference of other vibrations and noise in seismic measurements.
- •
Sensitivity to temperature that requires more detailed and continuous characterization and systematic monitoring.
- •
Sensitivity to materials’ water content affecting the results of seismic and GPR, and the need of measure of this parameter.
- •
Difficulty in simulation of specific damage due to the lack of direct information.
- •
No available information of the initial bridge structure and maintenance restorations.
7. Recommendations and Future Perspectives
This study provides the method for integrated monitoring of historical bridge and dynamic behavior assessment and modeling. The results obtained support the need of systematic monitoring for preventive maintenance actions to avoid collapse or significant structural damage.
Other important recommendation is the maintenance of the bridge deck, always considering the monitoring information, in order to avoid water infiltration and further damage. LiDAR results show 1% transversal deck slope. Therefore, an additional recommendation is regular inspection and maintenance of the drainage system to ensure correct superficial water drainage. Additionally, higher values of the transversal slope can assure more effective stormwater drainage.
An important measure to avoid structural collapse and deck failures is the traffic control in terms of passages and overloading. Moreover, subaquatic inspection of foundations could provide significant data to identify erosion and washout of materials under the pillars due to river stream and sudden floods.
Finally, repairing the cracking and joint filling is crucial for prolonging the life service of the bridge. Careful vegetation cleaning must be carried out always together with the consolidation of the corresponding cracks due to roots.
- •
Automatization of NDT data acquisition.
- •
Algorithms for automatic pattern recognition of GPR and LiDAR data by using AI techniques, such as deep learning.
- •
Systematic and long-term monitoring to observe changes in frequency and moisture, correlating data with the dynamic behavior of the bridge obtained with computational models.
- •
Instrumentation for continuous real-time monitoring of the whole bridge or of relevant parts of the structure.
- •
Fusion of survey data with images. Some works points to possible fusion of images of structures superimposed to NDT data. These works compare the high-precision geometrical data to NDT information, providing robust results [50], although further advancements in methodology are required for more precise and automated techniques through enhanced algorithms and the integration of machine learning.
- •
Development of computational models that enable the integration of bridge damage, allowing comprehensive bridge monitoring and the development of digital twins for continuous monitoring [51].
Conflicts of Interest
The authors declare no conflicts of interest.
Funding
This work has received funding from the Xunta de Galicia through the ENDITí project (ED431F 2021/08). Mercedes Solla acknowledges the Grant RYC2019–026604–I funded by MICIU/AEI/10.13039/501100011033 and by “ESF Investing in your Future”. Simona Fontul acknowledges the funding received from the STRADAR project (TED2021-130183B-I00) funded by MICIU/AEI/10.13039/501100011033 and by the “European Union NextGenerationEU/PRTR”. Jesús Balado acknowledges the grant RYC2022-038100-I funded by MICIU/AEI/10.13039/501100011033 and by ESF+. The authors from Universitat Politècnica de Catalunya acknowledges the financial support provided by the project PID2020-117374RB-I00 funded by MICIU/AEI/10.13039/501100011033, and by the Generalitat de Catalunya through project SGR 2021 01060.
Open Research
Data Availability Statement
The data that support the findings of this study are available from the corresponding author upon reasonable request.


