Physics Parameter Identification of Annular Tuned Liquid Damper for the Structure-Damper-Coupled System Using a Mechanics-Enhanced SSI Method
Abstract
Tuned liquid damper (TLD) is one of the main technologies for passive control. The fundamental modal parameters of a TLD contain natural frequency and damping ratio, which are primarily related to the liquid height in the TLD device. Although the liquid height of the TLD is calibrated before installation, it is still necessary to identify the physics parameters of the TLD and the main structure during the service period to prevent the detuning of the TLD. A physics parameter identification method for the structure-damper-coupled system based on mechanics-enhanced stochastic subspace identification (SSI) is proposed in this paper, illustrated through annular TLD (ATLD). By extracting the state matrix of the first controlled mode of the main structure, the natural frequency and damping ratio of the ATLD are identified, thereby determining the liquid height of the ATLD. Numerical models of structure-ATLD-coupled systems with different degrees of freedom are constructed, and their simulated acceleration responses under different excitations are obtained. Sensitivity analysis of environmental noise is performed to verify the accuracy and robustness of the proposed parameter identification method. A dynamic test was designed for a steel chimney model to further verify the practicality of this method. The results show that when the noise level of the measurement noise is below 5.0%, the average relative error in identifying the ATLD liquid height does not exceed 10%. The identification error in the damping ratio of the structure-ATLD-coupled system will lead to a decrease in the accuracy of ATLD liquid height estimation. The proposed method can effectively identify changes in the ATLD liquid height within the optimal frequency ratio range by analyzing the experimental data from the chimney model. The proposed method can effectively estimate the modal parameters of the coupled system, providing reliable data support for evaluating the working condition of the ATLD during its service period.
1. Introduction
In modern structural engineering, a passive control strategy for structures is a promising method for vibration control, which can effectively suppress structural dynamic response without external energy [1]. Commonly used passive control strategy contains metal damper [2], viscous damper [3, 4], eddy current damper [5], X-plate damper [6], tuned mass dampers (TMDs) [7–10], tuned liquid dampers (TLDs) [11], and so on. The utilization of TLDs for structural vibration control is becoming increasingly prevalent in engineering practice due to their manufacturing, installation, and maintenance benefits [12]. TLD has been applied across various kinds of structures, including large-span bridges [13, 14] and high-rise buildings [15, 16]. A TLD is generally comprised a rigid tank holding liquid, which capitalizes on the fluid’s dynamic behavior to absorb and dissipate energy, thereby diminishing the dynamic response for the main structure. The principal design objective for TLDs is to match the damper’s frequency with the main structure’s frequency to realize the dissipation of vibrational energy [17]. To achieve specific structural vibration control objectives, tailored optimization methods for TLD design are employed, enabling precise determination of mass, frequency, and damping ratio [18]. Over time, material degradation and the diminution of liquid mass within the TLD may alter its modal parameters, consequently impacting its damping efficacy. Concurrently, advancements in active control technology underscore the importance of accurate modal parameter identification for both the primary structure and the damping devices, which is critical for maintaining active control technology’s effectiveness [19, 20]. Hence, there is a compelling need for research focused on modal parameter identification in structure-TLD-coupled systems to ensure sustained vibration control performance.
In the research of modal parameter identification for coupled systems, the predominant methods include experimental modal analysis (EMA) and operational modal analysis (OMA) to identify the natural frequencies and damping ratios of the structure. OMA is a technique that identifies the modal parameters of a structure solely through measured acceleration responses, without the need for information regarding the input loads. This approach is particularly effective for ascertaining the modal parameters of both the primary structure and its damping devices [21]. Given the complexity of large-scale structures, OMA is well suited for the modal parameter identification of practical structures, offering a more applicable method for real-world applications. The OMA method can generally be divided into time-domain methods [22, 23] and frequency-domain methods [24, 25]. These approaches have been widely utilized in various large-scale civil infrastructure projects [26–28]. Peeters et al. [29] performed a comprehensive study of the OMA method based on the measured data from the Z24 Bridge and compared the modal parameter identification results obtained by different researchers. The stochastic subspace identification (SSI) method has been developed over several decades and is considered one of the most suitable methods for dealing with the OMA problem in civil engineering [30, 31]. They determined that the SSI method has certain advantages in avoiding the randomness and ambiguity that may arise during the OMA process. Similarly, the OMA method is also applied in the structure-damper-coupled systems for modal parameter identification. Weber et al. [32] employed the SSI method for the OMA of a footbridge equipped with TMDs and investigated the influence of seasonal temperature changes on the damping ratio of the main structure. Wang et al. [33] identified TMD parameters in coupled systems based on the SSI method and verified the effectiveness of the method using a numerical example of a three-layer frame. Cho et al. [34] conducted a full-scale field test on a 64-layer concrete building and derived the decoupled equations of the structure motion to identify the dynamic parameters of the secondary mass damper. Due to the influence of the field test environment and excitation equipment, the application of the aforementioned methods is somewhat limited. To account for uncertainties in modal parameter identification, a TMD parameter identification process based on Bayesian theory was proposed and applied to a 183 m-high concrete chimney to verify the reliability of the method [35].
Upon acquiring the modal parameters of the coupled system, it becomes imperative to ascertain the physics parameters of the TLD, including the effective sloshing mass ratio and the height of the liquid. In recent years, extensive research has been undertaken by scholars on the dynamics of structural-TLD-coupled systems. Typically, numerical simulations or equivalent mechanical models are employed to determine the physics parameters of TLD. Sigrist et al. [36] proposed a method for fluid-structure dynamic analysis using ANSYS, focusing on the accurate determination of TLD parameters. They validated this method by applying it to a nuclear reactor, ensuring its reliability for assessing the parameters of TLDs in such critical applications. Vilceanu et al. [37] developed a refined numerical model to assess the dynamic response of high-rise structures equipped with several TLDs. Considering the computational efficiency of numerical simulations, many researchers have used equivalent mechanical models to determine the modal parameters of TLDs. The Housner model represents the classical equivalent mechanical model for simulating liquid sloshing dynamics within a square water tank [38]. Tait et al. [39] developed linear equivalent mechanical models for square TLDs, cylindrical TLDs, and hybrid TLDs to describe the dynamic performance of TLDs. Yu et al. [40] established nonlinear stiffness and damping models using the principle of equivalent energy dissipation to describe the mechanical behavior of coupled systems. In equivalent mechanical models, equations have been formulated to define the natural frequency and damping ratio of a TLD. To calibrate the parameters within these equations, a comprehensive series of experiments was systematically carried out [41]. Determining the TLD parameters through numerical simulations will affect the computational efficiency of parameter identification methods. Explicit calculation formulas based on equivalent mechanical models allow for direct and rapid calculation of damper parameters, making them more suitable for the TLD parameter identification process.
Existing studies have predominantly focused on identifying the natural frequency and damping ratio of TMD, with relatively less research on the parameter identification of TLDs in coupled systems. In addition, TLDs are nonlinear vibration control devices characterized by multimodal and time-varying properties. In light of this, this paper derives the relationship between modal parameters, effective sloshing mass ratio, and liquid height based on the theoretical mechanical model of annular TLD (ATLD). A physics parameter identification method that leverages the mechanics-enhanced SSI method is proposed for the extraction of modal parameters of the ATLD within the coupled system. Numerical simulation methods were used to establish single-degree-of-freedom (SDOF) and multidegree-of-freedom (MDOF) coupled systems considering fluid-structure interaction. The dynamic responses obtained from the numerical coupled system under various excitations were employed to verify the accuracy of the identification method. Environmental noise with different noise levels was introduced to examine the robustness of the method. A dynamic test was conducted on a steel chimney model to analyze the impact of different liquid heights on the accuracy of ATLD parameter identification. The identification results obtained by the proposed method are crucial for ensuring the damping efficiency of the TLD, providing effective data support for the evaluation of the working condition of the TLD during its long-term service stage.
This paper is organized as follows. The theoretical development of the physics parameter identification method for TLD is summarized in Section 2. Section 3 and Section 4 provide the numerical simulation of structure-ATLD-coupled systems with various degrees of freedom for verifying the effectiveness and robustness of the proposed method. Section 5 presents the identification results of vibration response obtained from a high-rise chimney model. Finally, some concluding remarks are presented in Section 6.
2. Theoretical Development of the Parameter Identification Method for ATLD
2.1. Background of Covariance-Driven SSI
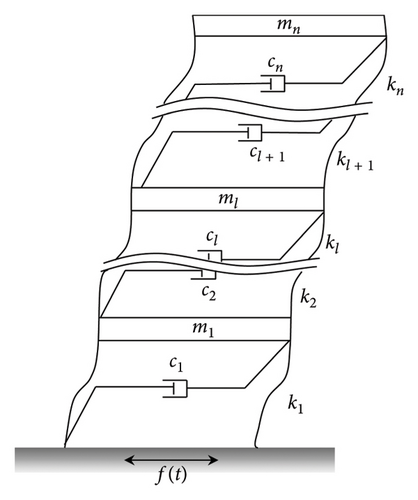
2.2. Modal Parameter Identification for Structure-TLD-Coupled Systems
2.3. Equivalent Mechanical Model of ATLD
The determination of the modal parameters for the ATLD through the SSI method is the foundation of estimating the liquid height using the ATLD’s equivalent mechanical model. The motion of the liquid within the ATLD can be modeled using the linear potential flow theory. It is assumed that the liquid in the ATLD is incompressible, inviscid, and irrotational. Figure 2 illustrates a schematic representation of the ATLD under these assumptions.
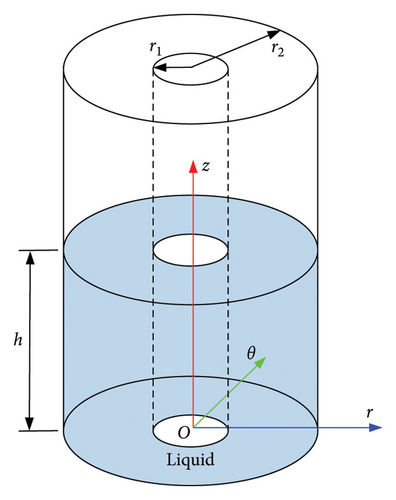
Typically, the first-order sloshing mass of the ATLD is considered with d = 1. Using the aforementioned equivalent mechanical model, the relationship between h, ωd, and ξd is established. The actual ATLD liquid height can be estimated using the identified natural frequency and damping ratio.
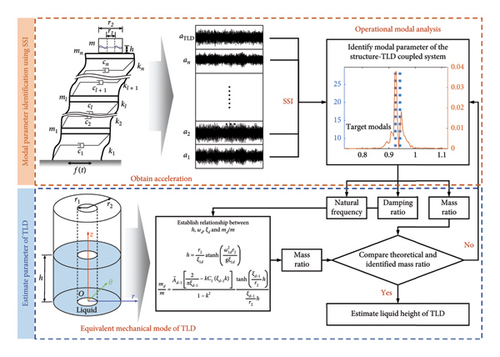
2.4. Calculation Procedure for ATLD Parameter Identification
- 1.
The dynamic structural response under external excitation is obtained from the actual structure and subsequently preprocessed.
- 2.
The state-space equations of the coupled system are formulated. The SSI method is utilized to identify the natural frequency fi, damping ratio ξj, and mode shapes ψj of the coupled system.
- 3.
The parameters of two modes relevant to the controlled mode are extracted for creating the state-space matrix A′ reflecting the characteristics of the ATLD based on the eigenvalue matrix Λ′ and mode shape matrix Γ′. The TLD natural frequencies ωD and damping ratios ξD are calculated using the elements from A′.
- 4.
The correlation between the TLD liquid height h, natural frequency ωD, and damping ratio ξD is established using the equivalent mechanical model. The identified TLD frequency is used to calculate the effective sloshing mass ratio. The theoretical mass ratio of the ATLD is calculated and verified against the identified mass ratio. If convergence requirements are not met, return to Step (2) for reassessment.
- 5.
The liquid height h in the ATLD is ultimately estimated.
3. Parameter Identification for the Numerical SDOF Structure-ATLD-Coupled System
3.1. Numerical Model of the SDOF Structure-ATLD System
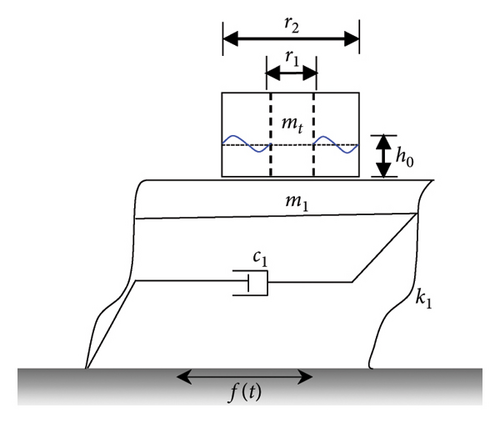
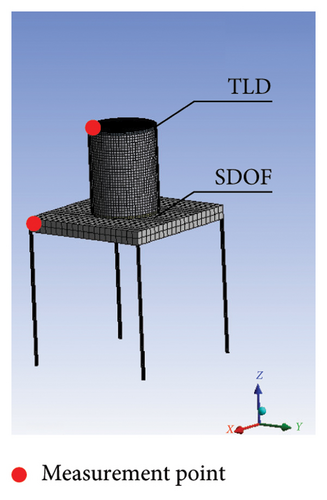
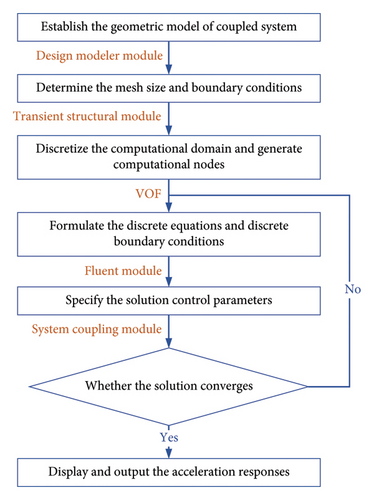
The key point of the numerical simulation for this coupled system is the establishment of the fluid-solid interaction (FSI) model, which is essential for simulating the liquid sloshing in the ATLD tank. The flowchart of FSI is illustrated in Figure 5. To precisely model the mechanical behavior of the coupled system, the mechanical and fluid modules within the workbench are utilized for nonlinear time history analysis and to investigate the liquid sloshing in the ATLD [37]. The geometrical models of the structure and ATLD were established using the design modeler module and imported into the transient structural module to define the material properties, boundary conditions, and mesh size, respectively. The numerical model of ATLD consists of a rigid tank and flexible liquid. The volume of fluid (VOF) model in the FLUENT is utilized for the ATLD’s numerical simulation. The ATLD being partially filled means that the two parts in the VOF model are water and air, with a surface tension coefficient of 0.073 N/m prescribed at the interface. The turbulence within the fluid is modeled using the RNG k-ε turbulence model, and a transient analysis approach is adopted to gain the acceleration response of the structure. No-slip boundary conditions are enforced on both the inner and outer walls and the tank’s base. Thermal transfer phenomena are not considered in this analysis. The interfacial surfaces of FSI are defined within both the FLUENT and transient structural modules, and a bidirectional coupling method is implemented to capture the interactions between the liquid and the tank. The system coupling module integrates the transient structural module and fluent module to enable mutual force transfer, facilitating nonlinear time history analysis of the coupled system.
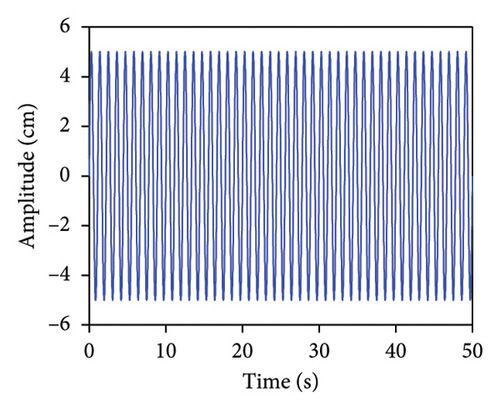
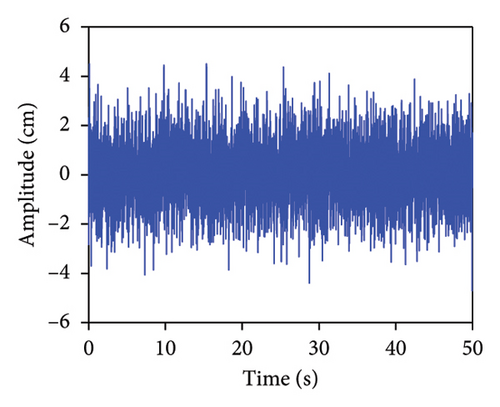
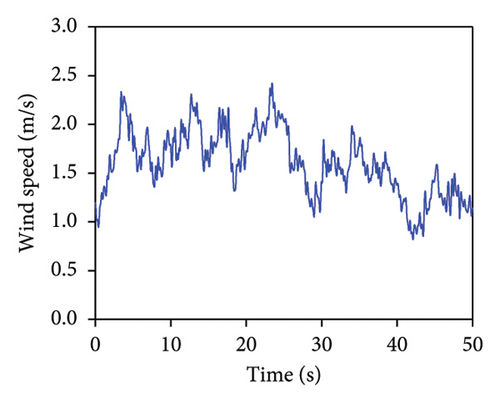
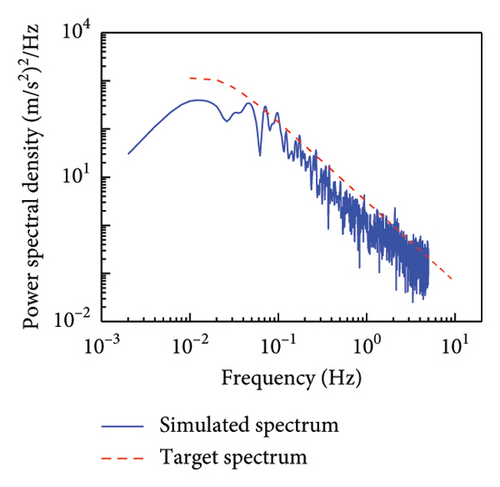
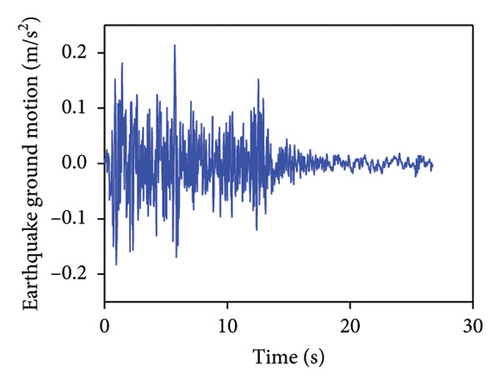
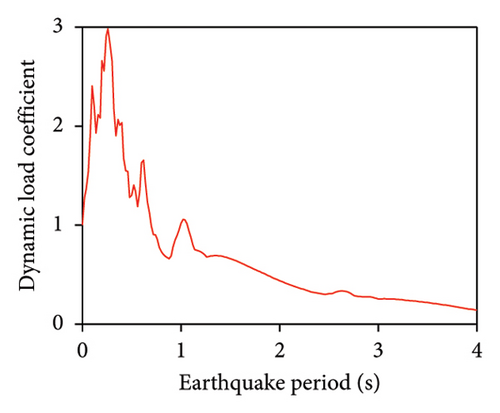
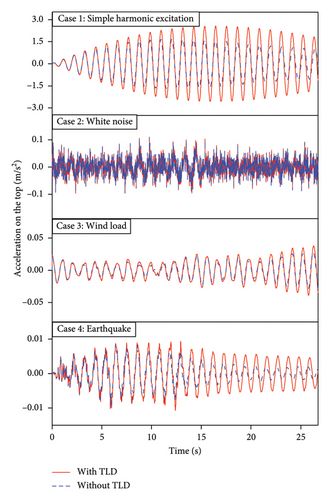
The acceleration responses of the coupled system under different excitations are used for the verification of the proposed method. The external excitations considered were simple harmonic, white noise, wind load, and EI-Centro earthquake. Figure 6 displays the time histories corresponding to these excitations. For the simple harmonic, a sinusoidal excitation with a 5 cm amplitude and a frequency of 100 Hz was employed. Gaussian white noise excitation, characterized by a zero-mean Gaussian distribution, was utilized to simulate random signals. The simulation of wind loads was performed using the harmonic synthesis approach, which characterizes fluctuating wind forces as cross-correlated, zero-mean Gaussian stationary random processes [45]. Lateral wind loads were quantified using the Kamal spectrum, assuming a wind velocity of 8 m/s at the reference height of 10 m. Earthquake simulations employed EI-Centro seismic waves, which were imposed in both the x and y directions of the abovementioned SDOF coupled system. Various excitation types were applied to the system to acquire the acceleration time histories for both the ATLD and the primary structure. Data acquisition for the acceleration was conducted at a frequency of 50 Hz over the sampling duration of 100 s.
3.2. Comparative Analysis for Parameter Identification Under Different Excitations
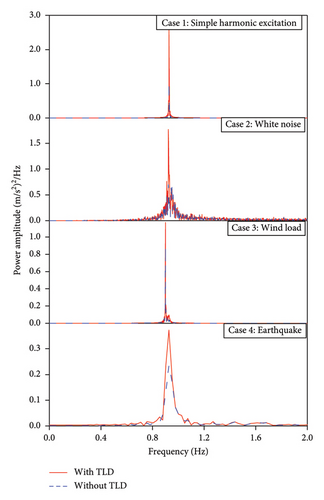
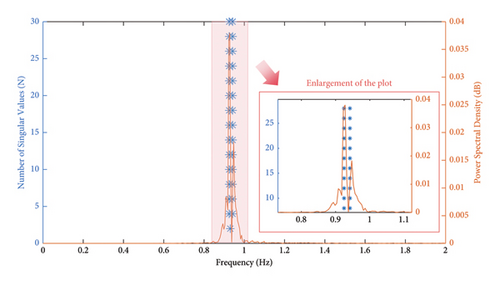
Taking the case with white noise as an example, the stabilization diagram obtained using the SSI method is shown in Figure 8. There are two stable axes in the stabilization diagram under white noise excitation, with identified frequencies of 0.91 Hz and 0.93 Hz. The identified first frequency closely matches the results obtained from numerical simulations, indicating good identification accuracy. Similarly, under the other three types of excitations, the stabilization diagrams also have two stable axes, with identified frequencies of 0.92 and 0.94, 0.93 and 0.93, and 0.91 and 0.94 Hz, respectively.
| Main parameters | Natural frequency (Hz) | Damping ratio (%) | Liquid height (m) | |
|---|---|---|---|---|
| Theoretical results | 0.94 | 0.064 | 0.4 | |
| Simple harmonic | Identified results | 0.97 | 0.062 | 0.382 |
| Relative errors | 3.10% | 3.13% | −4.50% | |
| White noise | Identified results | 0.98 | 0.061 | 0.425 |
| Relative errors | 4.10% | 4.69% | 6.25% | |
| Wind load | Identified results | 0.98 | 0.062 | 0.414 |
| Relative errors | 4.10% | 3.12% | 3.50% | |
| EI-Centro earthquake | Identified results | 0.97 | 0.068 | 0.384 |
| Relative errors | 3.10% | 5.88% | −4.00% | |
| Coefficient of variation | 0.51% | 4.38% | 4.65% | |
3.3. Sensitive Analysis in Noisy Environment
4. Parameter Identification for the Numerical MDOF Structure-ATLD-Coupled System
4.1. Numerical Model of the MDOF Structure-ATLD System
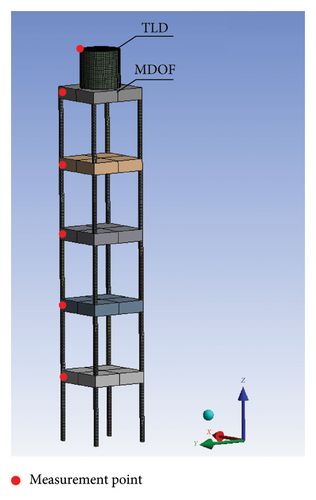
Section 3 addresses the parameter identification for ATLD within SDOF systems. However, real-world engineering structures are typically more complex, exhibiting multiple degrees of freedom, which necessitates validation of the proposed parameter identification theory’s effectiveness and reliability. The numerical examples contain the coupled systems with main structures possessing 3, 5, and 7 degrees of freedom, as illustrated in Figure 10. The red dots on the figure signify the locations from which structural acceleration data are obtained, with the derived acceleration serving to identify further modal parameters. For coupled systems of MDOF structures with ATLDs, variations in the degrees of freedom result in changes to the mass, stiffness, damping ratio, and the first natural frequency. Accordingly, the parameters of the ATLD were tailored to align with the diverse structural parameters, as shown in Table 2.

| Structural system | Main parameter | DOF | ||
|---|---|---|---|---|
| 3 | 5 | 7 | ||
| Main structure | mi (kg) | 1588.1 | 1638 | 6392.9 |
| ki (kN/m) | 366.9 | 1287.5 | 4946.1 | |
| Damping ratio (%) | 0.5 | 0.5 | 0.5 | |
| 1st natural frequency (Hz) | 0.51 | 0.99 | 0.67 | |
| TLD | r1 (m) | 0.1 | 0.05 | 0.05 |
| r2 (m) | 0.3 | 0.34 | 0.7 | |
| Liquid height (m) | 0.14 | 0.18 | 0.29 | |
| Damping ratio (%) | 6.4 | 6.4 | 6.4 | |
| 1st sloshing frequency (Hz) | 0.48 | 0.97 | 0.65 | |
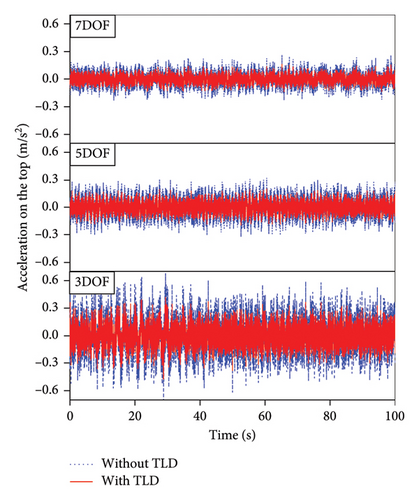
The environmental excitations (simple harmonic, white noise, wind load, and EI-Centro earthquake) were applied to the structure-ATLD-coupled system, and acceleration responses were recorded at the locations marked by red dots, with a sampling frequency of 100 Hz. Utilizing the refined numerical model of the MDOF structure, a nonlinear dynamic time history analysis was performed. This analysis resulted in the acquisition of acceleration responses from the coupled systems, each exhibiting varying degrees of freedom. A comparative analysis was conducted to examine the peak acceleration responses of the structure before and after the implementation of ATLD. Figure 11 presents the time histories of acceleration responses of the coupled systems when subjected to white noise excitation. The peak accelerations under each excitation were extracted, and it was statistically found that the peak accelerations of the coupled systems with different degrees of freedom decreased by 18.15%, 20.23%, and 19.87%, respectively. These results indicate that the TLD effectively reduced the amplitude of the structural dynamic response.
4.2. Comparative Analysis for Parameter Identification Under Different Excitations
The acceleration of the measurement points shown in Figure 10(b) is extracted as the input of the SSI method for identifying the modal parameters of the structure-damper-coupled system. The parameter settings for the SSI method can be referenced from Section 3.2 for eliminating spurious modes. Taking the white noise excitation condition as an example, the acceleration responses at various points of the 3-DOF system were inputted and a stabilization diagram was plotted as shown in Figure 12. There are four stable axes in the 3-DOF-coupled system, with corresponding natural frequencies of 0.43, 0.61, 1.18, and 1.67 Hz.
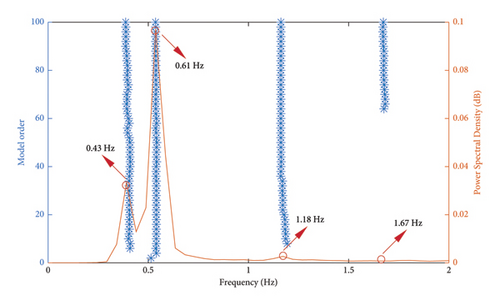
The modal parameters of the 5-DOF- and 7-DOF-coupled systems can be obtained by analyzing their acceleration responses using the SSI method. TLDs are typically used to control the first mode of the main structure, so the dynamic characteristics of the first two modes of the coupled system are of primary concern. The identified natural frequencies of the first two modes for the 5-DOF-coupled system are 0.95 and 1.01 Hz, respectively, and they are 0.61 and 0.75 Hz for the 7-DOF-coupled system. The identified modal parameters of the coupled system under various excitations were summarized to further calculate the TLD parameters in Table 3. It is found that the acceleration response includes information about the first two dynamic characteristics of the coupled system under various excitations. The relative deviation between the natural frequencies identified using the SSI method does not exceed 2%. Furthermore, the stable points of the first two modes are extracted. The state matrix reflecting the dynamic characteristics of the TLD is constructed, and the modal parameters of TLD are calculated.
| Degree of freedom | Orders | Identified natural frequency (Hz) | |||
|---|---|---|---|---|---|
| Simple harmonic | White noise | Wind load | EI-Centro earthquake | ||
| 3 | 1st | 0.43 | 0.42 | 0.43 | 0.44 |
| 2nd | 0.61 | 0.60 | 0.63 | 0.60 | |
| 5 | 1st | 0.95 | 0.93 | 0.94 | 0.92 |
| 2nd | 1.01 | 1.03 | 1.04 | 1.01 | |
| 7 | 1st | 0.61 | 0.62 | 0.64 | 0.63 |
| 2nd | 0.75 | 0.72 | 0.73 | 0.74 | |
Table 4 summarizes the calculated results of TLD parameter identification for each model. The relative error and COV are calculated to verify the efficiency and stability of the identification method. The identification results for MDOF structures are generally consistent with those for SDOF structures. The identification accuracy of the ATLD frequency is relatively high with the absolute value of the relative error not exceeding 2.0%. However, the identification accuracy of the TLD damping ratio and liquid height is relatively low. The main reason is that the TLD’s motion is composed of multiorder liquid sloshing, which has significant nonlinear effects leading to a decrease in the identification accuracy of the TLD damping ratio. According to equation (21), the calculation and identification of the liquid height are related to the frequency and damping ratio, and the identification error of the damping ratio will be transmitted to the identification of h. For coupled systems with different DOFs, the identification accuracy of the main ATLD parameters is generally consistent. By comparing the relative errors and COV of the parameters, the order of identification accuracy can be determined as follows: natural frequency > liquid height≈damping ratio. The results of the numerical examples indicate that this method can effectively estimate the modal parameters of the coupled system and the liquid height of the ATLD under different degrees of freedom and external excitations.
| Degree of freedom | Main parameters | Theoretical results | Identified results | Relative errors (%) | Coefficient of variation (%) |
|---|---|---|---|---|---|
| 3 | Natural frequency (Hz) | 0.480 | 0.472 | −1.67 | 1.0 |
| Damping ratio (%) | 0.064 | 0.068 | 6.25 | 3.5 | |
| Liquid height (m) | 0.140 | 0.135 | −3.57 | 2.7 | |
| 5 | Natural frequency (Hz) | 0.970 | 0.962 | −0.82 | 1.5 |
| Damping ratio (%) | 0.064 | 0.058 | −9.38 | 4.7 | |
| Liquid height (m) | 0.180 | 0.187 | 3.89 | 3.4 | |
| 7 | Natural frequency (Hz) | 0.650 | 0.639 | −1.69 | 0.9 |
| Damping ratio (%) | 0.064 | 0.059 | −7.81 | 3.5 | |
| Liquid height (m) | 0.290 | 0.279 | −3.79 | 3.1 | |
4.3. Sensitive Analysis in Noisy Environment
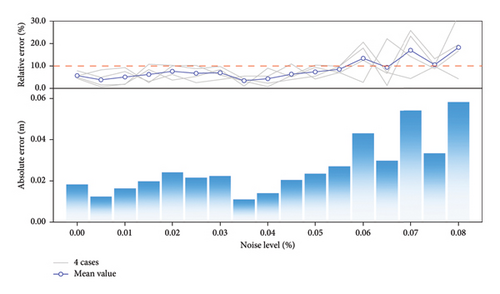
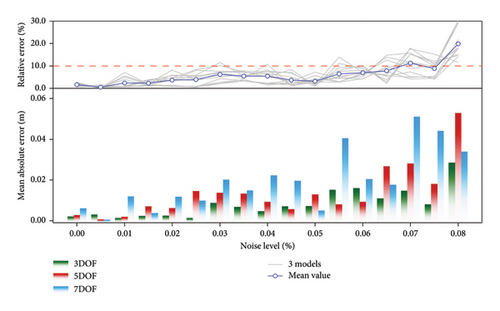
This study investigates the impact of environmental noise on the identification method for coupled systems with different DOFs. The range of noise levels is consistent with Section 3.3. According to equations (31) and (32), environmental noise is added to the simulated acceleration, which is used as input to calculate the dynamic characteristics of the ATLD, and further to determine the ATLD liquid height. The numerical examples contain the acceleration responses of models with three different degrees of freedom under four types of excitations. By analyzing the relative and absolute errors in the identification of the ATLD liquid height, the accuracy and robustness of the proposed method are examined. Figure 13 shows the identification errors of ATLD liquid height identification under different noise levels. The gray lines in the figure represent the relationship between the relative error and noise level for each example. It can be found that the dispersion of the identification results becomes greater as the noise level increases. When the measurement noise reaches 7.0%, the average relative error in TLD liquid height identification exceeds 10%. The main reason for this phenomenon is that environmental noise significantly affects the accuracy of damping ratio identification [48]. According to equation (21), the error in the damping ratio will be transmitted to the identification of the ATLD liquid height. The identification results for coupled systems with different degrees of freedom show a generally consistent trend with identification errors increasing with higher noise levels. Notably, the 7-DOF-coupled system exhibits significant identification errors even at low noise levels (R < 5.0%), with relative errors exceeding 10%. During the parameter identification process, the effectiveness of identifying the ATLD liquid height is determined by verifying the theoretical and identified mass ratios. The identification of the mass ratio in the 7-DOF-coupled system is particularly sensitive to environmental noise, leading to increased errors in the ATLD liquid height identification.
5. Application to Field Measurements on a High-Rise Chimney Model
5.1. Description of the Chimney Model and Dataset
Figure 14 depicts the designed high-rise chimney model. The inner diameter, outside diameter, and height of the chimney are 0.244, 0.25, and 9 m, respectively. The model is split into 9 segments, each 1 m high. The segments are joined by eight high-strength bolts with a diameter of 20 mm, while the bottom segment is attached to the ground transition plate by 4 high-strength bolts with a diameter of 30 mm, which are subsequently fixed to the ground. The modal analysis results suggest that the chimney model’s the first natural frequency without the TLD is 0.85 Hz.
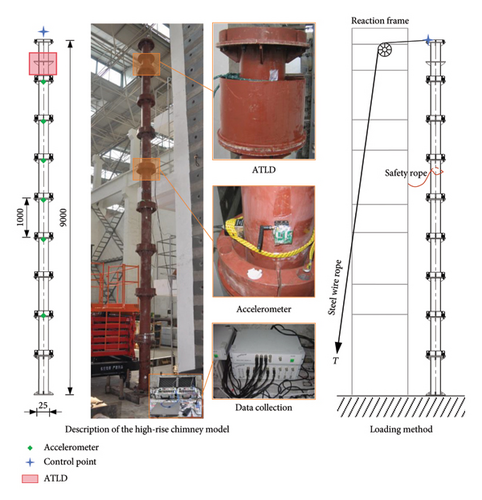
The ATLD is located in the two nodes at the top. In this test, the ATLD is primarily intended to control the chimney model’s the first modal. The ATLD water tank has an inner diameter of 0.135 m, an outside diameter of 0.225 m, an inner-to-outer diameter ratio of 0.6, and a height of 0.3 m. It is located in the center of the top section. Adjusting the liquid height in the tank can modify the ATLD’s natural frequency. To perform dynamic testing for ATLD structural vibration reduction, pure water is added to the designed annular tank and the liquid height is set to vary between 80 and 180 mm. Theoretical ATLD parameters are presented in Table 5. A free decay dynamic test was performed on the structure (Figure 13) to acquire the measured data on the structural dynamic response. When a specific force T is applied to the model’s top, the loading control point’s displacement achieves the preset value. The steel wire rope is released at that moment allowing the model to move freely and decay. The control point’s horizontal extending distance in this test is 5 mm.
| Serial number of model | 1 | 2 | 3 | 4 | 5 | 6 |
|---|---|---|---|---|---|---|
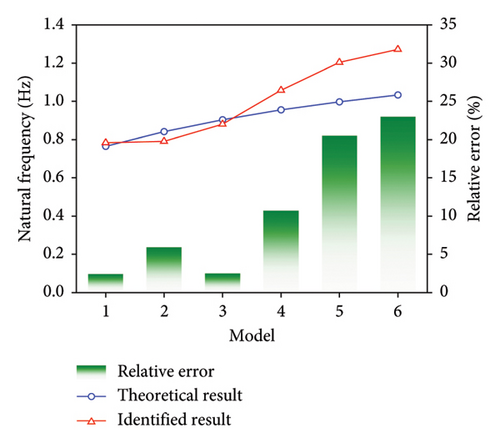
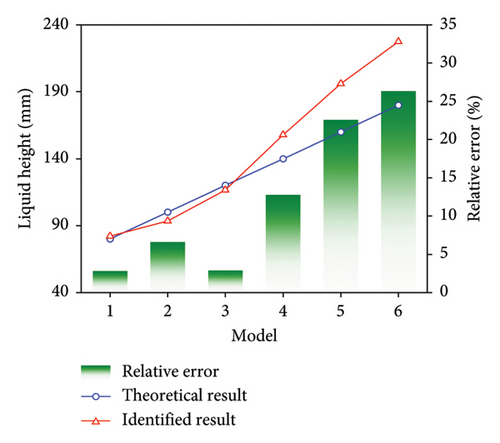
| Liquid height (m) | 0.08 | 0.10 | 0.12 | 0.14 | 0.16 | 0.18 |
| Natural frequency (Hz) | 0.765 | 0.841 | 0.904 | 0.956 | 0.998 | 1.033 |
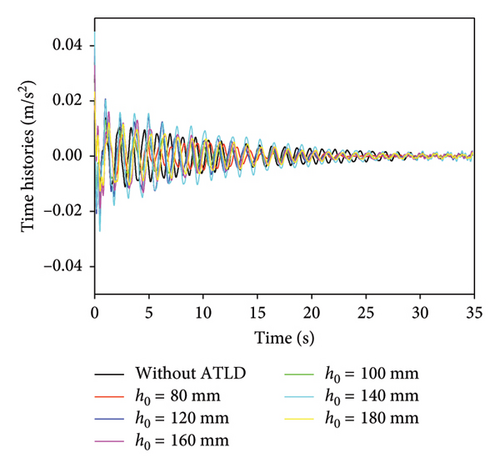
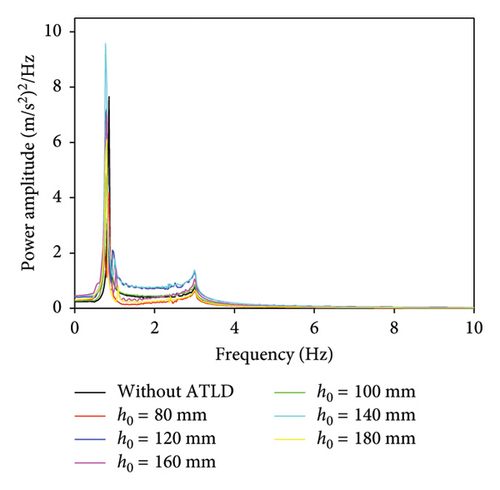
The time histories and analytical results for the acceleration at each chimney model’s middle nodes are displayed in Figure 15. The acceleration response attenuation rate of Models 1∼3 substantially increases. It attenuates to a small value in roughly 20 s as seen in the figure. This suggests that the ATLD in these models has a good control effect. On the other hand, Models 4∼6 do not exhibit an obvious attenuation in its acceleration response. Each model’s spectral peak values of the first mode follow a similar pattern, according to the FFT results. This phenomenon can be explained by the fact that the frequency ratio between the ATLD and the primary structure’s natural frequency should range between 0.9 and 1.1 when the ATLD achieves optimal vibration reduction efficiency. The ATLD frequency exceeds this optimal frequency ratio when the ATLD liquid height is greater than 120 mm, resulting in a detuning and an inability to properly carry out its vibration control.
5.2. Parameter Identification for ATLD in the Chimney Model
The SSI approach was applied to identify the modal parameters of the chimney model. The formulas for eliminating the spurious mode in Section 3.2 can be used to determine the parameters of the SSI approach. Using Model 1 as an example, the stability diagram depicted in Figure 16 was plotted using the acceleration responses at different locations as input.
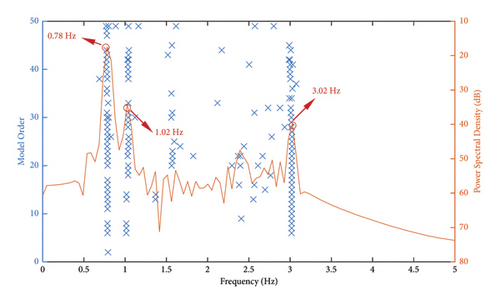
It is evident from the figure that this coupled system has three stable axes, each with a corresponding frequency of 0.78, 1.02, and 3.02 Hz. Using the calculation formulas from Section 1.2, the natural frequencies and damping ratios of the structure and ATLD were identified based on the eigenvalues and eigenvectors corresponding to the points on the stable axes, and the corresponding liquid heights were calculated. The calculation results are shown in Figure 17. It can be seen that the identification accuracy of the ATLD parameters for the first three models is relatively high. The relative errors of the liquid height and the natural frequency are both less than 5.0%. When the liquid height exceeds 120 mm, the identification accuracy of the proposed method rapidly decreases with the rise in the liquid height. The maximum relative error exceeds 25.0%. The rise in liquid height leads to a detuning phenomenon in the ATLD. The vibration energy of the second mode frequency of the coupled system becomes smaller, making it difficult for the SSI method to effectively identify the first two mode frequencies of the coupled system. The experimental results indicate that within the optimal frequency range, the proposed method can effectively identify the main parameters of the ATLD in the coupled system, and the variation in liquid level height has no significant impact on the identification accuracy.
6. Conclusions
- 1.
For an SDOF-coupled system, the identification accuracy of the damper’s natural frequency is relatively high, with an average relative error not exceeding 4.0%. It is found that the identification results of the ATLD damping ratio and liquid height have a higher degree of dispersion considering the COV of different parameter identification results. The identification results for the ATLD liquid height are generally consistent under different excitations. When the noise level of environmental noise exceeds 5.5%, the average relative error in identifying the ATLD liquid height exceeds 10%. The parameter identification results of MDOF coupled systems are generally consistent with those of SDOF-coupled systems. The identification accuracy for the ATLD natural frequency is relatively high, with the absolute value of the relative error not exceeding 2.0%. By comparing the relative errors and COV of the identification results of various parameters, the order of identification accuracy can be determined as follows: natural frequency > liquid height≈damping ratio. When the level of measurement noise reaches 7.0%, the average relative error in identifying the ATLD liquid height in MDOF coupled systems exceeds 10%.
- 2.
The identification results of the various numerical examples indicate that the proposed method can effectively identify the modal parameters of the structure-ATLD-coupled system and accurately estimate the ATLD liquid height. In coupled systems with different DOFs, when the measurement noise level is below 5.0%, the parameter identification results exhibit high accuracy demonstrating the robustness of the proposed method. However, the nonlinear effects of the ATLD can reduce the accuracy of the ATLD damping ratio identification, thereby increasing the identification error of the ATLD liquid height.
- 3.
The results of the model tests indicate that the proposed method effectively identified the natural frequency and liquid height of the ATLD with a relative error not exceeding 5.0% for the first three models. The frequency ratio between the ATLD and the main structure is one of the main factors affecting identification accuracy. Within the optimal range of frequency ratio, the proposed method can effectively identify the main parameters of the ATLD in the coupled system, and variations in liquid height have no significant impact on identification accuracy.
Conflicts of Interest
The authors declare no conflicts of interest.
Funding
This work is supported by the National Natural Science Foundation of China (52178294 and 52408200), Natural Science Research Projects of Colleges and Universities in Jiangsu Province (24KJB560022), Science & Technology Program of Suzhou (SYG202113), and Suzhou Science and Technology Plan (Basic Research) Project (SJC2023002).
Acknowledgments
This work was supported by the National Natural Science Foundation of China (52178294 and 52408200), Natural Science Research Projects of Colleges and Universities in Jiangsu Province (24KJB560022), Science & Technology Program of Suzhou (SYG202113), and Suzhou Science and Technology Plan (Basic Research) Project (SJC2023002).
Open Research
Data Availability Statement
All data, models, or codes that support the findings of this study are available from the corresponding author upon reasonable request.


