Improved Sparrow Search Algorithm for Sparse Array Optimization
Abstract
The synthesis problem of the number of array elements, array element spacing, and array formation is widely concerned in sparse array optimization. The local optimum problem is still an urgent problem to be solved in the existing optimization algorithms. A sparse array optimization algorithm on improved sparrow search algorithm (ISSA) is proposed in this paper. Firstly, a probabilistic following strategy is proposed to optimize the following strategy of the sparrow search algorithm (SSA), and it can improve the global search capability of the algorithm. Secondly, the adaptive local search and Cauchy–Gaussian mutation are used to avoid falling into the local optimum situation, and more high-quality areas are searched to improve the local extremum escape ability and convergence performance of the algorithm. Finally, the peak sidelobe level (PSLL) is used as the fitness function to adaptively optimize the position of the array elements. Experimental simulations show that the proposed approach has good main lobe response and low sidelobe response. In the sparse planar array, the sidelobe level decreases by −1.41 dB compared with the genetic algorithm (GA) and 0.69 dB lower than the SSA. In sparse linear array, the sidelobe level decreases by −1.09 dB compared with differential evolution algorithm and 0.40 dB lower than the SSA. The optimization of sparse arrays significantly enhances the accuracy and robustness of antenna array error estimation.
1. Introduction
In the wireless communication system, the antenna is an important component for transmitting and receiving electromagnetic waves and plays an extremely important role [1, 2]. Under certain conditions, sparse array not only uses relatively few array elements but also can achieve nearly full element array performance. With the development of optimization technology, traditional mathematical optimization methods have certain defects in solving complex optimization problems, such as linear programming and gradient descent methods. Furthermore, many excellent intelligent optimization algorithms have been used in the research of sparse array, and intelligent optimization algorithms have greater advantages in solving optimization problems of continuous, discrete, nondifferentiable functions and multipeak value optimization problems [3], such as the modified genetic algorithm (MGA) [4], the improved genetic algorithm (IGA) [5] based on vector mapping, and the improved artificial bee colony (IABC) algorithm based on domain modification [6]. Xiao et al., Chen et al., and Jia et al. increase array aperture by changing array spacing and sparse configuration, thus obtaining a successful high antenna resolution [3–5]. A self-adjusting mapping rule (SAM) particle swarm optimization (PSO) algorithm is proposed for the optimization of sparse rectangular arrays and array element position mapping problems under multiple constraints in [7]. For the problem of sparse planar arrays, the differential evolution algorithm is proposed for processing sparse planar array. To solve the problem of poor convergence speed and contradiction between search and development, scholars use genetic model to modify the bee colony algorithm to achieve the purpose of sparse linear array [8]. In order to solve the problem of reducing the sidelobe of sparse linear array under multiple constraints, scholars use the chaotic mapping SSA to optimize the linear array and the sparse array with low sidelobe level, obtaining good robustness and high efficiency [9]. These algorithms are mainly applied to the sparse processing of linear array but are less applied to other array formations. After improving the algorithm, most scholars only apply a single array formation and do not compare its application to other array formations.
In recent years, intelligent optimization algorithm is proposed to solve the highly complex optimization problem with great power, such as genetic algorithm (GA) [10, 11], PSO [12], artificial bee colony (ABC) algorithm [13], and SSA [14]. These algorithms are used in many fields. Among them, SSA has the characteristics of strong optimization ability and few parameters to be adjusted, which is of great significance in image processing, path planning, signal processing, and other engineering optimization problems. However, the intelligent algorithm has the problem of low population diversity in the late stage of iteration, and it is easy to fall into the local optimum. The sparrow search algorithm is affected by factors such as adjustable parameters, array formation type, and initial population optimal solution, which makes the algorithm stagnate in search and fall into local optima. The Cauchy–Gaussian mutation is applied to coal and gas outburst risk identification, and the optimization accuracy, convergence performance, and stability are good. The adaptive local search strategy is applied to the LQR control of active suspension and achieves good performance. Inspired by the following strategy of the chicken flock algorithm [15, 16], the chicken flock algorithm is combined with SSA to obtain a probabilistic following strategy. SSA is introduced into the sparse planar array problem for the first time. Cauchy–Gaussian mutation, adaptive local search strategy, and probabilistic following strategy are utilized in SSA. It is called ISSA. ISSA can improve the global search ability of the algorithm and solve the local optimal problem of sparrow algorithm.
Inspired by above literatures, a sparse array optimization algorithm on ISSA is proposed in this paper. Firstly, a new following strategy is proposed to optimize the iterative formula of the follower in SSA to improve the global optimization ability. Then, adaptive local search and Cauchy–Gaussian mutation are used to avoid local optimization and search stagnation, which improves the defects of SSA. Finally, the ISSA is used to optimize PSLL and obtain a sparse array with superior performance. Through the simulation of sparse planar array and linear array simulation with different array elements, the proposed method is feasible.
Besides, the optimization of sparse arrays significantly enhances the accuracy and robustness of error estimation. By structured design, such as sparse arrays based on set theory and theory of coprime numbers, the aperture and degrees of freedom of the array can be increased without increasing the system cost, thereby enhancing the system resolution and multitarget processing capability. In addition, the application of compressed sensing theory, such as the synchronous orthogonal matching pursuit least squares algorithm, achieves error calibration and signal reconstruction under low frame rate conditions, improving the accuracy of error estimation, reducing the calculation volume, and improving the accuracy of signal reconstruction. It can also process multiple frames of data. These optimization technologies jointly enhance the practicality and effectiveness of sparse array systems in actual applications.
The rest of this article is organized as follows: The sparse rectangular array model is presented in Section 2. ISSA is proposed and applied to sparse array processing in Section 3. The numerical simulation is given in Section 3, and the conclusion is given in Section 4.
2. Sparse Planar Array Optimization Model
The array aperture is nx × ny. At the same time, four array elements are fixed on four points of the rectangular plane boundary to ensure the aperture of the antenna array, and the coordinates are (x1,1, y1,1) = (0, 0), (x1,ny, y1,ny) = (H, 0), (xnx,1, ynx,1) = (0, L), and (xnx,ny, ynx,ny) = (H, L). The minimum array element spacing is 0.5λ.
3. ISSA
3.1. Improvement of Initial Population
In Equation (10), Xi is the individual sparrow and represents the position of array element. SA is the population number, which also stands for rectangular array; ubi and lbi are the upper and lower bounds of the population; and X is population space.
3.2. Discoverer Iteration Formula
In Equation (11), t is the number of current iterations; T is the maximum number of iterations; represents the position of the i sparrow in the t generation in the array; R stands for random number; and P is a constant matrix. R1 < ST indicated that the search environment of the population is safe and the discoverer could increase the search scope, thus leading the population to obtain higher fitness. R1 ≥ ST indicates that danger is detected and the population searches for a safe area.
3.3. Follower Updating Formula Improvement
In Equation (15), k ∈ [1, N], k ≠ i. As can be seen from Equation (15), the improved following strategy utilizes both the fitness position of the current round and the optimal value of the last round. The convergence is guaranteed, and there is no decreasing population diversity. It can take into account local exploitation and global search.
3.4. Adaptive Local Search
In Equations (16) and (17), ε is the adaptive adjustment coefficient and M is the number of iterations. It can be seen from Equation (17) that the adaptive adjustment coefficient decreases gradually with the increase of the number of iterations, thus jumping out of stagnation and balancing the search speed and optimization accuracy.
3.5. Cauchy–Gaussian Mutation
In Equations (18) and (19), represents the optimal individual position after variation, Cauchy(0, δ2) represents the Cauchy distribution random variable, and Gauss(0, δ2) is the Gaussian distribution random variable. λ1 and λ2 adaptively adjust the dynamic parameters and meet λ1 + λ2 = 1. In the search process, λ1 gradually decreases, and λ2 gradually increases, which makes the algorithm jump out of stagnation and adjusts the ability of local search and global search.
3.6. Early Warning Provider Formula
In Equation (20), is the current global optimal position; β is the step control parameter, which follows the normal distribution random number of 0–1. R is also a random number; fi and fw are the fitness of the current global optimal and worst individuals, respectively. ε0 is a controllable constant, and it is usually the smallest number. When fi > fg, sparrows in the population need to move closer to a safe area. When fi = fg, sparrows in the population adjust their positions to avoid predators.
3.7. Algorithm Step
By using ISSA, the individual sparrows in the algorithm are regarded as the array elements of different arrays, the dimension of sparrow position represents the transformation times of corresponding sparse array elements, and the optimal scheme of sparse array is obtained in the process of sparrow constantly updating its own position. The specific steps of the algorithm are as follows:
Step 1. Initialize the population size to represent the array element position, the number of discoverers PDNumber, the number of sparrows that found danger alarm SDNumber, and the upper and lower bounds ubi and lbi of the initial value of individual sparrows. Ceil function is used to round off the initial population to determine the element position. And set the element at a fixed position to avoid excessive degree of freedom, resulting in algorithm failure.
Step 2. Apply the initial population in Step 1 to generate multiple sparse arrays with different sparse rates.
Step 3. Calculate the fitness value of the current sparrow individual, that is, the PSLL of the current sparse array, and select the current optimal fitness and its optimal position xbest, as well as the current worst fitness, and its worst position xworst.
Step 4. Sort the fitness in Step 3, select sparrows with good fitness as discoverers according to Equation (11), select followers based on Equation (15) probability follower strategy, mutate sparrows with good fitness by using Equation (16) adaptive search strategy and Equation (18) Cauchy–Gauss mutation strategy, and get sparrows with better fitness by comparison.
Step 5. The SDNumber of sparrows are randomly selected from the sparrow population to conduct reconnaissance and alarm on the dangerous situation existing in the population environment. Update according to Equation (17).
Step 6. After the completion of each position update, judge whether the individual sparrow meets the constraint conditions. If not, revise the boundary. After correction, determine whether the element is used or not.
Step 7. After completing one iteration, fitness is recalculated, that is, PSLL of each array, and the optimal sparse array element distribution is updated.
Step 8. Check whether the algorithm has reached the maximum number of iterations and exits the loop if the conditions are met.
In order to enhance ISSA readability, the flow chart is shown in Figure 1.

4. Simulation and Analysis
4.1. Algorithm Performance Testing
In order to verify the effectiveness and advancement of the ISSA in sparse array optimization design, common test functions are selected, which originate from the test functions used in the International Conference on Evolutionary Computation (CEC). The classic benchmark functions are shown in Table 1. To illustrate the performance of ISSA, it was compared with the original SSA, fast cuckoo optimization search (FCS) algorithm [17], bald eagle search (BES) algorithm [18], slimy mould algorithm (SMA) [19], and dung beetle optimization (DBO) algorithm [20]. All algorithm parameters, except ISSA, were set according to the original study to ensure the effectiveness of the algorithms. As shown in Table 2, each of these algorithms was subjected to 20 independent experiments with 500 iterations to arrive at the optimal value.
| Test function | Dim | Range | Best value |
|---|---|---|---|
| 30 | [−100, 100] | 0 | |
| 30 | [−10, 10] | 0 | |
| 30 | [−100, 100] | 0 | |
| F4(x) = maxi{|xi|, 1 ≤ i ≤ n} | 30 | [−100, 100] | 0 |
| 30 | [−100, 100] | 0 | |
| 30 | [−30, 30] | 0 | |
| 30 | [−1.28, 1.28] | 0 | |
| 30 | [−500, 500] | −418.982 9D | |
| 30 | [−5.12, 5.12] | 0 | |
| 30 | [−600, 600] | 0 |
| Test function | ISSA | SSA | FCO | BES | SMA | DBO |
|---|---|---|---|---|---|---|
| F1(x) | 0.00e+00 | 0.00e+00 | 8.65e−106 | 0.00e+00 | 0.00e+00 | 1.40e−151 |
| F2(x) | 0.00e+00 | 2.32e−28 | 3.14e−62 | 0.00e+00 | 7.04e−195 | 1.45e−67 |
| F3(x) | 0.00e+00 | 0.00e+00 | 1.19e−62 | 0.00e+00 | 0.00e+00 | 4.22e−114 |
| F4(x) | 0.00e+00 | 0.00e+00 | 2.90e−45 | 0.00e+00 | 4.84e−168 | 4.46e−69 |
| F5(x) | 2.02e−07 | 5.27e−03 | 2.51e+2 | 0.79 | 2.28 | 2.56e+2 |
| F6(x) | 8.72e−14 | 2.04e−07 | 0.10e−3 | 0.00e+00 | 0.29e−2 | 2.11e−05 |
| F7(x) | 2.11e−05 | 8.17e−05 | 0.17e−3 | 3.699e−05 | 0.15e−3 | 0.60 e−3 |
| F8(x) | −1.26e+04 | −1.09e+04 | −6.67e+3 | −8.45e+3 | −1.26e+4 | −7.92 e+3 |
| F9(x) | 0.00e+00 | 0.00e+00 | 0.00e+00 | 0.00e+00 | 0.00e+00 | 4.4409e−15 |
| F10(x) | 0.00e+00 | 0.00e+00 | 0.00e+00 | 0.00e+00 | 0.00e+00 | 0.00e+00 |
As can be seen from Table 2, various algorithms have different search abilities under different test functions. What is more, ISSA is basically better than other intelligent algorithms, and there is a large gap in the search ability of each algorithm under Test Function 5. Thus, Test Function 5 is selected. The convergence curves of the algorithms at Test Function 5 are shown in Figure 2.
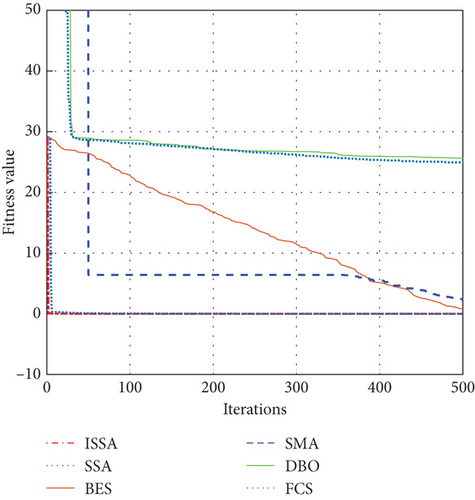
It can be seen from Figure 2 that ISSA not only converges well but also its convergence speed is significantly higher than other algorithms. ISSA and SSA can converge quickly, while the convergence speed of DBO, SMA, FCS, and BES is not good—BES iteration 500 times still failed to converge. In terms of convergence effect, ISSA and SSA have the best convergence effect, while DBO and FCS have poor convergence effect.
4.2. Simulation Effect Analysis of Planar Array
In order to verify the effectiveness and advancement of the ISSA in sparse array optimization design, two sets of simulation are carried out in this paper: planar array sparse and linear array sparse. In order to ensure the fairness of the comparison, the experimental data are set as follows: Array elements are 100 and 200, the coordinate origin is taken as the starting point of the plane rectangular array, the constraint antenna unit spacing is greater than or equal to 0.5λ, the population is 30, the number of iterations is 300, the probability of discovery is 0.2, and the warning value is 0.8.
4.2.1. Comparison of PSLL of Different Algorithms
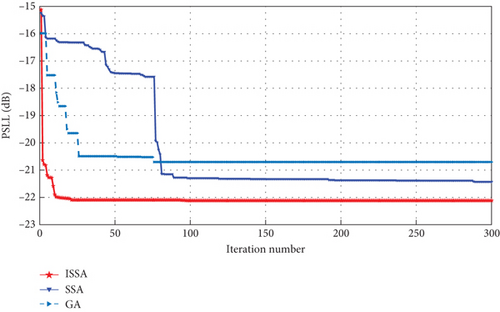
In this section, convergence speed, optimal convergence value, main lobe width, and secondary lobe are studied. The convergence diagram of the fitness function and the array direction diagram of the three algorithms are compared. Firstly, the 3D radiation patterns of the three algorithms are compared. The 3D radiation pattern of the 100-element planar array of SSA is shown in Figure 3. The 3D radiation pattern of the 100-element planar array of ISSA is shown in Figure 4. The 3D radiation pattern of the 100-element planar array of GA is shown in Figure 5. The adaptation curve graph of ISSA, SSA, and GA is shown in Figure 6. The beam patterns of the 100-element planar array of ISSA, SSA, and GA were optimized.

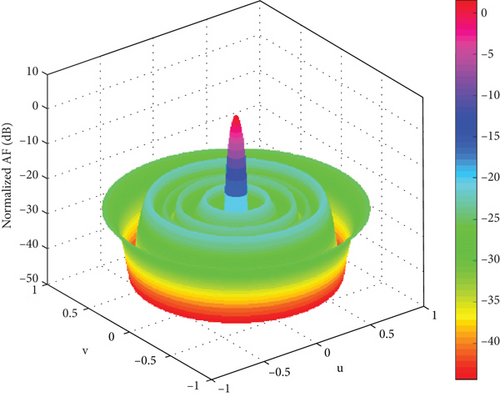
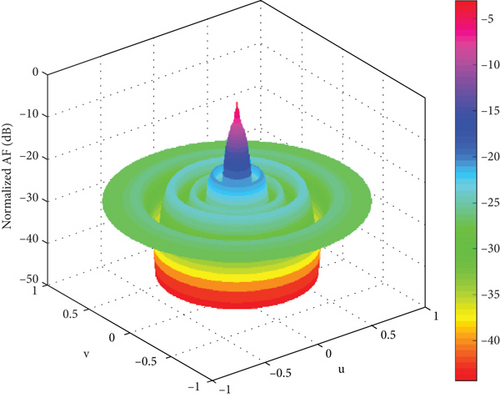
It can be seen from Figures 3, 4, and 5 that ISSA can effectively reduce the PSLL. By comparing Figures 3 and 4, it can be seen that in the sparse planar array, the distribution of the main lobe direction, sidelobe situation, and radiated power in the three-dimensional radiation diagram of SSA and ISSA is still good. ISSA is significantly better than SSA in suppressing sidelobe. Compared with the GA in Figure 5, the main lobe of the GA fluctuates, and the suppression effect of the sidelobe is poor, which is not conducive to accurately receiving the expected signal. In short, ISSA performs better in sparse planar arrays. The directivity of the main lobe is better, and the suppression of the secondary lobe is lower.
It can be seen from Figure 6 that PSLL = −12.12 dB of ISSA, PSLL = −21.43 dB of SSA, and PSLL = −20.71 dB of GA. Compared with SSA and GA, the PSLL of ISSA is 0.69 and 1.41 dB lower than SSA and GA. Therefore, the search accuracy of ISSA is better. As can be seen in Figure 6, ISSA, SSA, and GA converge to the optimal value at the end of the 26th, 289th and 76th iterations, respectively. By comparing the data of the three algorithms, the convergence speed of ISSA is faster, and the optimization ability is stronger. As can be seen from Figure 7, the main lobe beamwidths obtained by the three algorithms are similar, and the sidelobes are effectively suppressed, but ISSA has the lowest suppression, so ISSA is still effective in optimizing sparse planar arrays.
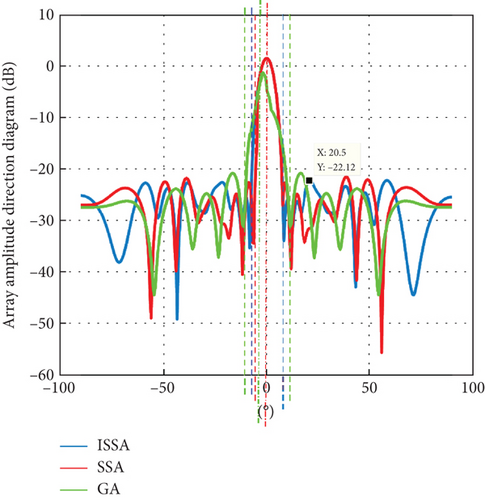
To further illustrate the performance of the algorithms proposed in this paper, Table 3 compares several intelligent algorithms. Five algorithms, GA, PSO [7], MDE, SSA, and ISSA, are compared. By comparing the best value, the worst value, and the average value of the fitness function, the optimization ability and robustness of the algorithm are demonstrated. The fitness function adopts PSLL, and a low PSLL indicates that the antenna radiates less power in the nonmain radiation direction, which is conducive to reducing the interference to the target in the sidelobe direction and improving the signal purity and reliability.
| Algorithm | PSLL (mean) | PSLL (max) | PSLL (min) |
|---|---|---|---|
| GA | −20.71 dB | −18.63 dB | −20.82 dB |
| PSO [7] | −20 dB | −19.93 dB | −21.50 dB |
| Modified DE | −18.52 dB | — | — |
| SSA | −21.43 dB | −18.17 dB | −21.89 dB |
| ISSA | −22.12 dB | −20.14 dB | −24.48 dB |
In [7], PSO is used to optimize the SAM algorithm, and the optimal PSLL of the obtained direction map is −20 dB. The improved DE algorithm adopted is used to optimize sparse arrays. Only by increasing the number of grids twice can the optimization effect be equivalent to the algorithm in this paper. In the case of the same grid, the sidelobe level of ISSA drops about 3.6 dB. Compared with GA, PSO, modified DE, and SSA, the mean PSLL of ISSA is lower than that of the above algorithms, reducing 1.41, 2.12, 3.6, and 0.69 dB, respectively, so better sidelobe suppression ability of ISSA is shown. The comparison of the two maximum values in Table 3 shows the superiority of ISSA, which can optimize sparse arrays more effectively.
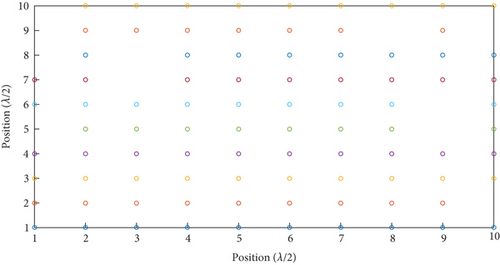
The array distribution of SSA and ISSA optimization is shown in Figures 8 and 9. As can be seen from Figures 8 and 9, ISSA has lower array sparsity rate and uses fewer elements but achieves better suppression. As a result, ISSA can save cost more effectively and achieve the purpose of optimizing sparse array.

By simulation and comparison, it can be concluded that ISSA can effectively sparse array under different formations, effectively reduce sidelobe, and achieve the purpose of reducing engineering cost and improving beam performance. In order to improve the performance of the further algorithm and improve the parameter setting, the following optimization is carried out from the two aspects of population number and array number.
4.2.2. Changes in Population Number and Comparison of PSLL
It can be seen from Figure 6 that the ISSA has obvious convergence effect in the early stage of iteration, and better PSLL can be obtained by adjusting the population number. Optimize against a rectangular array with 100 elements, the population number is 300, the number of iterations is 5, other conditions are unchanged, and independent experiments is 20 times. Take the optimal value of each time to save. The PSLL of 20 independent experiments and the optimal sparse array normalized orientation plots for the 100-element planar array of ISSA and SSA is shown in Figure 10.
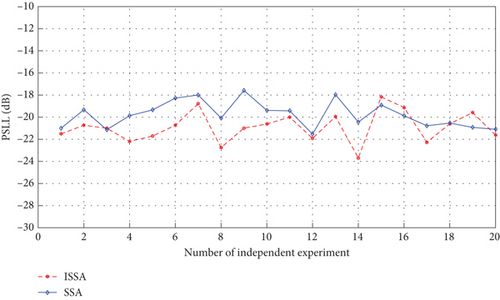
As can be seen from Figure 10, the optimal value of ISSA is −24 dB, and the worst value is −18.2 dB. The optimal value of the SSA is −21.9 dB, and the worst value is −17.9 dB. It is indicated that changing the number of initial population can improve the optimization effect.
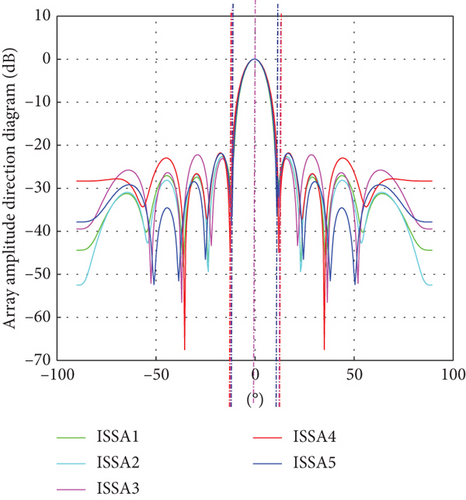
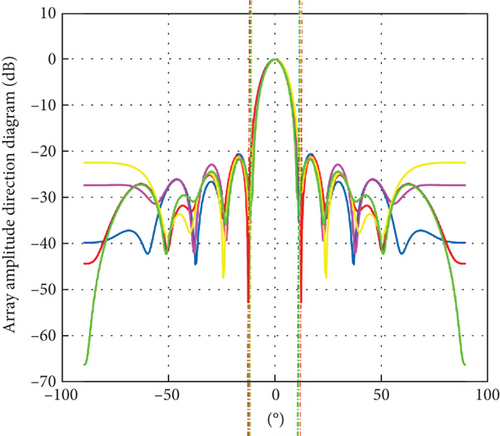
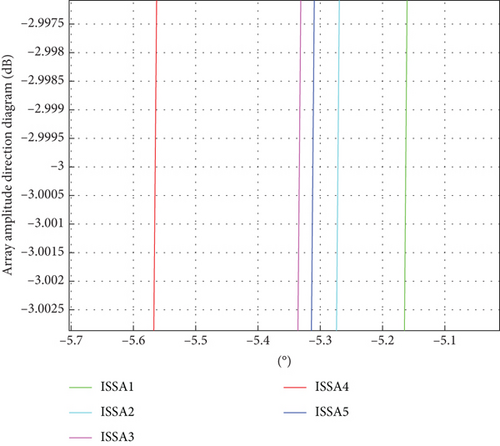
Then, optimal sparse array normalized direction diagram of ISSA and SSA is compared, as shown in Figures 11 and 12. As can be seen in Figures 11 and 12, the ISSA3 curve and the SSA5 curve are optimal. In Figure 13, at 3 dB beamwidth, the ISSA3 curve is in the middle of the beamwidth, which is 0.17° wider than the narrowest beamwidth, and the level of the side flap decreases by 0.6 dB. In Figure 14, at 3 dB beamwidth, the SSA5 curve is in the middle of the beamwidth, 0.15° wider than the narrowest beamwidth, and the side flap level drops by 0.42 dB. Comparing the two algorithms, the beamwidth broadens by about 0.3°, and the side flap level decreases by 1.97 dB. By multiple simulations, it can be concluded that increasing the population size in ISSA parameters can effectively reduce the sidelobe and improve the beam performance.

4.2.3. Expansion of the Array Scale and Comparing PSLL
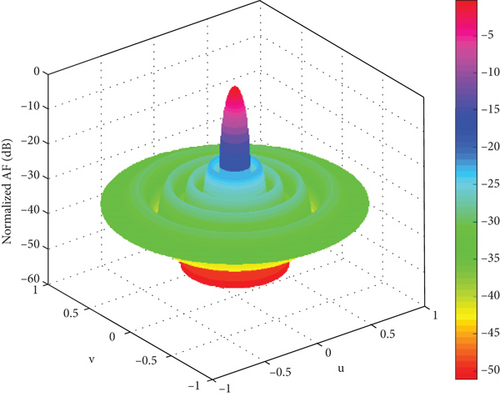
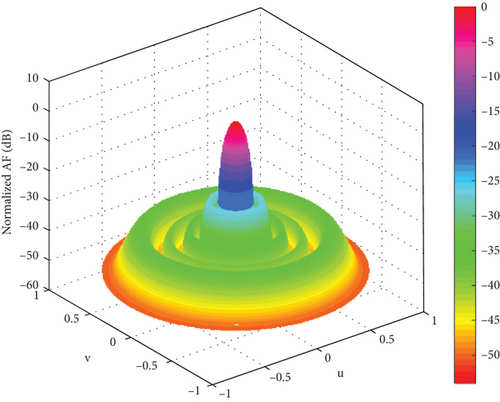
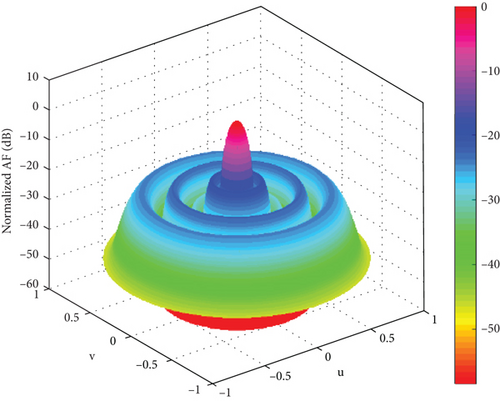
In order to further verify the applicability of the proposed algorithm in array antenna optimization, the proposed algorithm is applied to a larger rectangular plane array, and the number of grids is set as 20 × 10, the number of population is 500, the number of iterations is 50, and the other parameters remain unchanged. The algorithm in this paper is compared again with the algorithm in the literature, and 20 independent experimental simulations are carried out. Figure 15 shows the 3D radiation pattern of the 200-element planar array of SSA, and Figure 16 shows the 3D radiation pattern of the 200-element planar array of ISSA; the obtained 3D radiation pattern has good directivity.
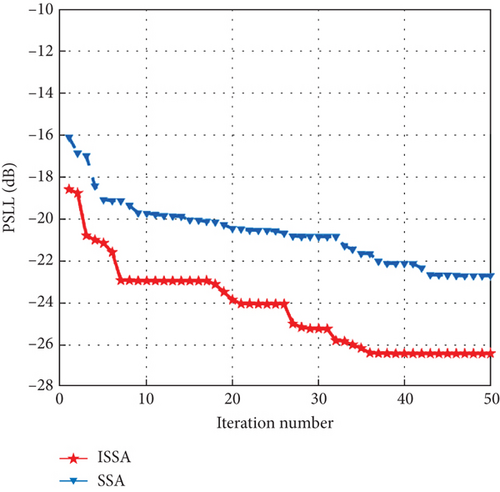
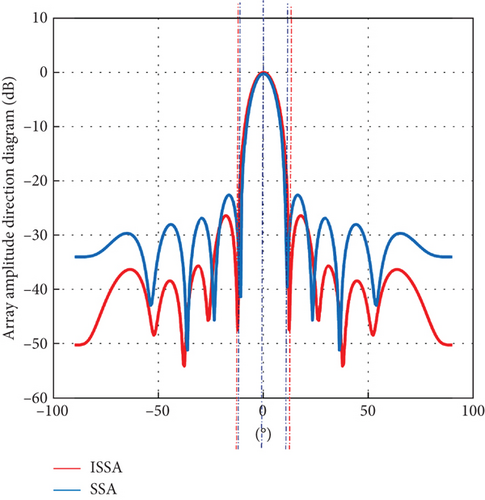
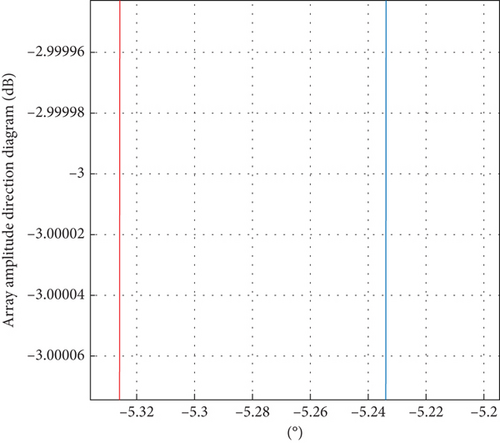
It can be seen from Figure 17 that ISSA is still effective in inhibiting PSLL. The PSLL of the proposed algorithm is −26.4 dB, and the PSLL of the SSA is −22.6 dB. Compared with the method of increasing raster number in [7], the optimal value is improved. The algorithm in this paper increases the number of raster, and the algorithm is still valid. Sparse array normalized direction diagram of the 200-element planar array of SSA and ISSA is shown in Figure 18. From Figure 18, the beamwidth of ISSA is widened by about 0.09°, and the sidelobe level of ISSA is reduced by 3.8 dB compared to SSA. It can be seen from Figure 19 that ISSA widens the beamwidth by about 0.09° and reduces the sidelobe level compared with SSA 3.8 dB. By the simulation in this section, it can be concluded that expanding the array size can effectively reduce the sidelobe and improve the beam performance.
4.3. Application of Linear Sparse Array
In order to verify the applicability of our algorithm in different arrays, the simulation is under linear array. For comparison with other literatures, the array is set as 78 elements, which is approximately a symmetric distribution line array at the center of the array. The algorithm parameters are consistent with those of rectangular planar arrays and with the carried out 20 independent experiment simulations. The 3D radiation patterns of 78-element linear array of SSA optimization are given in Figure 20. The 3D radiation patterns of 78-element linear array of ISSA optimization are given in Figure 21. The convergence curve of fitness function of linear array is shown in Figure 22. The beam direction diagrams of the two algorithms are shown in Figure 23. The comparison with other algorithms is shown in Table 4.
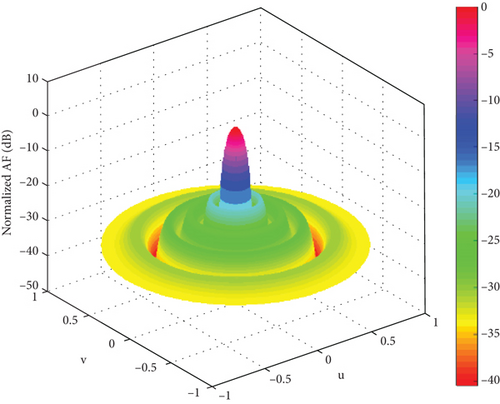
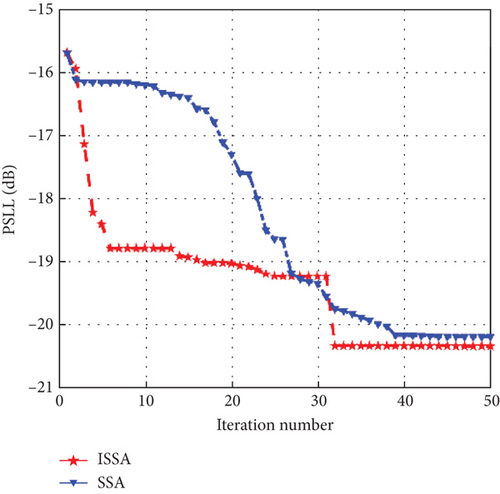
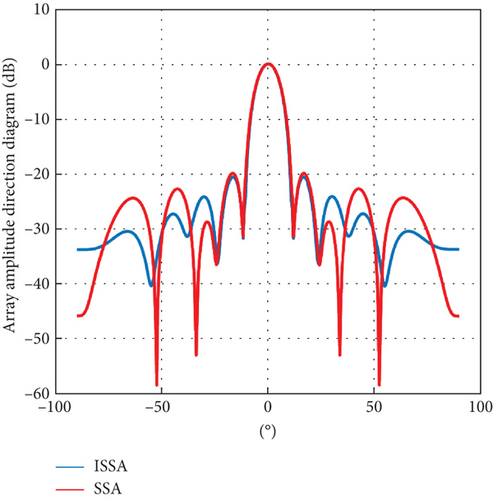
Under the same experimental conditions, the PSLL of ISSA is −20.60 dB, while the SSA optimal value PSLL is −20.20 dB. The optimal PSLL of CSSA is −20.70 dB in [9], and the results obtained by the algorithm in this paper are similar to those obtained by CSSA. However, the ISSA finds the optimal value in the 32nd iteration, while the fastest algorithm in [9] finds the optimal value after the 200th iteration. Compared with [8], the GMIABC algorithm finds the optimal value after the 180th iteration, and the optimal value is −19.37 dB. The binary difference evolutionary algorithm was proposed in [21], and its optimal PSLL is −19.51 dB after 100 iterations. Compared with the GMIABC algorithm, NBDE algorithm, and SSA, the optimal value of PSLL decreases by 1.23, 1.09, and 0.4 dB, respectively, which is equivalent to the sparse array of CSSA proposed for the first time. Through the above simulation, it can be concluded that this algorithm has good applicability in sparse linear array. In Figure 22, 5–32 iterations fall into local optima and then jump out of local optima, indicating the necessity of an adaptive search strategy. Through adaptive steps, the search direction can be effectively changed to better explore high-quality regions. As can be seen from Table 4, compared with GMIABC, NBDE, and SSA, the average PSLL of ISSA is reduced by 1.23, 1.09, and 0.4 dB, respectively, showing better sidelobe suppression ability and good robustness of ISSA. ISSA can optimize the sparse array more effectively.
5. Conclusions
In this paper, ISSA is used to suppress the PSLL value of sparse rectangular planar arrays, which is introduced by the improvement of the follower strategy and two strategies. Letting them operate in parallel to jointly find the search direction for the next round is effective, and its suppression of PSLL values is significantly higher than the latest similar algorithms. In planar rectangular arrays, ISSA has significant advantages of 1.41, 0.62, and 3.6 dB over the improved algorithms of GA, PSO, and DE, respectively. Meanwhile, by applying the proposed algorithm to linear sparse arrays, it achieves similar suppression effects compared with the latest similar algorithms, which are 1.09 and 1.23 dB lower than the NBDE and GMIABC algorithms, respectively, which verifies the wider applicability and better performance of ISSA. ISSA not only has the faster convergence speed of the algorithm but also the better convergence value is obtained. Thus, ISSA has wider applicability and better performance.
Conflicts of Interest
The authors declare no conflicts of interest.
Funding
This work is supported by the Natural Science Foundation of Anhui Province (Grant Nos. 2108085QD182, 2108085MF196) of China and the Natural Science Research Project of Education Department of Anhui Province (No. KJ2019A0566) of China.
Open Research
Data Availability Statement
The data is available within the article.


