Phylogeographic Structure of Five-Toed Jerboas of the Genus Scarturus (Dipodoidea and Allactaginae) With Taxonomic Clarification in Türkiye
Abstract
Understanding the genetic structure and phylogeographic patterns of Scarturus species is crucial for accurately delineating their taxonomic status and informing conservation strategies. This study explores the genetic differentiation of Scarturus williamsi, S. aulacotis, and S. elater species complex across Turkish populations by analyzing mitochondrial (Cytb, 12S rRNA, and 16S rRNA) and nuclear (IRBP) gene sequences. Our phylogenetic analyses have firmly established the monophyly and distinct species status of S. williamsi and S. aulacotis (formerly known as S. euphraticus), challenging previous subspecies classifications. Within S. williamsi, we identified five distinct lineages from Cytb sequences, illustrating a complex population structure shaped by geographical and ecological factors. Notably, the Niğde population emerged as a unique and ancient lineage, likely influenced by historical isolation. Our findings further indicate that S. aulacotis encompasses two divergent lineages, one spanning Syrian samples and the other Turkish and Iranian samples, both now classified under the revised taxonomy of S. aulacotis. Analysis of the S. elater species complex unveiled three distinct subclades, with the Turkish population aligning closely with Iranian and Armenian samples, identified as S. indicus aralychensis within the S. indicus superspecies.
1. Introduction
The genus Scarturus Gloger, 1841, which includes both four- and five-toed jerboas, is a pivotal group within the subfamily Allactaginae. These nocturnal rodents, adapted to semidesert and steppe environments, utilize their elongated hind legs for rapid movement across sandy and gravelly terrains. As omnivores, they feed on a diverse diet of plant material, seeds, insects, and larvae. The distribution range of the genus Scarturus extends from North Africa to Western Asia, covering the Anatolian Peninsula, the Caucasus, and Central Asia [1].
Recent taxonomic revisions by Michaux and Shenbrot [1] list seven species within the genus Scarturus: S. williamsi, S. aulacotis, S. euphraticus, S. hotsoni, S. elater, S. vinogradovi, and S. tetradactylus. In Anatolia, three species—S. elater, S. aulacotis (previously recognized as S. euphraticus), and S. williamsi—are found in ecologically distinct regions [1–3]. Scarturus williamsi predominates in western, central, and northern Anatolia; S. aulacotis, which includes populations previously classified as S. euphraticus, is found in southern Anatolia; and S. elater is localized to specific areas in Iğdır.
Scarturus williamsi [4], occurring throughout central, eastern, and western Anatolia, shows variable subspecies classifications, historically based on morphological and coloration differences. These include S. williamsi laticeps [5] west of the Ceyhan River, S. williamsi shmidti [6] in northern Eastern Anatolia, and S. williamsi williamsi [4] around Van and Iğdır [7]. The taxonomic delineations between S. euphraticus and S. williamsi have been subject to considerable debate; Atallah and Harrison [8] considered S. williamsi a subspecies of S. euphraticus, whereas Çolak, E. Kıvanç, and N. Yiğit [9] upgraded it to species status following detailed morphological, morphometric, and phallic analyses. Further, Çolak and Yiğit [10] identified a new subspecies, S. e. kivanci, in southeast Anatolia, while another subspecies, S. e. caprimulga [11], has been reported from Afghanistan. Molecular studies by Kryštufek et al. [12] discerned two clades of S. euphraticus: one encompassing specimens from Harran (Türkiye) and Iran and another from Syria. Recent revisions by Michaux and Shenbrot [1] and further genetic data by Lebedev et al. [3] have updated the taxonomic status of S. euphraticus to S. aulacotis.
Scarturus elater, the smallest species in the genus, is broadly distributed across Asia but is only documented in Aralık (Iğdır) within Türkiye. The recognized subspecies include S. e. elater Lichtenstein, 1825 (type locality: Kazakhstan), S. e. indicus Gray, 1842 (type locality: Afghanistan), S. e. caucasicus Nehring, 1900 (type locality: Azerbaijan), and S. e. aralychensis Satunin, 1901 (type locality: Aralık, Türkiye). However, recent studies by Bannikova et al. [13] suggest that S. elater is part of a complex of cryptic lineages, with distinct subgroups such as S. indica and S. aralychensis, indicating a need for taxonomic reevaluation of these subspecies.
Prior research on the Scarturus genus in Türkiye has primarily focused on morphological and karyological characteristics [7–11, 14–21]. Despite the extensive morphological and karyological insights into the genus Scarturus, molecular studies remain remarkably limited and have not comprehensively addressed the taxonomic ambiguities within the Turkish populations of Scarturus species [3, 12, 13, 22]. Critical unresolved issues include subspecies differentiation within S. williamsi, the validation of S. e. aralychensis, its phylogeographic relationships with other S. elater populations in nearby regions, and the taxonomic status of S. aulacotis and S. williamsi in Türkiye. These uncertainties hinder our understanding of the evolutionary relationships and ecological adaptations within the genus. Our study aims to address these critical gaps by utilizing advanced molecular techniques, including analyses of Cytochrome b, 12S rRNA, 16S rRNA, and IRBP genes. By elucidating the genetic structure and phylogenetic relationships among Scarturus species, this research seeks to clarify taxonomic classifications and enhance the framework for biodiversity conservation in semiarid and arid landscapes.
2. Materials and Methods
2.1. Sample Collection and DNA Extraction
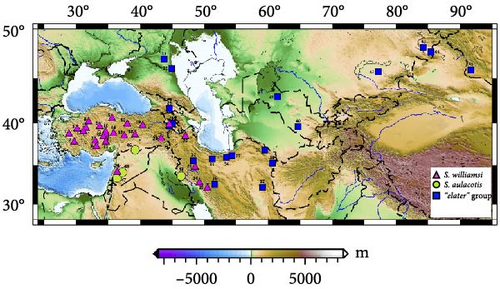
In this study, we analyzed gene regions Cytb, 12S rRNA, 16S rRNA, and IRBP to investigate the phylogenetic relationships and taxonomic status of three Scarturus species identified in Türkiye: S. williamsi, S. aulacotis, and S. elater. We sequenced a total of 60 new Scarturus specimens, collected from 20 different locations across Türkiye (Figure 1). Additionally, our analysis included 34 samples representing various Scarturus species. For all gene regions, Dipus sagitta and Jaculus jaculus were utilized as outgroups. The sequences generated in this study are available on GenBank under the following accession numbers: Cytb (MG255325−MG255411 and PQ064096−PQ064104), 12S rRNA (PQ068758−PQ068812), 16S rRNA (PQ066042−PQ066097), and IRBP (PQ041892−PQ041934 and PQ063997−PQ064009). Detailed information regarding all specimens used in this study is provided in Table S1.
Genomic DNA was extracted from ear tissue samples using the methods described by Rogers and Bendich [23] and Gaubert and Zanatello [24]. The DNA concentration and purity were assessed using a NanoDrop ND–1000 spectrophotometer.
2.2. PCR Amplification and Sequencing
To amplify the Cytb gene, we utilized two overlapping segments. The first segment was amplified using the universal primers L14724 [25] and H15154 [26], and the second segment was amplified with primers L15162 [27] and H15752 [28]. The 12S rRNA region was amplified using primers L1091 and H1478 [29], while the 16S rRNA region was amplified with primers L2513 and H2714 [30]. For the IRBP gene region, we used primers F25dip and R701dip as described by Lebedev et al. [31]. The PCR protocols for each gene region, including cycling conditions are detailed in Table S2, following the procedure outlined by [32]. The PCR products were visualized on an agarose gel and sequences were subsequently converted to FASTA format using FinchTV software (https://digitalworldbiology.com/FinchTV). Sequence editing was performed using BioEdit version 7.2.5 [33]. Alignment of the sequences was conducted using the MUSCLE algorithm implemented in MEGAX software [34].
2.3. Phylogenetic and Genetic Diversity Analyses
Phylogenetic trees for each gene region were constructed using maximum likelihood (ML) methods with IQ-TREE version 1.6 [35]. The reliability of these trees was assessed using the ultrafast bootstrap method with 1000 replications (UFBoot; [36]). Bayesian inference (BI) analyses were conducted using MrBayes version 3.2 [37]. We selected the best substitution model for each gene region under the Bayesian information criterion (BIC) using MEGAX software [34]. The selection of specific models was based on their ability to best accommodate the nucleotide substitution patterns observed in each dataset. Specifically, GTR + G + I was chosen for Cytb due to its complex evolutionary patterns, T92 + G for 12S rRNA and IRBP gene regions as they fit simpler substitution models, and K2 + G + I for 16S rRNA to account for both transitions and transversions with rate heterogeneity and invariant sites. In addition to the individual gene analyses, a concatenated phylogenetic analysis was performed using the combined mtDNA sequences (Cytb, 12S rRNA, and 16S rRNA) for specimens with overlapping data. This concatenated dataset was analyzed using the same ML and BI methods to assess the overall phylogenetic relationships among Scarturus species with greater resolution.
Genetic differentiation between and within species was quantified using the Kimura two-parameter (K2P) model in MEGAX, chosen for its effectiveness in handling interspecific divergences. Number of haplotypes (h), haplotype diversity (Hd) and nucleotide diversities (Pi), and parsimony informative sites (I) within each species were analyzed using DnaSP version 6 [38]. Relationships among haplotypes were visualized through median-joining networks constructed using Network version 10.2 [39], enabling a detailed exploration of the genetic structure within and between species.
3. Results
3.1. Genetic Structure of Scarturus Species in Türkiye
In this study, we analyzed the genetic structure of Scarturus species in Turkish populations using four gene regions: Cytb (921 bp), 12S rRNA (429 bp), 16S rRNA (193 bp), and IRBP (510 bp; Table S3). The results, including the number of variable sites, parsimony informative sites, Hd, and nucleotide diversity (Pi%) for each gene region, are summarized in Table S3. Additionally, detailed information such as GenBank accession numbers, localities, and museum numbers for all samples analyzed is provided in Table S1.
| Species | Genes | ||||||||
|---|---|---|---|---|---|---|---|---|---|
| Cytb | 12S rRNA | 16S rRNA | IRBP | ||||||
| K2P (%) | St. Dev. | K2P (%) | St. Dev. | K2P (%) | St. Dev. | K2P (%) | St. Dev. | ||
| Scarturus williamsi | Scarturus aulacotis | 15.0 | 1.2 | 5.39 | 1.1 | 1.12 | 0.7 | 0.8 | 0.2 |
| Scarturus williamsi | “elater” group | 14.8 | 1.1 | 7.75 | 1.4 | 3.75 | 1.4 | 1.4 | 0.4 |
| Scarturus aulacotis | “elater” group | 16.9 | 1.2 | 8.4 | 1.4 | 3.1 | 1.3 | 1.2 | 0.2 |
For S. williamsi, we examined 53 specimens, identifying 157 variable sites in the Cytb region, with 151 being parsimony informative. The Hd and nucleotide diversity (Pi%) for Cytb were 1.00 and 2.6, respectively. In S. aulacotis (N = 13), we found 165 variable sites in Cytb, with 159 being parsimony informative, yielding Hd of 1.00 and Pi% of 5.1. Analysis of S. elater sequences (N = 21) revealed 220 variations in Cytb, with 202 being parsimony informative, and Hd of 0.92 and Pi% of 8.0.
Analysis of the 12S rRNA gene region in S. williamsi (N = 42) revealed 16 variable sites, all of which were parsimony informative, with Hd of 0.84 and Pi% of 0.5. In S. aulacotis (N = 8), we observed one variable site in the 12S rRNA region, with Hd of 0.42 and Pi% of 0.1. For S. elater (N = 5), there were two mutations in the 12S rRNA region, both parsimony informative, resulting in Hd of 0.7 and Pi% of 0.2.
In the 16S rRNA region (193 bp), S. williamsi showed only two parsimony informative sites, with Hd of 0.13 and Pi% of 0.1. For S. aulacotis, this gene region revealed only one noninformative mutation, resulting in both haplotype and nucleotide diversity of zero. No mutations were found in the 16S rRNA gene region of the S. elater population in Türkiye.
For the IRBP gene region (510 bp), S. williamsi had 19 mutation sites, all parsimony informative, with Hd of 0.72 and Pi% of 0.3. In S. aulacotis, we identified seven informative mutations, resulting in Hd of 0.84 and Pi% of 0.3. Analysis of the IRBP gene region from S. elater revealed 17 informative variations, with Hd of 0.88 and Pi% of 0.8.
3.2. Molecular Diversity and Phylogenetic Relationships of Scarturus Species
Phylogenetic analysis of mtDNA gene regions (Cytb, 12S rRNA, and 16S rRNA) confirmed the monophyletic nature of S. williamsi and S. aulacotis populations, supported by both ML and BI analyses. The reliability values from UFBoot/BI for these analyses are high for Cytb and 12S rRNA (99/1.00 and 93/1.00, respectively) but lower for 16S rRNA (51/–), indicating variable support across gene regions. Additionally, S. elater was positioned as a sister species to all other Scarturus taxa based on mtDNA analyses (Cytb: 100/1.00, 12S rRNA: 100/1.00, and 16S rRNA: 51/–). However, analyses using the IRBP gene region provided weak support for the monophyletic relationship between S. aulacotis and S. elater (UFBoot: 70 and BI: 0.55), contrasting with the strong support for S. williamsi (UFBoot: 100 and BI: 1.00). This suggests varying levels of phylogenetic signal across different gene regions.
To further refine the phylogenetic relationships, we performed a concatenated analysis of the mtDNA sequences (Cytb, 12S rRNA, and 16S rRNA) for specimens with overlapping data (Figure 2). This combined analysis corroborated the initial findings, confirming the monophyletic status of S. williamsi and S. aulacotis with support values of UFBoot: 89 and BI: 0.89 for both clades. The phylogenetic structure within S. williamsi revealed a notable difference between the Cytb and concatenated trees. In the Cytb tree, sublineages W1–W4 formed a monophyletic group distinct from W5, indicating an early divergence of the Niğde (Kemerhisar) lineage. However, in the concatenated tree, sublineages W1–W3 grouped together as a clade, while W4 and W5 formed a separate monophyletic clade, suggesting a closer genetic relationship between these two sublineages. This discrepancy underscores the complex evolutionary history of S. williamsi and highlights the importance of using multiple gene regions for robust phylogenetic inferences.
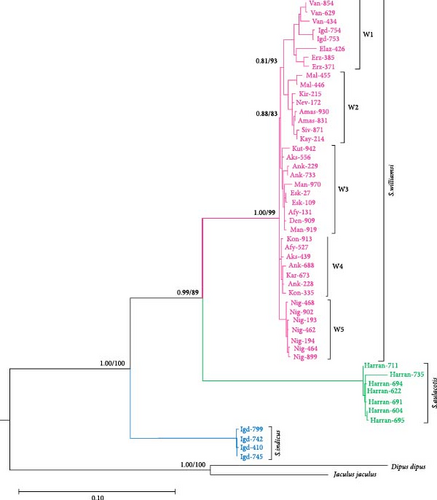
Genetic distance values calculated using the K2P model varied significantly, ranging from 16.9% between S. aulacotis and S. elater for Cytb to as low as 0.8% between S. williamsi and S. aulacotis for IRBP. Within-species genetic distances also showed considerable variation, from 8.7% within S. elater for Cytb to 0% within S. elater and S. aulacotis for 16S rRNA, with detailed values provided in Table 1.
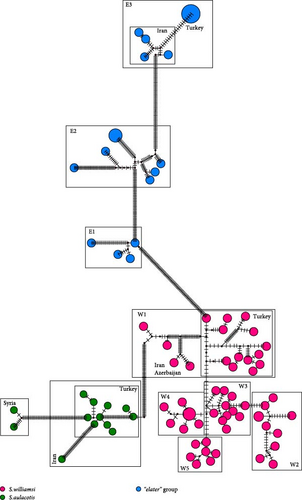
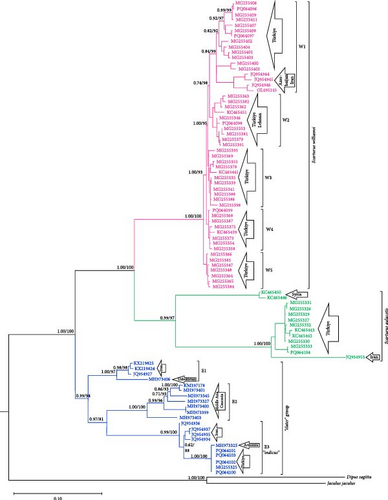
Phylogenetic analysis of Cytb sequences delineated five distinct sublineages (W1–W5) within Scarturus williamsi, highlighting geographic patterns of differentiation (Figure 3). Notably, sublineages W1 and W2 include populations from Eastern Anatolia, comprising subspecies S. w. shmidti and S. w. williamsi, along with specimens from Iran and Azerbaijan. The W2 sublineage is specific to S. w. laticeps from Eastern Anatolia. In contrast, samples from Western Anatolia and specific Central Anatolian samples formed sublineages W3 and W4, respectively, with a unique sublineage W5 emerging from Niğde (Kemerhisar) in the southern margin of Central Anatolian Plateaus.
While 12S rRNA sequences also identified sublineages within S. williamsi, they did not show the same clear clustering as Cytb sequences, indicating a lower phylogenetic resolution for this marker (Figure 4). The 16S rRNA and IRBP gene regions did not support these sublineages, highlighting the importance of selecting appropriate molecular markers for resolving phylogenetic relationships (Figures 5 and 6).
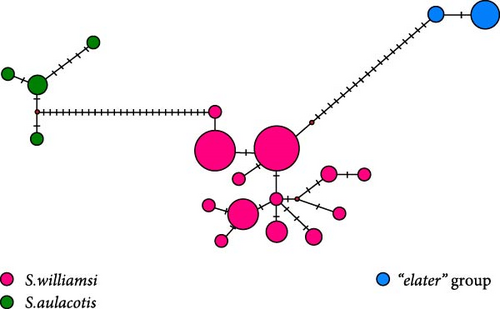
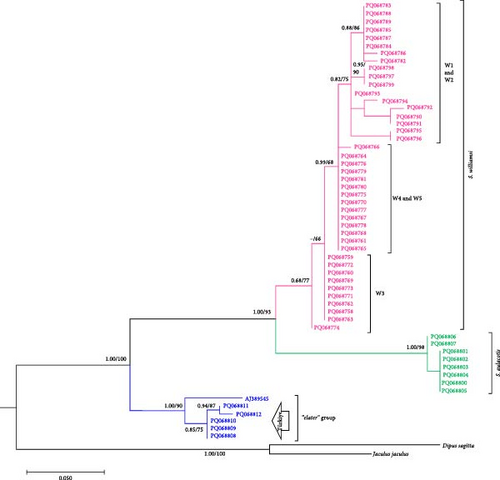
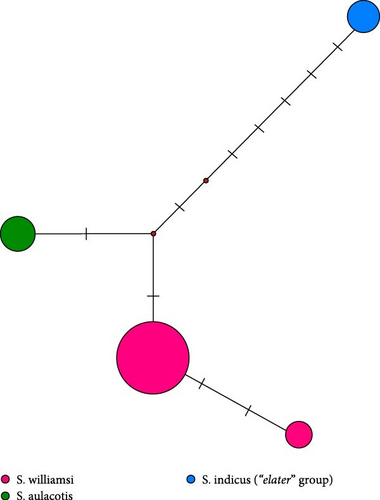

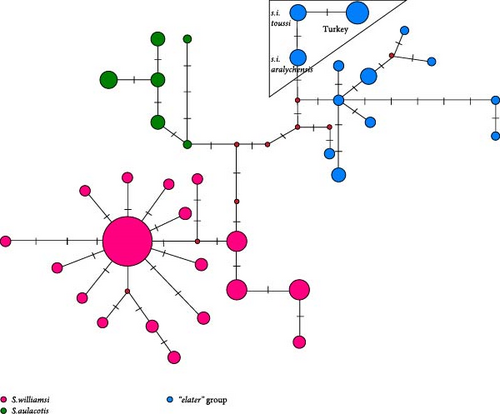
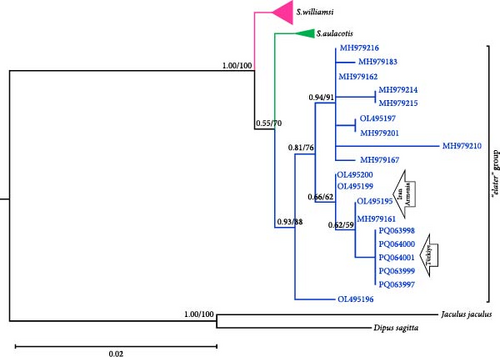
In the phylogenetic trees derived from Cytb sequences, distinct clustering patterns are observed within S. aulacotis and S. elater species (Figure 3). The Syrian (Euph 1) and the Türkiye–Iran (Euph 2) populations of S. aulacotis form distinct sublineages. Furthermore, Turkish and Iranian samples of S. aulacotis remain grouped within the same sublineage, with strong support (BI: 1.00 and UFBoot: 100). Scarturus elater displays three sublineages: the Caspian–Central Asia population (E1 and E2) and the Türkiye–Iran–Armenia population (E3). The clustering of Iranian and Turkish samples shows relatively low reliability (BI: 0.62 and UFBoot: 88) in separate branches. Due to the absence of 12S rRNA and 16S rRNA gene sequences from diverse geographic distributions of S. aulacotis and S. elater, the phylogenetic analyses for these regions were restricted to sequences obtained in this study. Consequently, these analyses did not reveal any differentiation among the samples (Figures 4 and 5). In the phylogenetic trees generated from IRBP sequences, the Turkish population of S. elater aligns closely with Iranian samples (Figure 6).
The median-joining trees for the genus Scarturus revealed haplotype relationships both within and between species that were similar to those observed in the phylogenetic trees. However, the network patterns exhibited by Scarturus species varied depending on the analyzed gene sequences. The Cytb sequences showed the highest number of intra- and interspecific mutations, presenting a complex mutational network pattern (Figure 3). This suggests a high genetic variability within this gene region, possibly reflecting diverse evolutionary histories or strong adaptive differences among populations. Conversely, the IRBP gene sequences manifest a simpler, star-like pattern particularly in S. williamsi (Figure 6), suggesting a more recent common ancestry or lower evolutionary pressures on this gene. Furthermore, the networks derived from 12S rRNA and 16S rRNA sequences were reciprocally monophyletic, that these gene regions are more stable and less variable, making them good markers for clearly distinguishing between species or major lineages (Figure 4).
4. Discussion
4.1. Genetic Differentiation in S. williamsi
Our study confirmed the validity of three species within the specimens of the genus Scarturus distributed across Türkiye and neighboring regions, including Syria, Iran, Georgia, Uzbekistan, and Kazakhstan. Notably, S. williamsi exhibited a complex population structure. Although three subspecies have been recognized based on morphological features [7], their taxonomic statuses and validity could not be confirmed by genetic data [12]. Our findings identified five distinct lineages within the S. williamsi population based on the Cytb phylogenetic tree (Figure 3). However, phylogenetic trees constructed from 12S rRNA, 16S rRNA, and IRBP sequences did not support these lineages, which may be attributed to the higher number of informative sites and greater genetic variability in the Cytb gene region, particularly for closely related taxa [40, 41]. The Cytb gene region has been widely used in numerous studies for its ability to delineate genetic relationships effectively within the family Dipodidae [12, 42–47]. In contrast, nuclear markers have typically been used to differentiate higher taxa within the Dipodidae superfamily [31, 48]. In our analysis, the IRBP gene region clearly differentiated the three Scarturus species. Meanwhile, the resolution of the 16S rRNA was limited due to its shorter sequence length. Additionally, while the 12S rRNA analysis was effective at distinguishing between Scarturus species, it provided insufficient support for intraspecific variations within S. williamsi, unlike the Cytb sequences.
One of these lineages, comprising S. williamsi, is predominantly found in Eastern Anatolia (Figure 1). The highest genetic distance among S. williamsi lineages occurs between W1—which includes specimens previously classified as S. w. shmidti and S. w. williamsi—and the other lineages (W2–W5), with a distance of 3.6% (K2P; Table S4). Although S. w. shmidti and S. w. williamsi were initially recognized as distinct subspecies based on morphological characteristics [7], our phylogenetic analyses show them clustering together. This implies that the East Anatolian lineage of S. williamsi does not constitute a distinct subspecies, indicating a homogeneous genetic structure within the species.
Additionally, the clustering of specimens from northwestern Iran, Azerbaijan, and eastern Türkiye within the same clade suggests that similar habitat preferences across these regions play a significant role in the genetic clustering of these geographically separated populations of S. williamsi. Specifically, S. williamsi thrives in environments with sparse vegetation, which supports their rapid bipedal movement and provides easy access to burrows, facilitating efficient movement and adequate food access [17, 46, 49, 50].
Phylogenetic analysis of Cytb sequences revealed that the S. williamsi specimens from Niğde (Kemerhisar) form a distinct group (W5). This group is genetically distinct, clustering separately from other S. williamsi lineages in eastern, central, and western Anatolia, with a notable genetic distance (K2P = 2.6%). The basal position of W5 in the phylogenetic tree suggests an early divergence from the other lineages. Moreover, the monophyly of both the W5 lineage and other lineages indicates a common evolutionary origin for each group, emphasizing the uniqueness of the Niğde (Kemerhisar) lineage within the phylogenetic framework of S. williamsi. The arid terrain of Niğde (Kemerhisar), along with its potentially unique environmental conditions, may have acted as a refugium, preserving an ancient genetic lineage of S. williamsi. Despite its phylogenetic distinction and early divergence, the Niğde (Kemerhisar) population exhibits lower nucleotide diversity (Pi = 0.25%) compared to other lineages (W1: 2.92%, W2: 1.43%, W3: 0.77%, and W4: 0.45%). Furthermore, the concatenated analysis of mtDNA sequences reinforced the distinctiveness of the Niğde (Kemerhisar) lineage, with W4 and W5 forming a monophyletic group that is separate from the remaining S. williamsi lineages (W1–W3). Our phylogenetic analysis reveals that the distinct clade of S. williamsi from Niğde (Kemerhisar) is likely influenced by the Pleistocene lakes previously described by Altın, Ouahabi, and Fagel [51]. These lakes formed isolated refugia that promoted genetic differentiation by limiting gene flow and amplifying genetic drift among local populations. Additionally, the ongoing salinization, driven by rising temperatures in this region, may impose further ecological stress influencing the current genetic structure of the S. williamsi populations. Together, these historical and ongoing environmental pressures offer a plausible explanation for the early divergence and unique genetic identity of the Niğde (Kemerhisar) clade within our phylogenetic framework.
4.2. Distinction Between S. williamsi and S. aulacotis
Formerly, S. williamsi was defined as a subspecies of S. euphraticus [8, 15, 52]. Çolak, Kivanc, and Yigit [9] reported that S. williamsi and S. euphraticus are two distinct species based on the morphological data. This was also corroborated by Kryštufek et al. [12] using mtDNA sequence data from Turkish specimens of these two species. In this study, we used haplotypes from Turkish, Syrian, and Iranian S. aulacotis (previously known as S. euphraticus) and compared them with S. williamsi specimens from Türkiye. The phylogenetic trees (Figures 3–5) clearly demonstrate the monophyly of both S. aulacotis and S. williamsi, as well as their distinctiveness, confirming the species status proposed by Çolak, Kivanc, and Yigit [9] and validated by Kryštufek et al. [12]. Furthermore, the K2P distance values from Cytb (15.0%) and 12S rRNA (5.39%) sequences between these species strongly suggest speciation [53] (Table 1). Due to low evolutionary rates, the IRBP sequences show lower genetic differentiation (K2P = 0.8%), indicating closer relatedness between S. williamsi and S. aulacotis than either is to S. elater. Similarly, 16S rRNA sequences also supported lower genetic differentiation between S. williamsi and S. aulacotis (K2P = 1.12%) compared to that between S. williamsi and S. elater (K2P = 3.75%).
4.3. Genetic Differentiation in S. aulacotis
The intraspecific variation observed in the Cytb sequences of S. aulacotis (K2P = 5.6% and Pi = 5.1%) suggests distinct lineages within this taxon, possibly indicating cryptic subspeciation. This variation aligns with findings from Çolak and Yiğit [10], who identified distinct morphological traits in specimens from Urfa, Syria, and Jordan, previously referred to as A. e. kivanci. However, according to Michaux and Shenbrot [1] and corroborated by nuclear data from Lebedev et al. [3], what was once considered a separate subspecies, A. e. kivanci, is now junior synonym of S. aulacotis. Our analyses have led to the reclassification of what was traditionally identified as S. euphraticus samples from Türkiye and Iran, alongside the Syrian samples, within the taxonomic framework of S. aulocotis. Notably, within S. aulacotis, we have identified significant genetic divergence between the Syrian samples and the Türkiye–Iran samples, with a genetic distance of 13.8% (K2P; Table S4). This substantial divergence underscores the complexity within S. aulocotis and supports the existence of distinct evolutionary lineages within the species.
4.4. Taxonomic Implications of Scarturus elater
Historical taxonomic discussions on S. elater have varied, with Ellerman [11] and Ellerman and Morrison-Scott [14] suggesting synonymy between the sublineages aralychensis and indica, while Corbet [15] associated the sublineage aralychensis with caucasicus. However, Çolak, Kıvanç, and Yiğit [16] confirmed the distinct presence of S. e. aralychensis in Türkiye. Furthermore, recent studies have proposed that specimens from Tehran represent distinct taxa, with Moshtaghi et al. [54] identifying S. toussi in Tehran, while Shenbrot [55] classified these specimens as S. elater turkmeni. Dianat et al. [56] further supported the distinct clade formation separate from S. toussi, highlighting the complex taxonomic structure within S. elater. Most recently, Bannikova et al. [13] and Lebedev et al. [3] have demonstrated that the samples from Iran and Armenia belong to the S. indicus superspecies, identifying them as S. indicus aralychensis.
Our phylogenetic analysis of the “elater” species complex, based on Cytb data, reveals significant genetic diversity, delineating the species into three distinct groups (Figure 3). The first group (E3) included the specimens from Aralık (Türkiye), Tehran (Iran), and Armenia. The second group (E2), consisting of specimens from South Khorasan (Iran) and Central Asia, forms a monophyletic group with E3, suggesting a recent common ancestry. The third group (E1) includes specimens from Uzbekistan, Torbat-Jam (Iran), and Golestan (Iran), indicating a distinct population within the S. elater species complex. The genetic divergence values between these groups, with K2P ranging from 11% to 12% (Table S4), suggest that these could represent different species rather than subspecies. Additionally, IRBP sequence analysis supports the formation of three subclades, albeit with low confidence; notably, the Turkish population clusters with Iranian and Armenian specimens (Figure 6). Given the significant genetic divergence observed, our findings strongly suggest that the Turkish population belongs to S. i. aralychensis.
Conflicts of Interest
The authors declare no conflicts of interest.
Funding
This study was funded by Türkiye Bilimsel ve Teknolojik Araştırma Kurumu (The Scientific and Technological Research Council of Türkiye; TÜBİTAK), grant number 114Z941.
Acknowledgments
We would like to express our gratitude to Dr. Taciser Bakirci for her assistance with the map adjustments. This study was supported by Türkiye Bilimsel ve Teknolojik Araştırma Kurumu (The Scientific and Technological Research Council of Türkiye; TÜBİTAK), Grant number 114Z941.
Supporting Information
Additional supporting information can be found online in the Supporting Information section.
Open Research
Data Availability Statement
The NCBI GenBank accession numbers of the sequences used to support the findings of this study are included within the article (Table S1). The sequences will remain restricted until the manuscript is published.


