Analysis of Colorfastness in Metallic Prints Using Absorption Spectroscopy
Abstract
Color is essential for the fashion and art of fabrics, with its retention being a quality measure of great significance for the brand and user. The colorfastness of some metallic fabrics has been established using absorption spectroscopy, by determining the quality and quantity of dye that bled after undergoing wash laundry processes. Two metallic fabrics (X and Y) and washing detergents (liquid and powdered) were used. The fabrics were washed using GyroWash machine set for normal (40°C) and hot (60°C) wash for durations of 60 min and 90 min. There was a repeat for a second wash. The wastewater after each wash (sample) was collected, and the absorption spectra were recorded using a double-beam spectrophotometer. The quality of dyes drained was determined using Peakfit analysis to deconvolute the absorption spectrum to reveal the presence of multiple individual wavelengths, and quantified using their relative intensity values. The identified peaks were between 200 nm and 370 nm, which lie within the UV–Vis absorption band of synthetic dyes referred to as azo dyes. The liquid soap bled more dye under the same washing conditions, with fabric Y demonstrating an inferior ability to retain its dye compared to fabric X. A higher amount of dye was drained during the hot wash, with the amount of dye that bled from both fabrics reducing after the first wash. Euclidean similarity was performed using principal component analysis to identify the spectra close to the detergent solution (reference spectrum) in Euclidean distance sense. Points from the wastewater spectra similar to the reference had shorter absolute distances, indicating less bleeding, while more dissimilar points registered longer distance, indicating more bleeding. This absorption spectroscopy technique is scientific and objective compared to the conventional subjective gray scale method. It will help textile manufacturers develop standardized testing protocols to assess the colorfastness of metallic printed fabrics, ensuring that products meet quality standards before they reach the market.
1. Introduction
Printed fabrics and textiles are important and used in our everyday endeavors for various purposes. Joseph [1] posits that textiles are used to make clothes, which is one of man’s three essential needs aside food and shelter. Though clothing is typically prioritized second to food, it is however argued that while one can go unnoticed without food or shelter, one’s behavior would instantly be considered unacceptable without clothing in public. In Ghana, cotton prints and textiles used are imported or manufactured locally, with those locally produced being comparable in terms of quality and design to those imported.
To maintain a fabric, one needs to launder to get rid of stains and dirt. Laundry is a means of wetting fabric in water with additives, agitating and rinsing. The additive helps lift the dirt off the fabric, retains it in the water, and prevents re-depositing on the fabric until it can be rinsed away [1]. Laundering is necessary for hygiene and appearance, but also inevitably causes wear and tear that affects the strength and esthetic appeal of the clothing. The durability of color on fabrics is an important factor. Consumers believe it is the most important factor when purchasing textile products, and its loss during use and maintenance often results in dissatisfaction and premature discard [2].
Water alone has little cleansing power, and therefore the need for a detergent to boost its wetting and suspending power. Washing can be done by hand or with a machine for varied durations of time. Temperature also plays a role, with fibers seemingly not adequately cleansed with the use of low-wash temperatures and cold rinses [3, 4]. This does not mean that cold water is inappropriate for laundering. Augustin et al. [5] recommend cold water for dark or bright colors that may run or fade, while white fabrics, dirty or greasy clothes, and sturdy colorfast fabrics that retain their dye may be washed using hot water. Generally, elevated temperature during laundering additionally reduces the number of microbes by easing their physical elimination [6].
Colorfastness generally describes a fabric’s color endurance to fading, running, or bleeding as a result of its exposure to an activity such as a laundry process. It is related to the force fixing the photochromic dye to the material [7]. Light fastness and wash fastness are the main forms of colorfastness that are categorized. Light fastness of fabric dye describes its resistance to fading when exposed to light [8] and categorized from one to eight, with a higher number signifying better fastness [9]. Wash fastness relates to the capacity of a fabric to maintain its initial color and appearance after undergoing a wash laundering process. It is categorized from one to five using the gray scale, with a higher number indicating better fastness [9, 10]. The precise use of the gray scale is imperative for the accurate determination of the magnitude of color change after a wash laundry. To reduce operator bias in its use, the viewing angle, quality and intensity of radiation used to view the samples, and the gray scales are detailed in a standard operating procedure [11]. This makes the operation of the gray scale cumbersome and its results very subjective.
Several studies have explored the impact of various treatments, pigments, and printing techniques on the colorfastness of printed cotton fabrics. One such study demonstrated that the use of ethylene glycol diglycidyl ether (EGDE) as a crosslinking agent, in combination with mordants, enhanced the color depth and sharpness of printed cotton fabrics, ultimately improving colorfastness [12]. Another investigation focused on chitosan, finding that it not only served as mordant but also conferred antibacterial properties and improved the overall durability of the fabric, while simultaneously enhancing its colorfastness and eco-friendliness [13]. In addition to mordants, the choice of printing technique significantly influences colorfastness. A study examining the effects of chitosan post-treatment on the fixation of pigment-based inks for inkjet-printed cotton fabrics revealed that acidic pH conditions during the post-treatment process resulted in higher fixation values and enhanced colorfastness [14]. Similarly, the application of water-soluble cationic chitosan derivatives was found to improve pigment ink fixation, leading to better crocking and laundering fastness compared to untreated fabrics [15]. Electron beam irradiation of cotton fabrics printed with pigment colors has also been reported to result in greater color strength and superior fastness properties compared to conventional printing methods [16]. Additionally, cationic pretreatment has been shown to enhance the printability of cotton fabrics with anionic dyes and pigments, yielding improved fastness properties [17].
However, previous studies on fabric colorfastness often relied on subjective methods, which are prone to bias. Zhao and colleagues [18] studied the dyeing properties and colorfastness of cellulose-treated fabrics and later investigated the effects of UV absorbers and reducing agents on the light fastness of cotton fabrics [19]. In these studies, colorfastness to washing was assessed using the American Association of Textile Chemists and Colorists (AATCC) test method, which is subjective, as it depends on the accurate interpretation of a color-change scale. Another study assessed the colorfastness of dyed cotton fabrics using a laboratory Launder-o-meter according to the IS: 3361-1979 washing method. Loss of color depth and fabric staining were evaluated using the ISO-105-A02 gray scale for color depth loss and ISO-105-A03 staining scale for wash fastness grading [20]. This method is also subjective and can produce inconsistent and unreliable results.
Absorption spectroscopy, a nondestructive and rapid analytical technique, offers high precision in chemical analysis due to its specificity and quantitative capabilities [21]. The accuracy of absorption spectra enables the discrimination of compounds within mixtures, making it applicable across a broad range of fields. It provides insights into the types and structures of molecules in a sample and has been employed for classification and identification in various studies, including the discrimination of tequila [22], the characterization of polyaniline [23], and the analysis of dissolved organic matter [24]. This method’s specificity allows for the identification of unknown samples by matching their spectra with reference archives.
In this work, we investigate the potential benefits of absorption spectroscopy, an objective and scientifically grounded method, for evaluating the colorfastness of metallic prints subjected to laundry processes under different washing conditions. This study focused on wash laundry processes using two detergents (liquid and powdered soaps) at normal (40°C) and hot (60°C) wash temperatures for different durations of time. This was conducted on metallic prints from two textile manufacturing companies in Ghana. The information on the performance of the metallic prints regarding their colorfastness to laundering will be used in developing care labels which will ultimately help consumers make informed decisions concerning the selection, use, and care for their metallic prints. It will help formulate washing procedures that will have the least damage on their fabrics.
2. Materials and Method
2.1. Fabrics and Detergents
Metallic printed cotton fabrics from two textile manufacturing companies in Ghana were used. For anonymity, they were relabeled X and Y from manufacturing companies 1 and 2, respectively. Eight cotton fabrics each measuring 5 cm × 15 cm each were selected, with four from each textile manufacturing company, thus four of the same fabric from company 1 (X), and four of the same fabric from company 2 (Y). These cotton fabrics had the same metallic dyestuffs and color used to print on them. A purposive sampling method was used in picking the fabrics and detergents. The detergents (liquid soap and powdered soap) were also produced in Ghana, with their names similarly not mentioned to keep them anonymous.
2.2. Operation of Gyro Washing Fastness Tester
Wash fastness testing was carried out following the ISO 105-C06:2010 method for assessing colorfastness to washing, using the GyroWash fastness testing machine. The GyroWash 1615/20 model, located at the Textile and Leather Laboratory of the Ghana Standards Authority (TLL-GSA), was employed for this study. This machine is specifically designed to evaluate the wash fastness of textiles by assessing how resistant dyes are to fading or bleeding under various washing conditions. It simulates the washing process in a controlled environment, enabling a standardized evaluation of fabric durability.
Several key factors influence the results of wash fastness tests, including water temperature, detergent type and concentration, and the duration of the wash cycle. For example, the stability of dyes can be significantly affected by water temperature; higher temperatures often lead to increased dye migration, resulting in lower fastness ratings. Likewise, detergent concentration can modify the chemical interactions between the dye and the fabric, which can impact the overall wash fastness.
The GyroWash machine enhances control over these key variables through the use of advanced control systems, such as fuzzy logic controllers. These systems automatically adjust parameters like water level, flow intensity, and washing time based on real-time feedback, optimizing both performance and energy efficiency during the washing process. The operation of the GyroWash fastness tester is thus a complex interaction of various factors, including precise control of washing conditions and the integration of sophisticated control systems. By carefully managing these critical variables, accurate and reliable data on the wash fastness of the tested fabrics were obtained.
2.3. Washing of Fabrics
Each detergent solution, both liquid and powder, was prepared by dissolving 5 g of detergent in 1 L of water. Beginning with Wash Condition 1, as outlined in Table 1, the GyroWash was filled with 150 mL of the liquid detergent solution and preheated to 40°C for the initial wash. Fabric samples X and Y (5 cm × 15 cm) were placed in two separate vessels and fitted securely in the GyroWash by twisting clockwise in the bayonet slot. Once the lid was closed, the timer was set for 60 min, and the wash cycle was initiated. After completion, the fabrics were removed and the wastewater was collected for later analysis. The fabrics were then rinsed in warm and cold water, dried at room temperature, and subjected to a second wash under the same conditions.
| Condition | Temp (°C) | Time (min) | Wash |
|---|---|---|---|
| 1 | 40 | 60 | 1st |
| 40 | 60 | 2nd | |
| 2 | 40 | 90 | 1st |
| 40 | 90 | 2nd | |
| 3 | 60 | 60 | 1st |
| 60 | 60 | 2nd | |
| 4 | 60 | 90 | 1st |
| 60 | 90 | 2nd | |
This process was repeated for the remaining fabric samples X and Y, following the wash conditions specified in Table 1. The same procedure was then performed using the powder detergent solution. Table 1 provides an overview of the washing conditions: Wash Condition 1 consisted of a 40°C wash for 60 min; Wash Condition 2, 40°C wash for 90 min; Wash Condition 3, 60°C wash for 60 min; and Wash Condition 4, 60°C wash for 90 min. The washing was conducted at either 40°C or 60°C, representing normal- and hot-wash settings. After each wash cycle, the wastewater was collected for subsequent analysis.
2.4. Instrumentation
2.4.1. Absorbance Measurement
This measured the results of the interaction between the electromagnetic radiation and the absorbing species (in this case the drained dyes) in the sample. The higher the quantity of dye, the greater will be the absorption. The absorbance measurement determined both the quality and quantity of dye drained after each wash. The quality was established by determining the presence of unique individual wavelengths in the sample, and the quantity was determined from their relative intensity values.
The absorbance was determined using a double-beam UV–Vis spectrophotometer, type UV 6300 PC. It uses a tungsten/deuterium lamp with a wavelength range of 190 nm–1100 nm.
2.5. Measurements
2.5.1. Spectra of Detergent Solutions—Reference Spectra
Two quartz cuvettes were rinsed with water used to launder the fabrics and air-dried. The spectrum of the detergent solution was determined by filling one cuvette with water used to wash the fabrics and positioned in the reference sample holder, whilst the other cuvette was positioned in the analyte sample holder and filled with the detergent solution. The spectra of the detergents were then recorded and registered as reference spectra.
2.5.2. Spectra of Samples—Wastewater After Wash
The reference sample holder was filled with one of the detergent solutions, whilst the analyte sample holder was filled with the wastewater collected after each wash. After each measurement, the analyte sample cuvette was thoroughly rinsed with the water used to wash, and filled with the sample that followed sequentially using the various washing conditions described in Table 1. This procedure was then repeated for the other detergent solution.
All absorbance scans were performed in triplicates, and spectral data were recorded. The spectrum of the detergent solution (reference) was always automatically deducted from the spectrum of the wastewater, resulting in only the spectrum of the dye drained being recorded.
2.6. Spectra Processing Technique
The absorption spectra of the wastewater were deconvoluted to uncover hidden peaks within the spectra. This procedure authenticated the quality of dyes drained by revealing the individual wavelengths present.
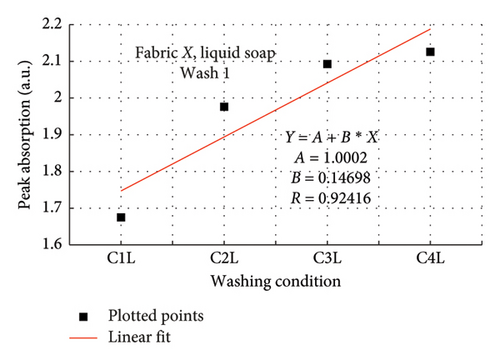
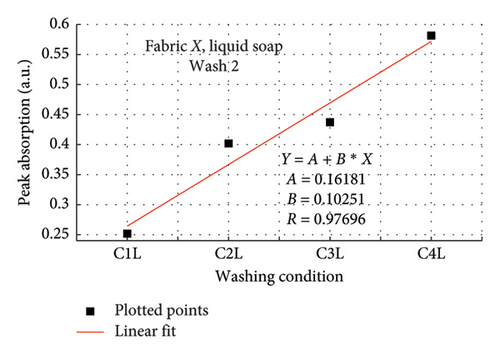
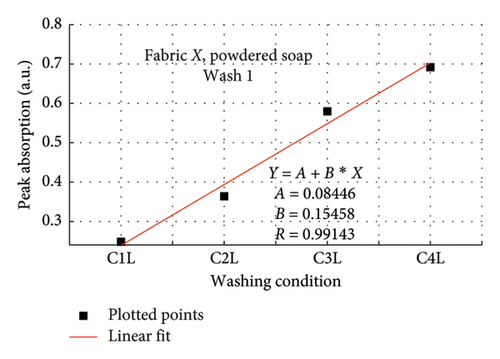
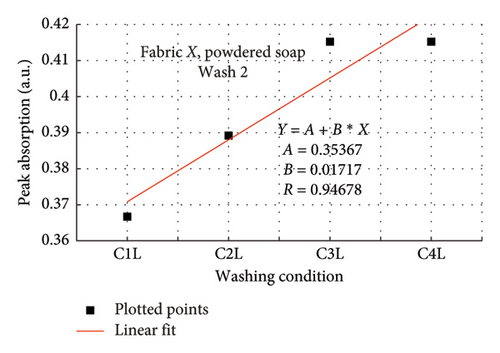
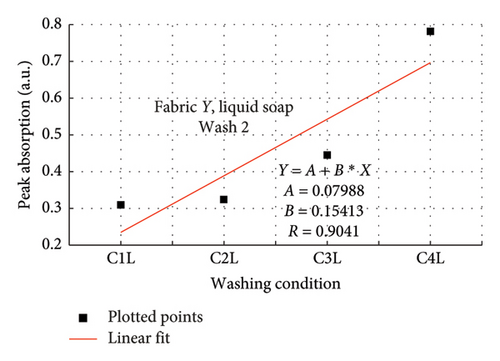
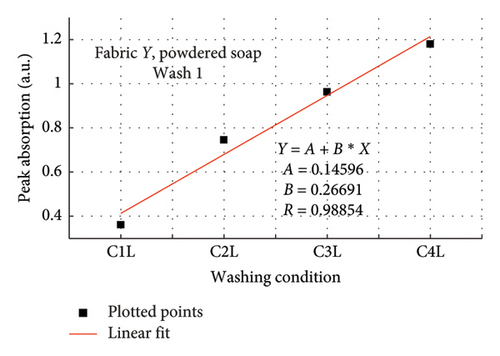
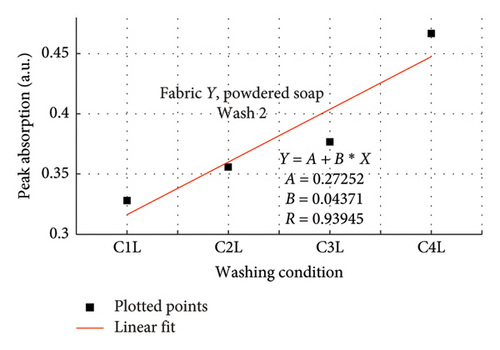
The relative intensity values determined the quantity of dyes drained and increased as the temperature and time of wash increased serially from wash conditions 1 to 4 (Table 1). The rates of increase, which indicates the rate at which dyes were drained, were determined by plotting a graph of the peak absorption values against wash condition and calculating the slope. A high slope value signified a high rate at which dye was drained for a fabric, and vice versa.
2.7. Principal Component Analysis (PCA)
PCA is a statistical reduction technique used to reduce the dimensionality of large datasets, making them more easily visualized and analyzed, while at the same time maintaining as much information as possible. It constructs principal components (PCs) with similar samples being grouped closer to each other and vice versa. PC1 is the eigenvector and the dominant PC representing most of the information variance, and impacts more out of the total variability. PC2, PC3, PC4, and PC5 represent lesser variance in that decreasing order [28].
2.8. Euclidean Distance Analysis
This is the distance between two points in geometric space as measured by Pythagoras’ theorem. It can be converted to Euclidean similarity to identify parameters that are close to each other in a Euclidean distance sense [29, 30]. Points that are more similar will have a shorter absolute distance between them, while more dissimilar points will have a longer distance. Numerically, Euclidean distance has a value always greater than or equal to zero. It will be zero for identical points and high for points that show little or no similarity. In this study, Euclidean similarity was used to identify spectra close to the detergent solution (reference spectrum) in Euclidean distance sense.
3. Results and Discussion
3.1. Absorption Spectra
The absorption spectra of fabric X when washed with the liquid soap and powdered soap for the various wash conditions are shown in Figure 1. The top graphs (a) and (b) are for the liquid soap, first and second washes (Wash 1 and Wash 2), while the bottom graphs (c) and (d) are for the powdered soap, first and second washes (Wash 1 and Wash 2). These are plotted for wash conditions 1–4. The graphs for fabric Y are shown in Figure 2. The top graphs (a) and (b) are for the liquid soap, first and second washes (Wash 1 and Wash 2), and the bottom graphs (c) and (d) are for powdered soap, first and second washes (Wash 1 and Wash 2).
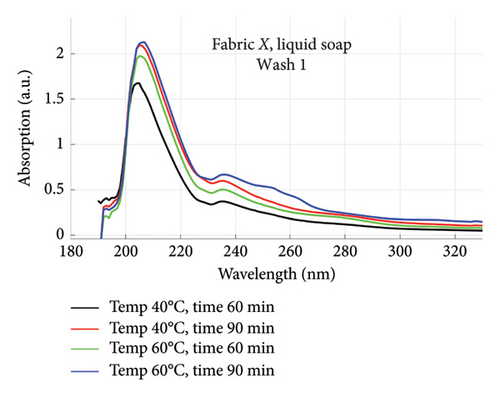
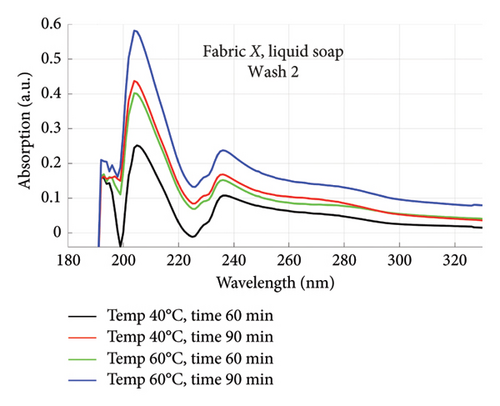
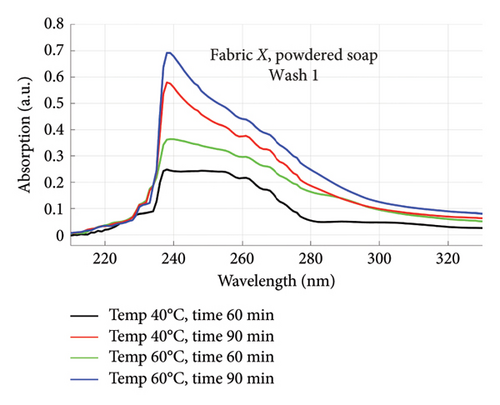
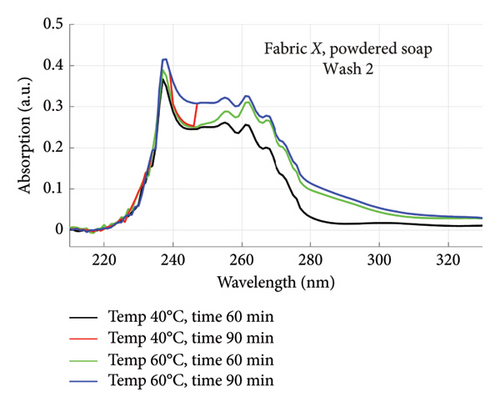
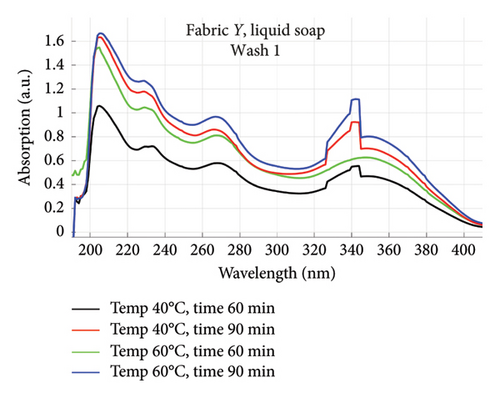
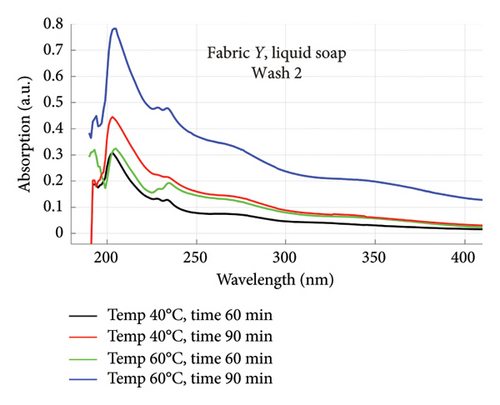
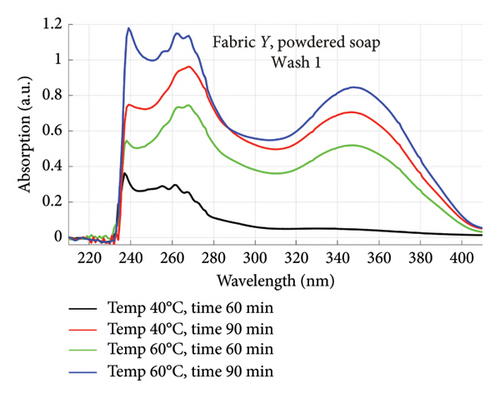
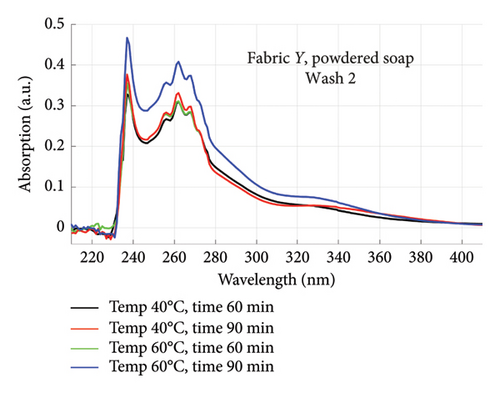
The relative intensities of the absorption spectrum are characteristic of the quantity of dyes that bled after each wash. It will be observed that the absorption values decreased in Wash 2, indicating a reduction in the amount of dye drained during the second wash. For both fabrics, absorption values were relatively higher for the liquid soap compared to the powdered soap, for both Wash 1 and Wash 2. This indicates that the liquid soap comparatively drained more dye under the same washing conditions. Apart from the spectra for Wash 1 of fabric X washed with liquid soap, values recorded for fabric Y were comparatively higher than that of fabric X for the remaining spectra. This means that fabric Y comparatively drained more dye, and therefore exhibited an inferior ability to retain its dye under the same washing conditions [7].
3.2. Rate at Which Dye Was Drained
From Figures 1 and 2, absorption values for both Wash 1 and Wash 2 increased as the wash conditions were changed from 1 to 4 (Table 1). This indicates an increase in the quantity of dye drained, and can be attributed to a reduction in the binding force between the dye and the fiber of the fabric, leading to a reduction in the fabric’s resistance to fading or running [7].
The rate of increase in absorption, which indicates the rate at which the dye bled, was determined by plotting the peak absorption values for 4 wash conditions and calculating the slope. Figure 3 is a composite graph for fabric X when washed with liquid soap for Wash 1 (a) and 2 (b); and for powdered soap Wash 1 (c) and Wash 2 (d). Figure 4 is that for fabric Y. On the horizontal axis, C1–C4 represents wash conditions 1 to 4. The slopes of the linear fitted points, presented in Table 2, give the rate of increase in absorption, and therefore the rate at which dye was drained from the fabrics.

| Soap | Fabric X | Fabric Y | ||
|---|---|---|---|---|
| Wash 1 | Wash 2 | Wash 1 | Wash 2 | |
| Liquid soap | 0.15 | 0.10 | 0.19 | 0.15 |
| Powdered soap | 0.15 | 0.02 | 0.27 | 0.04 |
For Wash 1 and Wash 2 of both detergents, the slopes for fabric Y were higher than fabric X. This indicates that fabric Y drained out dye at a faster rate, under the same wash conditions, compared to fabric X. This corroborates the previous findings under the absorption study, which established that fabric Y drained more dye under the same washing conditions, thereby exhibiting an inferior ability in retaining its dye under the same washing conditions.
3.3. Percentage of Dye Drained After Wash 1 and Wash 2
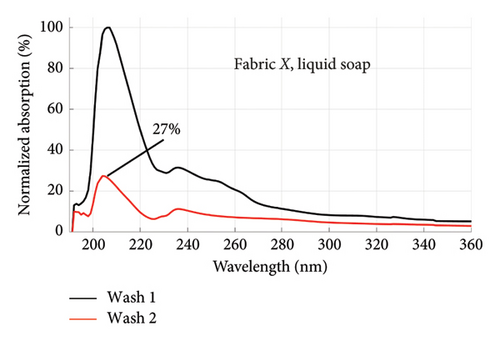
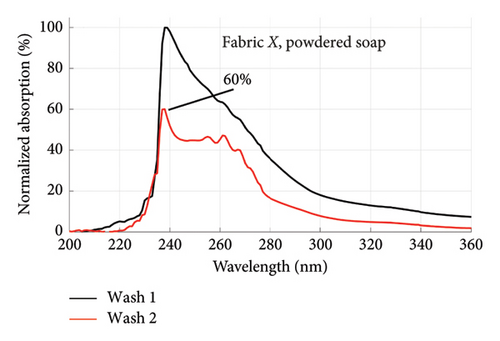
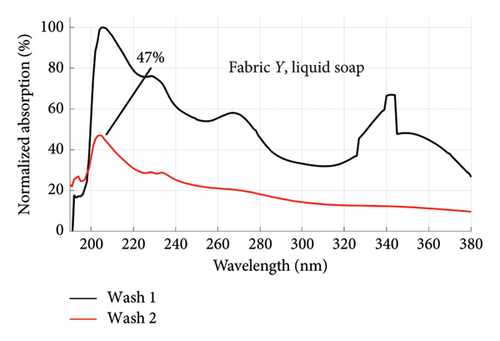
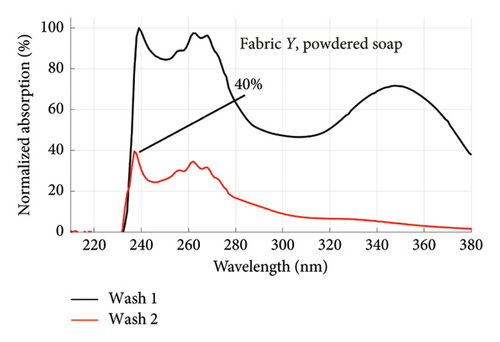
From Figures 1 and 2, the absorption values measured for both fabrics were always higher in Wash 1 compared to Wash 2, implying a reduction in the amount of dye drained after the first wash. To determine the percentage in reduction, data for wash condition 4 was normalized using the highest value in the first wash and expressed as a percentage. Figure 5 is a composite graph showing the percentage reduction for fabric X (liquid and powdered soaps; top graphs (a) and (b), respectively) and fabric Y (liquid and powdered soaps; bottom, bottom graphs (c) and (d), respectively). For fabric X, the amount of dye drained reduced to 27% of the original value for the liquid soap and 60% for the powdered soap, while for fabric Y, the dye drained reduced to 47% for the liquid soap and 40% for the powdered soap. Table 3 shows the peak absorption values and the percentage reduction after Wash 1 and Wash 2.
| Soap | Fabric X | Fabric Y | ||||
|---|---|---|---|---|---|---|
| Wash 1 | Wash 2 | % reduction | Wash 1 | Wash 2 | % reduction | |
| Liquid soap | 2.12602 | 0.58153 | 27 | 1.66557 | 0.78241 | 47 |
| Powdered soap | 0.69172 | 0.41523 | 60 | 1.18027 | 0.46685 | 40 |
From Table 3, the liquid soap indeed drained more dye under the same washing conditions as the peak absorption values for both Wash 1 and Wash 2 were higher for both fabrics. Aside Wash 1 of fabric X washed with the liquid soap, fabric Y exhibited an inferior ability in retaining its dye under the same washing conditions as the peak absorption values recorded were higher than that of fabric X.
3.4. Deconvolution of Absorption Spectra Using Peak Fit Analysis
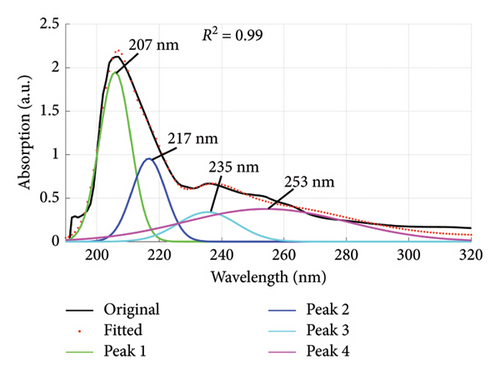
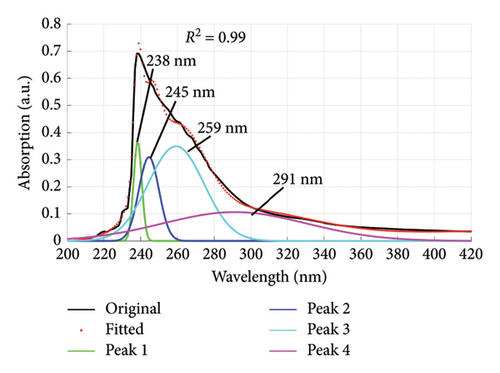
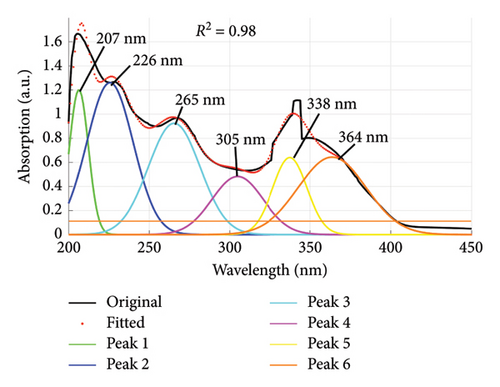
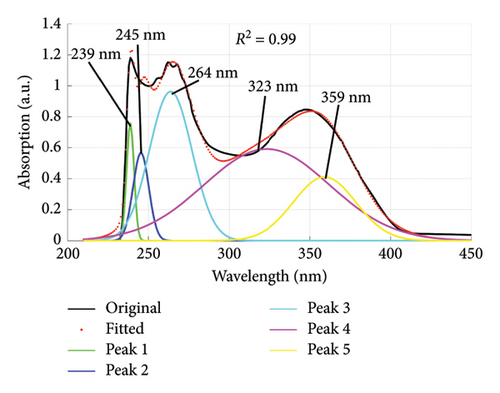
Using the absorption spectra in Figures 1 and 2, the quality of dyes drained were established by determining the individual wavelengths present in the sample (wastewater). This was done by deconvoluting the spectra to reveal the hidden peaks. Figure 6 is a composite graph showing the deconvoluted spectra for fabric X washed with liquid and powdered soaps, (a) and (b), respectively, and fabric Y washed with liquid and powdered soaps, (c) and (d), respectively. The maximum wavelengths at which the revealed peaks occurred are presented in Table 4. These peaks corresponded to a legion of azo compounds that make up 60%–70% of dyes used for various purposes [31–35].
| Fabric | Detergent | Wavelength (nm) |
|---|---|---|
| X | Liquid soap | 207, 217, 235, 253 |
| Powdered soap | 238, 245, 259, 291 | |
| Y | Liquid soap | 207, 226, 265, 305, 338, 364 |
| Powdered soap | 239, 245, 264, 323, 359 | |
3.5. Identification of Dyes Drained
From Table 4, the peak absorption wavelengths of the deconvoluted spectra lie between 200 nm and 370 nm. This is within the absorption band of synthetic dyes commonly referred to as azo dyes. These dyes have their absorption peaks broadly within the UV–Vis spectrum [36] and belong to a group of azo compounds that make up 60%–70% of dyes used in the food, textile, color paper printing, leather and cosmetic industries [32–35]. They are essential due to their versatile applications, and in recent years have been used for optical actuators, photorefractive media and nonlinear optical devices (NLO); and in biological systems used as inhibitors of tumor growth [37]. They are the largest class of dyes [38] and have one or more azo groups (R1–N=N–R2) having aromatic rings mostly substituted by sulfonate groups. These complex aromatic substituted structures are responsible for their intense color, high water solubility, and resistance to degradation under natural conditions [39, 40].
Shifts were observed in the peak absorption maxima of some of the identified dyes. This could be attributed to the photo-physical behavior of the dissolved dyes, which depends on the solvent–solute interactions and their solvent nature [37, 41]. These shifts resulted in marginal disparities in the peaks of up to 4 nm in some of the identified dyes.
Some of the identified dyes are tartrazine (Yellow-GR, Color Index (C. I.), name reactive yellow-15) at 259 nm, and sunset yellow at 238 nm [42, 43] as detected for fabric X washed with powdered soap. Red-5B dye (C. I. name reactive red-35) was identified at 235 nm and 305 nm for fabric X and Y when washed with liquid soap [43]. Orange-3R dye (C. I. name reactive orange-16) identified at 253 nm and 291 nm for fabric X washed with liquid and powdered soaps. Turquoise Blue-G and Blue-3R (C. I. names reactive blue 21 and 28, respectively) identified at 338 nm for fabric Y washed with liquid soap. These peaks can be ascribed to the presence of aryl- and naphthalene-like moieties, which are responsible for UV region’s peaks [44].
3.6. PCA
PCA was used to determine how similar or different the spectra of the wastewater (samples) were from the reference spectrum, which is the spectrum of the detergent solution. What PCA did was to take the spectra data and convert to dots that correctly represented the profile of each spectrum. This made it easier to compare because dots that clustered closer to the reference implied similar characteristics, and therefore suggested less amount of dye drained, and vice versa.
The evaluation was made relative to the reference spectrum, and so the reference spectrum data was added to that of the wastewater to be analyzed.
Secondly, the cumulative amount of dye drained after the second wash was determined and used. This was calculated by summing the data for Wash 1 and Wash 2, which yielded the total of dye drained after the second wash. Figure 7 is a plot for fabric X washed with liquid soap (a) and powdered soap (b). That for fabric Y is presented in Figure 8.
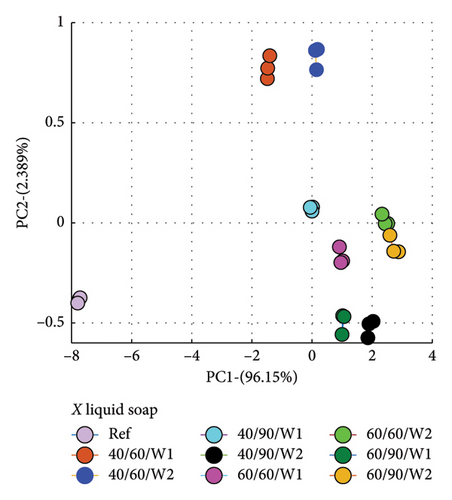
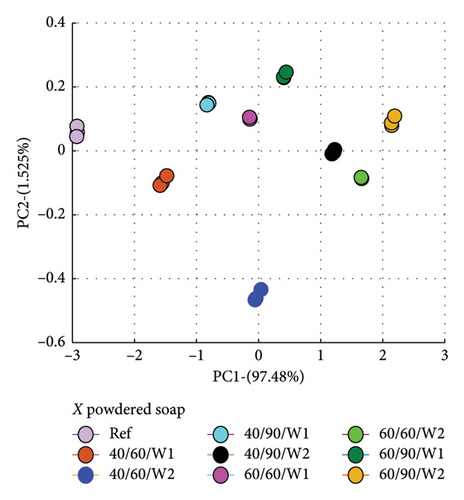
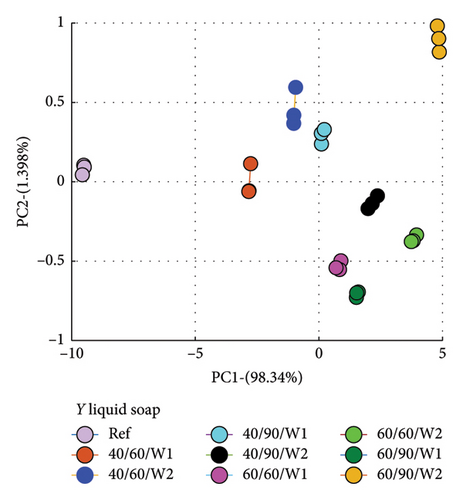
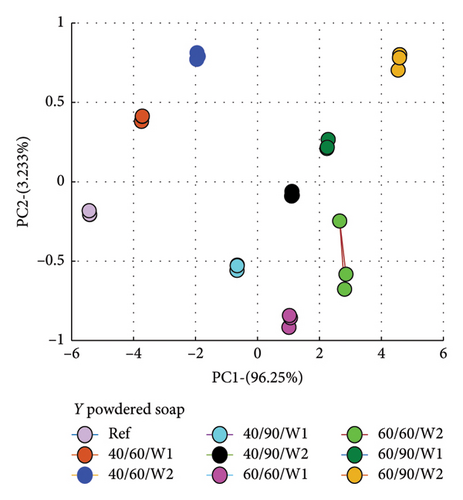
The PCA plots (Figures 7 and 8) made it easier and clearer to determine how similar or different the various spectra were compared to the reference spectra.
3.7. Calculated Euclidean Distances
Euclidean distances were calculated from the PCA plots. Points that are similar will have shorter absolute distances between them, while dissimilar points will have longer distances. The distances of the other spectra (as shown in Figures 7 and 8) from the reference were calculated. A Euclidean distance of 0 was therefore obtained for the reference, indicating no dye was present. Shorter distances implied a similar expression profile, and therefore a lower amount of dye drained, and vice versa.
The Euclidean distances are presented in column plots for fabric X washed with liquid and powdered soaps presented in Figures 9(a) and 9(b), respectively, that for fabric Y is presented in Figures 9(c) and 9(d) for the liquid and powdered soaps, respectively.
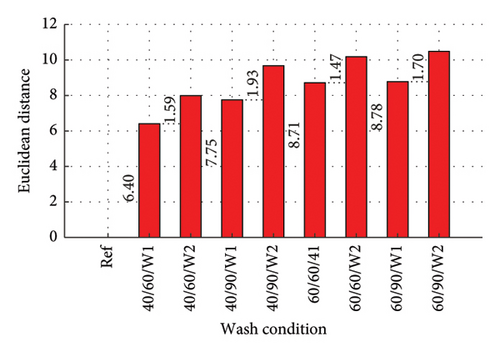
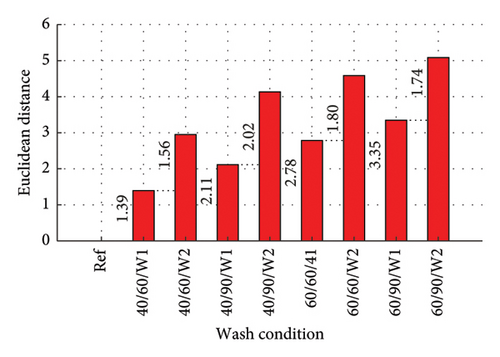
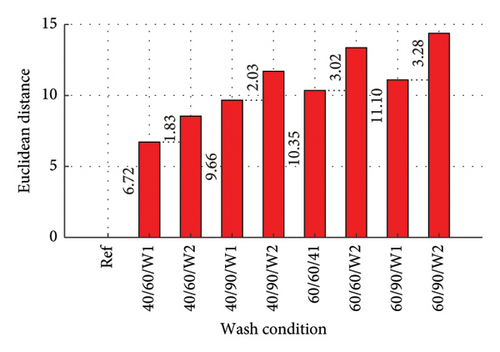
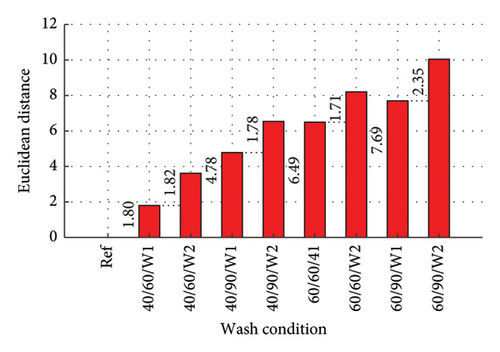
From Figure 9, the Euclidean distances of all first wash was less than that of second wash as the data for the second wash was the cumulative amount of dye drained after the second wash (dye drained in Wash 1 + Wash 2). It should however be pointed out that aside wash condition 1 for both fabrics washed with powdered soap, the amount of dye drained during the second wash alone (not cumulative) was lower compared to the amount drained during the first wash. These values have been calculated and registered on the W2 parts of the column graphs. This finding is collaborated in Figure 5 and Table 3.
The Euclidean distances for both fabrics were higher for the liquid soap compared to the powdered soap. This means that for the liquid soap, the various spectra were more dissimilar compared to the reference spectra, implying that the liquid soap drained more dye under the same wash conditions. This is collaborated in Figures 1 and 2.
For all the column plots, the Euclidean distances increased as the wash condition changed from 1 to 4. Thus, 40/60/W1 < 40/90/W1 < 60/60/W1 < 60/90/W1 and 40/60/W2 < 40/90/W2 < 60/60/W2 < 60/90/W2. This means that for all the fabrics, more dye was drained as the temperature and time of wash was increased. This conforms to the findings presented in Figures 3 and 4, and Table 2.
Fabric Y comparatively registered higher Euclidean distances for both soaps. This means that under the same wash conditions, Fabric Y drained more dye, demonstrating an inferior ability in retaining its dye compared to fabric X. This conforms to the findings presented in Figures 3 and 4, and Table 2.
4. Conclusion
This study has established that varied factors influence the colorfastness of a fabric during laundry. Some of these factors include the type of fabric, detergent, duration of wash, temperature of wash, and the number of times laundry is undertaken. In this study, the liquid soap comparatively drained more dye compared to the powdered soap. For the fabrics, Y exhibited an inferior ability compared to X in retaining its dye under the same washing conditions. This is in spite of the fact that there are no differences in material composition or production processes between them as they were both made from cotton and printed using the same metallic dyestuffs and color. Aside 40/60/W2 for both fabrics washed with powdered soap, the amount of dye drained from the fabrics reduced after the first wash. The temperature of the water affected the colorfastness of the fabrics as a greater amount of the dye drained for both fabrics and detergents when the temperature was increased.
The peak absorption wavelengths of the deconvoluted spectra were found to lie between 200 nm and 360 nm, which are within the absorption band of azo dyes, with their absorption peaks broadly captured within the UV–Vis spectrum.
This spectroscopic technique is objective and better in determining the colorfastness of a fabric, and provides more information compared with the conventional subjective gray scale method used for the visual evaluation of color changes in materials after undergoing a laundry process. The Ghanaian fabric is considered to be more adaptive to our cultural settings due to their symbolic traditional designs, but tend to depreciate in quality, strength, and color relatively faster compared to imported prints when laundered. This is because most Ghanaian fabrics do not have instructions on how to care for them, and as such are washed anyhow, leading to their rapid deterioration. Dyes behave in different ways under varied conditions and when in contact with different agents. Dyes which may be fast in cold water may behave differently in a warm environment. Color is an essential element of the fashion and art of fabrics to the extent that inferior colorfastness in fabrics is a major source of protestation. Understanding therefore the durability of metallic printed fabrics can support sustainability efforts by encouraging the production of longer-lasting textiles and minimizing waste. The findings of this study will educate soap manufacturing companies on conditions that result in the bleeding of colors in fabrics. It will help textile manufacturers develop objective standardized testing protocols to assess the colorfastness of metallic printed fabrics, ensuring products meet quality standards before they reach the market. Such improved, scientifically based colorfastness testing method will enable better material choices and formulations for enhanced durability, benefiting both manufacturers and consumers by reducing product returns. Additionally, the research can guide the care of metallic printed textiles by developing care labels, extending their lifespan and preserving color vibrancy. Designers may also apply these insights to experiment with new metallic printing techniques, leading to innovative designs that combine durability with visual appeal.
Conflicts of Interest
The authors declare no conflicts of interest.
Funding
No funding was received for this manuscript.
Acknowledgments
We appreciate the support of World Academy of Sciences (TWAS), Research Grant Scheme (No. 20-002 RG/PHYS/AF/AC_I-FR3240314123) through the International Centre for Theoretical Physics (ICTP), under the auspices of the Swedish International Development Cooperation Agency (SIDA). Appreciation also goes to all researchers at the Laser and Fibre Optics Centre (LAFOC) of the University of Cape Coast.
Open Research
Data Availability Statement
The data that support the findings of this study are available from the corresponding author upon reasonable request.


