Phosphorus Removal by Chemical Precipitation in Wastewater Treatment Plants
Abstract
The EU regulations limit the total phosphorus (P) concentration to 2 mg/L in the discharge effluent from wastewater treatment plants to minimize the negative impacts of nutrients in the ecosystems. This study focuses on monitoring and removal of P in the municipal wastewater treatment plant in Baiona, NW Spain. P is removed in the plant by precipitation as ferric phosphate with the continuous addition of ferric chloride. The FeCl3 dose is adjusted with periodic phosphate analysis in the discharge effluent. This procedure results in a large excess of FeCl3 dosage due to the daily and seasonal variations of P in the wastewater (2.5–8 mg/L). The excess dosage ensures compliance with the P legal limit but increases the consumption of FeCl3 and the associated costs. In this study, we tested the benefits of P concentration monitoring in the discharge effluent with an automated analyzer to optimize the dosage of FeCl3. The automated analyzer determines the P concentration every 2 h and uses this information to adjust the FeCl3 dosage to the real needs. This mode of operation minimizes FeCl3 consumption while ensuring compliance with the legal P discharge limit. Comparing the reagent consumption of 1 year of operation with the previous year with no automated analyzer, the consumption was cut back by 50%. The savings in precipitation reagent can compensate the analyzer installation cost in just 2 years of operation, confirming the rapid return of the investment. Besides, the P precipitation system with the automated analyzer showed stable operation throughout the year under different wastewater flow and P concentration conditions, confirming the system reliability and efficiency in maintaining consistent P removal performance.
1. Introduction
The release of nutrients in the environment has generated serious negative impacts in natural ecosystems, including eutrophication and biodiversity loss [1]. Municipal and industrial wastewater had been identified as sources of contamination by phosphorus (P) [2]. The classical wastewater treatment plants with physicochemical (primary) and biological (secondary) treatment are not effective in removing P, which remains in significant concentration in the final discharge effluent, not assuring the compliance of the legal limit of 2 mg/L of total phosphorus (TP) imposed by the UE regulations [3]. The concentration of P in urban wastewater typically ranges from 2 to 16 mg/L TP [4]. In the wastewater treatment plant (WWTP), P is mainly removed in the secondary biological treatment with an efficiency of about 20% [5]. The use of enhanced biological phosphorus removal (EBPR) can achieve efficiencies of about 80%–90%. EBPR systems are quite common in large WWTPs due to their ability to handle high volumes of wastewater and achieve significant P removal without the need for chemical additives. These systems are less common in small- or medium-sized plants due to investment costs and operational complexities [5]. Instead, small- and medium-sized plants use a precipitation system for phosphate with the controlled addition of Fe(III) or Al(III) salts [6]. The chemical precipitation of phosphate commonly uses ferric or aluminum chloride that are added to water after the biological reactor. P is precipitated as aluminum or iron phosphate and then the precipitate is collected with the sludge in the secondary settling tanks [6]. The main advantages of P chemical precipitation are the high efficiency of the process, the simplicity in operation, and the versatility for different types of effluents and phosphate concentrations. The main shortcoming is the cost of chemical reagents. However, it is reported that chemical precipitation is a cost-effective solution for small and medium WWTP [7].
P plays a crucial role in natural ecosystems, but the excess of P in water results in negative impacts that alter the ecosystem equilibrium. The main negative impacts of P are related to eutrophication, algae blooms, and loss of biodiversity. In Galicia, a region in the NW of Spain, the administration is very concern about the impacts of nutrients in the marine ecosystem due to the importance of fishing and aquaculture activities in the regional economy [8]. The coastal waters in Galicia are especially sensitive to P enrichment due to agricultural runoff and wastewater discharge in enclosed marine estuaries with a relatively low water renewal rate. This can lead to localized eutrophication. Besides, Galicia`s marine ecosystem is prone to harmful algal blooms, with severe impact in fisheries and aquaculture activities. The enrichment of P in estuary sediments was also detected. P in sediments can be redissolved in the water column perpetuating the cycle of eutrophication [9]. Based on this information, controlling and minimizing the discharge of P from wastewater treatment plants is crucial to prevent eutrophication, protect fisheries and aquaculture, and maintain ecosystem health. Therefore, effective P management is essential to safeguard the ecological and economic wellbeing of the region [10].
In this context, this study focuses on the monitoring and removal of P in the wastewater plant in Baiona town (NW of Spain) using and automated analyzer to measure the TP concentration in the discharge effluent. This information is used to adjust the precipitation reagent dose in the WWTP. The objective is to demonstrate that this mode of operation allows for the minimization of reagent (FeCl3) consumption while assuring a minimum release of P in the marine ecosystem, always below the legal discharge limit (2 mg/L TP). The analysis of P was done with an automated analyzer from Humas Co. LTD (Republic of Korea). The analyzer TP-4200 determines the TP content in intervals of 1-2 h. The study was designed to demonstrate the stability and analysis precision of the automated analyzer, the practical viability of P monitoring and the economic feasibility of the analysis-precipitation system for P removal in WWTP.
2. Materials and Methods
2.1. WWTP
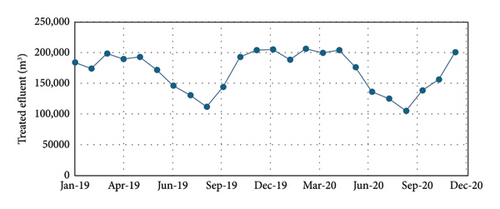
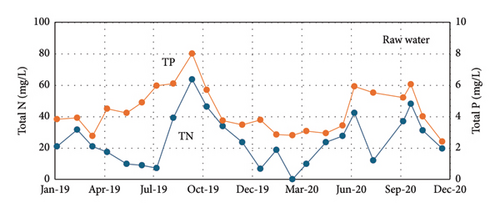
This study selected the municipal WWTP in Baiona (NW of Spain). Baiona is a touristic town with a medieval historical center located in the entrance of Vigo Bay (Spain). Baiona population is about 11,000 people, but it rises to about 45,000 people in summertime. The increased population in summertime has a significant impact on wastewater contaminant load. The highest peaks of BOD, nitrogen, and P concentration in the influent (raw water) to the WWTP are registered in summer. In winter, the decrease of the actual population and the frequent rains dilute the raw wastewater to the WWTP.
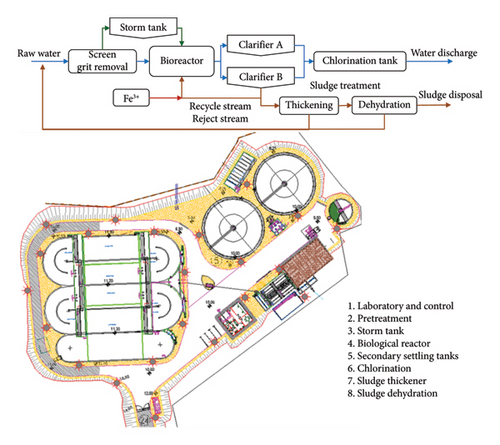
The WWTP of Baiona (Figure 1) is composed of a pretreatment followed by a biological reactor. There is no primary (physicochemical) treatment. A storm tank is used to accumulate the wastewater in specific moments when the rain increases the raw water flow over the capacity of the plant. The secondary settling tanks separate the treated water from the biological sludge. The sludge is concentrated and dehydrated before being sent out for further management and final disposal. The treated water flows through a chlorination tank before final discharge into the sea through a marine outfall.
2.2. TP Analyzer
The concentration of the TP in the discharge effluent was measured with an automated P analyzer supplied by Humas Co. Ltd. (Republic of Korea), model TP-4200 [11]. The analyzer took the sample from the waterline in the WWTP (Figure 2) after chlorination and before the final discharge.
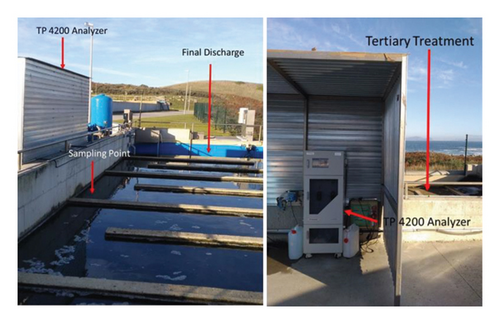
The TP-4200 from Humas Co. Ltd. is an automated analyzer that measures the concentration of TP in the water sample in the range between 0 and 20 mg/L. The analyzer makes a digestion of the water sample with persulfate at high temperature to convert all P compounds into phosphate, and then the phosphate is measured by absorption spectrophotometry using the ascorbic acid reduction method [12]. The total cycle of the analysis takes 1 h. The analysis of the total phosphorous in the discharge effluent requires the TP-4200 to be located near the sampling point to minimize the delay between the water sampling and the analysis. The analyzer shows the best performance at 5°C–35°C.
In this study, the automated analyzer was adjusted to a measuring range of 0–5 mg/L TP considering the expected P concentration in the final effluent from the WWTP. Figure S1 in Supporting Information shows the calibration of phosphate in the range 1–5 mg/L P-PO43− with the TP-4200. The calibration and the operation of the TP-4200 was very stable. The calibration was determined to be stable for more than 1 month, especially in winter. In summertime, the sunlight and warm temperatures (higher than 30°C) accelerate the degradation of the chemical reagents, especially the ascorbic acid, affecting the analysis results and reproducibility of the calibration. So, it is important to protect the analyzer from direct sunlight and keep the temperature of the reagents low (20°C or below) to avoid the premature degradation of the reagents. The problem of the stability of the reagent solutions can be easily solved using a refrigeration unit. To assure a precise response from the analyzer, the calibration and the reagents were renewed every 2-3 weeks. Figure S2 in Supporting Information shows the stability of the calibration from July to December 2019. Repeated analyses of various wastewater samples demonstrate the precision and reproducibility of phosphate analysis with TP-4200 as shown in Figure S3 in Supporting Information. The repeated analysis of three wastewater samples in the range 0–2 mg/L P-PO43− resulted in absolute errors below 0.05 mg/L. Detailed information about the calibration and P analysis with the TP-4200 analyzer can be found in the Supporting Information.
2.3. Analytical Methods
The analysis of the TP in the discharge effluent of the WWTP was measured in situ with the TP-4200 automated analyzer with a frequency of 2 h. The same water samples were taken and analyzed in the laboratory of the University of Vigo to test the accuracy and stability of the automated analyzer. The analysis in the laboratory used two methods: the colorimetric method based on ascorbic acid and ICP-AES (inductively coupled plasma atomic emission spectroscopy) as described by Lipps, Braun-Howland, and Baxter [12]. These methods were selected for their accuracy and precision as reported in literature [6, 12, 13].
3. Results and Discussion
3.1. Contaminant Load in the Raw Water to the WWTP
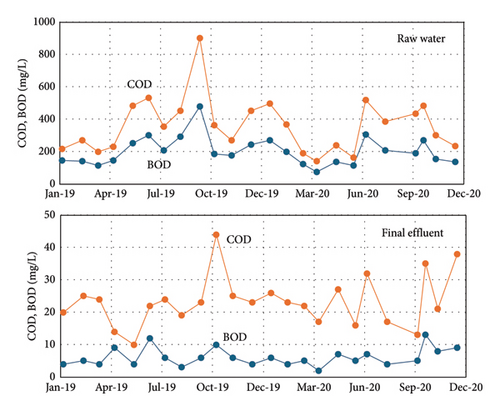
Figures 3, 4, and 5 show the amount of water treated in the WWTP and the contaminant load (COD, BOD, TP, and total nitrogen). As can be observed, in winter, the frequent rain dilutes wastewater, but in the period of summer vacations (June–September), the concentrations of COD, BOD, P, and N are the highest values of the year, adding complication to the operation of the treatment plant. In the case of P, it implies a continuous adjusting of the precipitating reagent to adapt the dose to the real needs, if not, an excess of reagent is consumed, increasing the operational costs.
3.2. Analysis of TP in WWTP Effluent
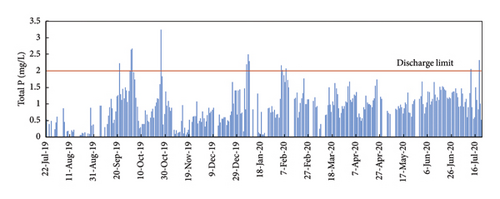
The TP concentration in the discharge effluent is below the legal limit of 2 mg/L during the monitored year from July 2019 to July 2020, except in 7 specific days where the concentration exceeded the limit by a maximum of 1.3 units. The excess of the P in September and October 2019 was due to fluctuations in P in the raw water that overpass the capacity of the precipitation system when the dosing pump was manually operated. This happened before the automated analyzer was connected to the plant control system. In January, February, and July 2020, the excess of P in the discharge effluent corresponded to maintenance operations when the analyzer was disconnected from the plant control system. So, such excess of P was not due to a bad functioning of the automated analyzer or the plant control system [15].
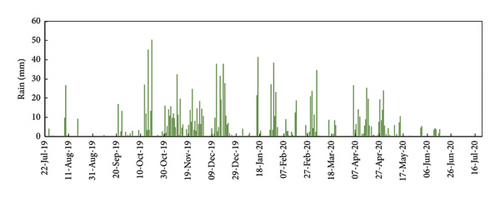
Rain also affected the concentration of P in the raw water and the final discharge effluent (Figure 6(b)). In general, rainy days correspond with lower P concentrations in the raw water and also in the discharge effluent. The alternating days with and without rain made it more difficult to adjust the Fe3+ dosing system in manual mode. In rainy days, the concentration of P in the raw water tend to decrease to very low values, sometimes even lower than 2 mg/L of TP (the TP discharge limit). So, on rainy days, the need for ferric chloride is minimum. When the rain stops, the concentration of contaminant load returns to normal values in the raw water, and the demand for ferric chloride increases rapidly. With a manual dosing system is not possible to adjust the dosing of ferric chloride to the real needs. That is why, in Figure 6, we can observe a very low concentration of P in the discharge effluent in rainy days (e.g., 13–19 October 2019) and that P concentration sharply increased the following days when the rain stops (e.g., 25–27 October 2019) [16].
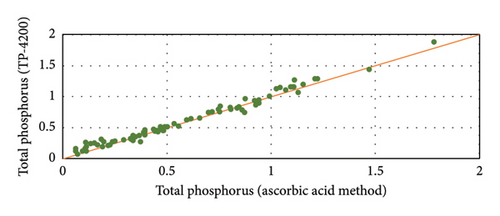
The operation and stability of the automated analyzer was monitored with periodic analysis at the University of Vigo of the same water samples measured with the TP-4200. The analytical methods were the ICP-AES and ascorbic acid method as described by Lipps, Braun-Howland, and Baxter [12]. The TP-4200 results for P concentration in the discharge effluent are very close to the control analysis at the University by ICP-AES and ascorbic acid method. Figure 7 shows a detailed comparison of the analysis with the ascorbic acid method and the automated analyzer. The results with ICP-AES (not shown) were very similar to the ascorbic acid method. The results in Figure 7 show that P concentration in the effluent ranges from 0.2 to 0.9 mg/L of P. The average error of the TP-4200 analysis was 0.08 mg/L (absolute error) when compared with ICP-AES and 0.06 mg/L when compared with the colorimetric method based on ascorbic acid. These are very low analytical errors considering the low P concentration in the water samples. Thus, it can be concluded that the TP-4200 gives very accurate results, very close to the real P concentration determined in the laboratory.
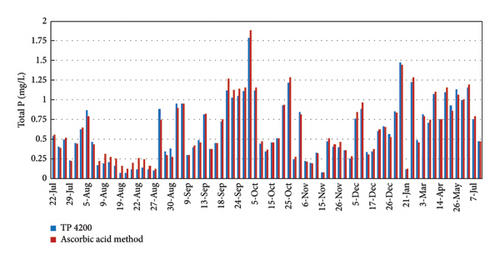
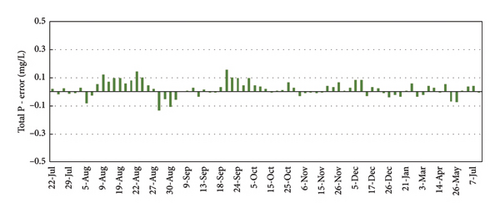
Figure 8 shows the correlation between the TP-4200 automated analyzer and the ascorbic acid method at the University. Considering the accurate results of the colorimetric method with ascorbic acid, this method was selected to control the operation of the TP-4200 from September 2019 to July 2020. The average absolute error in September-October was 0.04 mg/L, whereas the average error decreased to 0.03 mg/L in November-December, because of the close supervision of the operation of the automated analyzer, protecting the device from the direct sunlight and maintaining the quality of the reagent solutions. From January to July 2020, the difference between the automated analyzer and the control analysis at the Univ. of Vigo were low in a wide range of concentrations (0.11–1.47 mg/L) with an average absolute error of 0.04 mg/L. These results proved that the analysis of the automated analyzer was stable and accurate with periodic calibration and maintenance of the reagent solutions every 2-3 weeks.
3.3. Effect of Rain in P Concentration
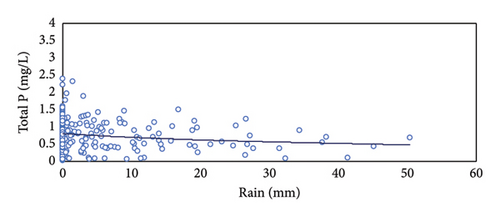
Rain has also a significant influence on the P concentration in the WWTP. In summer, when the precipitations were very low and the population increased due to the affluence of tourists, the highest P concentrations in the sewage water were registered, as well as the fluctuations throughout the day. The abundant rains in winter diluted the concentration of contaminants as well as the P concentration. Figure 9 shows that the concentration of P in the discharge effluent tended to decrease with the increasing precipitations on rainy days due to the dilution effect. Therefore, when the concentration of P in the wastewater decreases, the dosage of ferric iron could be reduced. However, the manual regulation of the ferric chloride dosing pump could not be adjusted to the fluctuations of P as fast as it is needed. As a result, dosing is too high or too low and we are spending reagent unnecessarily or there is a risk of overpassing the legal P limit in the final discharge. As reported by Zhang, Li, and Wang [16], rain events affect the process performance in the WWTP, especially in the particle removal, but also in the final concentrations of nutrients due to the high hydraulic load and the loss of efficiency to operate in diluted media. Lawrence, Giurea, and Bettinetti [17] and Albornoz et al. [18] found that the rain events affect the blanket of sludge in the biological reactors with loss in solids that overload the capacity of the secondary settling tanks, with the subsequent effect in the quality of the final effluent. Albornoz et al. [18] found increasing concentrations of total solids, turbidity, and organic matter in the final effluent associated with rain events. Furthermore, the increase in the flow led to a significant increase in the cost of treatment [19]. As a conclusion, a monitoring system for TP concentration seems to be the right solution to assure the removal of P with minimum reagent additions even in the extreme conditions created with intense rains as registered in the Baiona WWTP.
3.4. Dosage of Ferric Chloride for P Removal
The P removal in the WWTP of Baiona is based on the chemical precipitation of phosphate with ferric iron, as presented in equation (1). Ferric iron is added to the recycling stream to assure a complete mixing of the precipitating reagent with the water in the biological reactor. The agitation in the biological reactor kept the precipitate of ferric phosphate in suspension and it is finally removed in the secondary settling tanks, mixed with the biological sludge [6]. Figure 10 shows the TP concentration in the raw water in the inlet stream and in the discharge effluent from the WWTP. The comparison of the TP between the inlet and the outlet stream informs about the efficiency of the WWTP in the removal of P. TP concentration was measured in composed samples of 24 h in the inlet (raw water) and the outlet streams (discharge: external analysis). The monitoring of P was done for a period of 1 year (from July 22, 2019, to July 21, 2020), taken 1 or 2 samples per month in selected days as reported in Figure 10. The analyses were done in an accredited external laboratory as per legal requirements since these TP concentrations were used to control the operation of the plant by the administration. It is evident that the WWTP was able to remove the excess of P to values below the legal discharge limit during the whole year. The TP concentrations were much higher in summer (4–9 mg/L of TP) due to the increase of population explained before in this manuscript. In winter, lower population and the dilution due to frequent rains resulted in TP concentration in raw water around 2 mg/L or below.
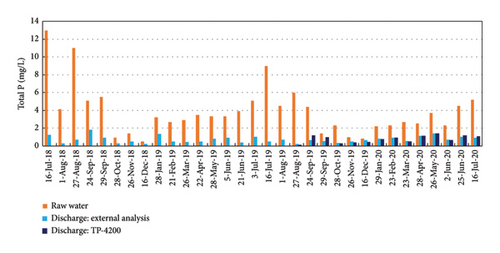
Figure 9 also compares the TP concentrations in the discharge effluent analyzed by the external laboratory (24 hours-composed samples) with the TP results with the TP-4200 automated analyzer. The automated analyzer measured a sample every 2 h, so the 24 h-composed sample sent to the external laboratory is compared with the average measurements of the automated analyzer during the same period of time of 24 h (12 measurements, every 2 h). Figure 9 shows that the automated analyzer and the external laboratory gave a very similar P concentration in the discharge effluent from August 2019 to July 2020, with an absolute error below 0.2 mg/L of P.
As explained before, in the beginning of this study, from July to October 2019, the removal of P in the WWTP was carried out adjusting manually the ferric chloride dosing pump. That adjusting is done based on the periodic analysis of P in the discharge effluent by the external laboratory, so it is done 1 or 2 times per month. The operation of the dosing pump also considers the actual inlet flow to the WWTP. This procedure shows two main limitations. First, complying with the P legal limit in the final effluent is not assured because any fluctuation in the P concentration in the inlet stream may overpass the capacity of the precipitation system. Second, to ensure the meeting of the TP legal limit, ferric chloride is added in excess. As a conclusion, the manual operation of the precipitation system is very costly due to the reagent consumption, and there is no assurance that the legal limit is met.
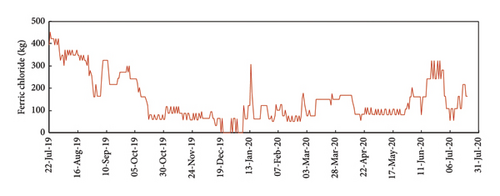
In this study, we selected and installed an automated analyzer to solve both problems: assuring the meeting of the legal limit with minimum precipitation reagent consumption. The ferric chloride dosing pump was controlled considering the actual P concentration in the discharge effluent. As can be seen in Figure 11, the dosage of ferric iron was lower from October 2019 to July 2020, when the automated analyzer was connected to the WWTP control system. The dosage of ferric iron was much higher in July–October 2019 when the measurement of the automated analyzer was still not used to adjust the operation of the dosing pump.
The benefits of the automated analyzer in reducing the consumption of ferric chloride can be evaluated comparing the P concentrations in the raw water and discharge effluent, and the consumption of ferric chloride for two different periods: August 2018–July2019 and August 2019-July 2020 as presented in Figure 12. As can be observed, the P concentration in the inlet effluent (raw water) to the WWTP in the two periods was very similar with low concentrations in autumn–winter–spring and higher concentrations in summer. The average P concentration in the discharge is below 2 mg/L (the legal limit) due to the dosage of ferric chloride. However, the consumption of ferric chloride was very different in the first period (August 2018–July 2019) compared with the second period (August 2019-July 2020). In fact, the consumption of ferric chloride clearly decreased after the use of the automated analyzer to adjust the dosage of ferric iron in October 2020. Comparing the consumption of ferric chloride in the two periods in Figure 12, the savings in the chemical reagent was 31 tons/year. The value could be even higher considering than in the second period (August, September, and October, 2019), the automated analyzer was in installation and it was still not connected to the WWTP control system, so the operation of the dosing pump was not fully automated.
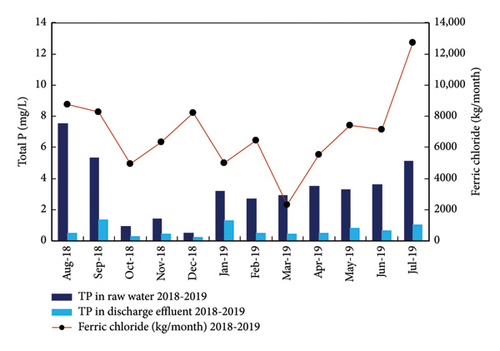
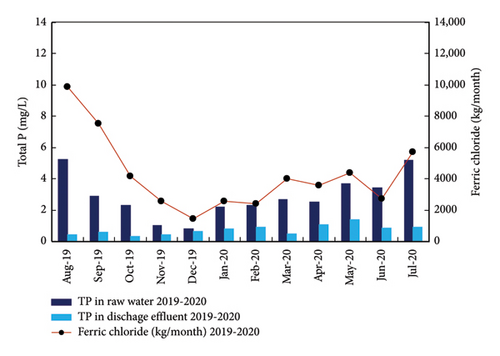
Overall, the use of the automated analyzer allows for a close control of the P in the discharge effluent, assuring the meeting of the legal discharge limit with a minimum consumption of the chemical reagent for the precipitation of phosphate. The savings in the chemical reagent were estimated to cover the installation costs of the TP-4200 automated analyzer in just 2 years of operation.
4. Conclusions
The TP-4200 automated analyzer showed very accurate results when comparing the P concentrations in the WWTP effluent with the control analysis in the University of Vigo. The calibration and the operation of the TP-4200 was very stable. It is important to protect the analyzer from the direct sunlight and keep the temperature of the reagents low (20°C or below) to avoid the premature degradation of the reagents, especially the ascorbic acid solution. The problem of the stability of the reagent solutions can be easily solved using a refrigeration unit. The calibration and the reagents are stable and give accurate results for at least 2-3 weeks. The protection of the analyzer from the sunlight and keeping the reagent at moderate temperatures (< 20°C) assures stable operation and accurate results for about 1 month of continuous operation.
This study demonstrates that effective control of P discharge into the environment can be achieved using an automatic analyzer. This ensures that discharge levels remain below legal concentration limits while minimizing reagent consumption. The resulting economic savings can offset the cost of the automatic analyzer within just 2 years. This approach is economically viable for small to medium-sized plants, where operational costs are often a limiting factor affecting the plant’s viability or for municipalities with limited resources. These findings can be extended to any municipal water treatment plant or even industrial facilities. The system is technically stable, precise, and economically viable.
Conflicts of Interest
The authors declare no conflicts of interest.
Author Contributions
A.C. contributed to the sampling, sample analysis, investigation, and first draft preparation. S.G. was involved in sample analysis, investigation, and reviewing and editing of the manuscript. C.C. was involved in the conceptualization, methodology, data analysis, reviewing and editing, and project administration. K.-H.L. contributed to the resources, data analysis, and reviewing and editing of the manuscript.
Funding
This research was supported by the Ministry of Environment, Republic of Korea (MOE) through Green Innovative Business Growth Support Program (Project no. ARQ202201401001). The authors also thank the Spanish Ministry of Science and Innovation (Project reference number: PID2020-115879RB-I00) and Xunta de Galicia (Spain) since this study is part of the activities of the Group with Potential for Growth (GPC-ED431B 2021/23).
Acknowledgments
The authors are grateful to Aguas de Galicia, GESECO AGUAS S.A., and Pedro Payo for their support during this study in WWTP of Baiona (NW Spain).
Supporting Information
Supporting Information includes the operation and stability of the automated analyzer with periodic analysis at the University of Vigo. The same water samples were measured with the TP-4200 in situ in the WWTP and with the colorimetric method (with ascorbic acid) at the University of Vigo.
Open Research
Data Availability Statement
The data that supports the findings of this study are available in the Supporting Information of this article.


