Carboxymethyl Cellulose (CMC) Synthesis and Characterization From Invasive Weed Senna didymobotrya Through Response Surface Methodology (RSM)–Guided Alkalization and Etherification Methods
Abstract
In this study, the synthesis of carboxymethyl cellulose (CMC) from nonusable invasive weed Senna didymobotrya cellulose was possible through response surface methodology (RSM)–guided alkalization and etherification methods. The RSM method indicates that the maximum CMC yield obtained, 0.85 gm or 85.6%, was achieved when 1 gm or 6 mol of anhydrous glucose unit (AGU) cellulose reacted with 1 gm or 3.24 mol of KOH/AGU and 1.1 gm or 2.05 mol of monochloroacetic acid (MCA)/AGU at 60°C with a total reaction time of 2 h. This finding opens a new avenue for saving chemicals while producing industrial chemicals. The RSM analysis also indicates that the method was significant and valid. This is because the factors and factor interactions used in this method were significant (p < 0.05) and the method was precise because the adequate precision (30.7) found was much higher than the expected precision value of 4. The factors used were alkalization, etherification, and temperature. The degree of substitution of synthesized CMC was 2.5 and comparable with the commercial CMC (2.9). The viscosity measurement of the synthesized and commercial CMC indicates that both materials showed non-Newtonian pseudoplastic behavior. The viscosity of the synthesized CMC was 331.64 cP and the commercial CMC was 227.08 cP. This indicates that the synthesized CMC was more viscous than the commercial CMC. Hence, the synthesized CMC could be used as a good thickener in different factories. The FTIR, XRD peaks, and SEM images indicate that the CMC was synthesized from the isolated cellulose. The TGA/DTA analysis also indicates the CMC was thermally stable up to 380°C and exhibited heat resistance up to 800°C. Therefore, the two simplest, not time- and energy-taking, methods used and the results of their characterizations with respect to commercial CMC indicate that our synthesized CMC from the weed Senna didymobotrya cellulose can be extended to large-scale production of CMC and marketed locally and worldwide.
1. Introduction
The need for industrial chemicals is increasing rapidly worldwide due to the rapid growth of the human population. Due to this, there is a massive usage of fossil fuels for making industrial chemicals and as an energy source. As it has been clear, the world is changing its direction to fulfill these needs because the natural fossil fuel reservoirs are being depleted from time to time. The other problem with using fossil fuels is carbon dioxide emission during processing, which causes rising atmospheric temperatures and global warming. One of the solutions to make nonfossil-fuel-based industrial chemicals is converting lignocellulose biomass to industrial chemicals [1].
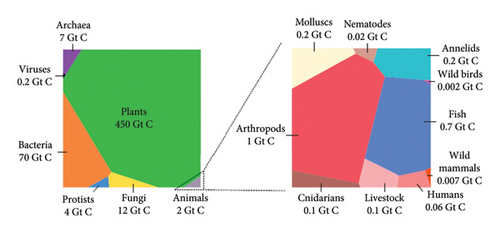
Lignocellulose biomass is one of the chemicals found in plant biomass. Generally, the chemical content of biomass is cellulose, hemicellulose (xylans, mannans, galactans, and arbino-galactans), lignin (polymer of phenylpropene), starch (amylase and amylopectin), minor organic components (lipids, protein, acetyls, and uronic acid), inorganic matter, other elements (pigments, wax, and secondary metabolites), and fluid matter [2]. As shown in the Voronoi diagram (Figure 1), plant biomasses are the first and largest biomasses found on Earth next to bacteria. It accounts for 450 Gt of carbon, which is 80% of the total biomass. The figure is adopted from [3]. This indicates there is a big opportunity to study and utilize plant biomass for making industrial chemicals.
For instance, a study conducted by [1, 4] indicates the following chemicals and fuels are synthesized from cellulose: levoglucosenone, γ-lactone, furanose, furfural, 5-methoxymethylfurfural and their derivatives, furans, aromatic hydrocarbons, aldehydes, ketones, formic acid, acetic acid, and ethanol. Similarly, ethanol, biodiesel, glucose, xylitol, xylonic acid, furfural, levulinic acid, phenol, and vanillin are synthesized generally from lignocellulose materials [1, 5]. The other chemicals that are synthesized from cellulose are carboxymethyl cellulose (CMC) [6], hydroxypropyl cellulose [7], and cellulose nanocrystal [8]. Generally, the methods that are used to synthesize these chemicals are pyrolysis, fermentation, and modifications. However, the problem is the source of cellulose. Cellulose is obtained from plants. This indicates that deforestation and related issues are the problem. Therefore, in this research, the nonusable and invasive weed Senna didymobotrya was used to synthesize CMC using response surface methodology (RSM)–guided alkalization and etherification methods. To our knowledge, no previous work has been conducted on this weed. Additionally, this weed invasion became severe in East and South Africa [9]. The other reason that initiated this study is that the consumption of CMC is increasing every year. CMC is one of the important commercial chemicals used by different and many industries worldwide. It is used in food and beverage, detergent and laundry, oil and gas, pulp and paper, personal care (toothpaste), pharmaceuticals, and so on (https://www.gminsight.com) [10].
More importantly, in our study, as RSM was used, it gives an advantage of multiple factor interaction rather than one factor at a time interaction performed by most researchers [11–13]. Hence, our synthesized CMC yield was statistically approved significantly. Similarly, we also used commercial CMC for comparison with respect to the degree of substitution (DS) and viscosity. Therefore, the two simplest (not time- and energy-taking) methods we used and their characterization results with respect to commercial CMC indicate our synthesized CMC from the weed Senna didymobotrya cellulose can be extended to large-scale production of CMC and marketed locally and worldwide.
2. Materials and Methods
2.1. Materials and Chemicals
The following materials were used in this study: isolated cellulose, potassium hydroxide (KOH) (99%, Central Drug House, India), monochloroacetic acid (MCA) (99% for synthesis, Loba Chemie, India), acetic acid (99% for HPLC, Loba Chemie, India), methanol (pure, Sisco Research Laboratories, India), hydrochloric acid (35%–38%, Central Drug House, India), phenolphthalein, sulfuric acid (98%, Central Drug House, India), sodium chlorite solution (99%, Brenntag, Germany), commercial CMC sodium salt (CMC, MW: 22,525.296, viscosity [25°C, 1%; water]: 300–600 cP or mPa.s, VWR Chemicals, China), modular compact rheometer (MCR) 102 (Anton Paar, South Africa), Fourier Transform Infrared (FTIR) spectroscopy (Nicolet™ iS50 FTIR Spectrometer, Thermo Scientific, USA), X-ray diffractometer (XRD-7000, SHIMADZU, Japan), scanning electron microscopy (SEM) (JEOL JCM-6000Plus), and differential thermal gravimetry (DTG-60H, SHIMADZU Corporation, Japan).
2.2. Cellulose Isolation
The complete isolation method was described in our previous work, and it was published [14]. In brief, 10 gm of dewaxed powder of Senna didymobotrya was treated with 3% sulfuric acid at 90°C for 2 h. Then, after filtration, the acid-treated residue was bleached with 3% sodium chlorite at pH 4.5 at 90°C for 2 h. Finally, the residue was delignified with 6% KOH at 90°C for 2 h. In all cases, a 1:50 weight-to-volume ratio was used.
2.3. Proximate Chemical Analysis and α-Cellulose Determination
Like the cellulose isolation method, the lignin, hemicellulose, moisture, and ash contents of the weed Senna didymobotrya were also analyzed in our previous work and it was published [14]. However, the α-cellulose content determination was carried out here in this research separately. The α-cellulose content of the weed was determined by a method indicated in the literature [15]. In brief, 5 gm of dewaxed powder of the weed was heated in a beaker contained in a water bath at 20°C. Then, when the powder filled the heat, a 17.5% KOH solution was poured into the beaker and waited for 30 min with continuous stirring. Then, the mixture was cooled, dried, and weighed. Then, 400 mL of distilled water was added to the dried powder and filtered or washed three times. Then, 100 mL of 20% acetic acid was added to the powder and waited for 10 min. After filtering out the acetic acid, 1 L of boiled water was added to the wet powder. Finally, the boiled water was filtered out and the wet powder (α-cellulose) was dried and weighed. This procedure was carried out three times. The percent of α-cellulose was then determined by taking the weight difference in the initial weight used and the weight obtained at the end.
2.4. Synthesis of CMC
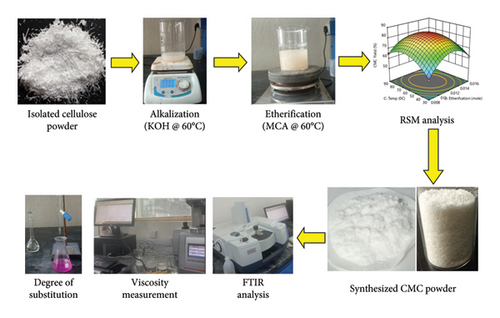
After completing the abovementioned experiment, a series of experiments was conducted with the aid of RSM obtained from a recently released design of experiment (DOE) version 13 software (Stat-Ease Inc., Minneapolis, MN, USA). The main objective of the usage of RSM was to optimize the yield. It is done by varying variables to determine the favorable reactant combination in mole and reaction condition in temperature. Similarly, other supporting and crucial parameters such as the DS and viscosity of the synthesized CMC were also measured concerning the variable reactant combination in mole.
2.4.1. Optimization of CMC Synthesis by RSM
| Symbol | Factors | Actual value | ||
|---|---|---|---|---|
| Low value (−1) | Center value (0) | High value (+1) | ||
| A | Alkalization (mol) | 0.015 | 0.019 | 0.023 |
| B | Etherification (mol) | 0.008 | 0.012 | 0.016 |
| C | Temperature (°C) | 30 | 60 | 90 |
| Std | Factor 1 | Factor 2 | Factor 3 | Response 1 | |
|---|---|---|---|---|---|
| A: Alkalization | B: Etherification | C: Temp | CMC yield | Predicted yield | |
| Mole | Mole | °C | % | % | |
| 1 | −1.000 | −1.000 | 0.000 | 80 ± 0.1 | 79.52 |
| 2 | 1.000 | −1.000 | 0.000 | 55 ± 0.01 | 55.38 |
| 3 | −1.000 | 1.000 | 0.000 | 60 ± 0.05 | 59.63 |
| 4 | 1.000 | 1.000 | 0.000 | 76.6 ± 0.2 | 77.07 |
| 5 | −1.000 | 0.000 | −1.000 | 75 ± 0.1 | 75.05 |
| 6 | 1.000 | 0.000 | −1.000 | 65 ± 0.2 | 64.2 |
| 7 | −1.000 | 0.000 | 1.000 | 70 ± 0.2 | 70.80 |
| 8 | 1.000 | 0.000 | 1.000 | 75 ± 0.1 | 74.95 |
| 9 | 0.000 | −1.000 | −1.000 | 55 ± 0.3 | 55.42 |
| 10 | 0.000 | 1.000 | −1.000 | 62 ± 0.4 | 62.32 |
| 11 | 0.000 | −1.000 | 1.000 | 65 ± 0.04 | 64.67 |
| 12 | 0.000 | 1.000 | 1.000 | 60 ± 0.05 | 59.57 |
| 13 | 0.000 | 0.000 | 0.000 | 85.6 ± 0.1 | 84.56 |
| 14 | 0.000 | 0.000 | 0.000 | 83 ± 0.2 | 84.56 |
| 15 | 0.000 | 0.000 | 0.000 | 85.6 ± 0.1 | 84.56 |
| 16 | 0.000 | 0.000 | 0.000 | 85.6 ± 0.1 | 84.56 |
| 17 | 0.000 | 0.000 | 0.000 | 83 ± 0.2 | 84.56 |
2.5. Characterizations of CMC
2.5.1. Determination of DS of CMC
2.5.2. Determination of Apparent Viscosity of CMC
The apparent viscosity (η) of the abovementioned three synthesized CMC products was also measured by an MCR 102 (Anton Paar, South Africa) at a shear rate of 3.4 s−1 and 25°C. The apparent viscosity at a shear rate of 3.4 s−1 and 25°C of commercial CMC products was also determined for comparison. These reactions are part of the optimization method used by the RSM method. Finally, the apparent viscosity of one optimized CMC product was also determined at different shear rates ranging from 3.4 to 34 s−1 and at 25°C.
2.5.3. Purity
The moisture content of CMC was also determined by the standard method ASTM-D 1439–03 [17]. In brief, some grams of CMC sample “as received or did not lose its moisture” were taken in a crucible and placed in a conventional oven at 105°C for 2 h. Then, by recording the weight difference before and after drying, the percent moisture content was determined.
2.5.4. FTIR Spectroscopy
To evaluate the heterogeneous reaction effect and compare synthesized CMC with commercial CMC, the FTIR spectra of isolated cellulose, synthesized CMC, and commercial CMC were executed using FTIR spectroscopy (Nicolet™ iS50 FTIR Spectrometer, Thermo Scientific, USA). FTIR spectra were performed in the range of 4000–400 cm−1 at a resolution of 16 cm-1, and 65 cumulative scans were taken.
2.5.5. XRD
2.5.6. SEM
To evaluate the morphology difference between before and after the heterogeneous reaction effect, SEM observation was performed on isolated cellulose and synthesized CMC. Similarly, SEM observation was performed on synthesized CMC and commercial CMC for comparison. The SEM (Model JEOL JCM-6000Plus) was executed at high-vac., SED PC-std., and 5 kV. The dried sample was placed in a vacuum on the carbon plate of the sample holder and then coated with gold fleck. The images were recorded at a 50 μm scale with a resolution scale of 500x.
2.5.7. Thermal Stability Analysis (TGA/DTA)
The thermal stability difference between isolated cellulose, synthesized CMC, and commercial CMC was investigated using thermal gravity analysis (TGA)/differential thermal analysis (DTA) with the differential thermal gravimetry (DTG—60H, SHIMADZU Corporation, Japan). The samples’ heating temperatures were slowly raised from 20°C to 800°C at a rate of 20°C min−1, and the flow rate of nitrogen gas was 50 mL·min−1. At different temperatures, the weight loss (%) was recorded.
3. Results and Discussion
3.1. Cellulose Isolation, Proximate Chemical Analysis, and α-Cellulose Determination
The cellulose and lignin content of the weed was studied in our previous work, and it was published [14]. However, the α-cellulose was separately determined in this research. Generally, the holocellulose, cellulose, α-cellulose, hemicellulose, and lignin contents of the weed Senna didymobotrya were 74%, 37.5%, 28.9%, 37%, and 20%, respectively. Similarly, the moisture and ash contents of isolated cellulose were 10% and 0.1%, respectively. The lignin content and the ash and moisture content of the weed and isolated cellulose make the weed suitable to prepare paper, CMC, and other cellulose derivatives. The lignin content should be less than 27%, and the ash content should be less than 1%, so the wood or cellulose could be used for different applications [15].
3.2. CMC Synthesis Yield and Its Optimization
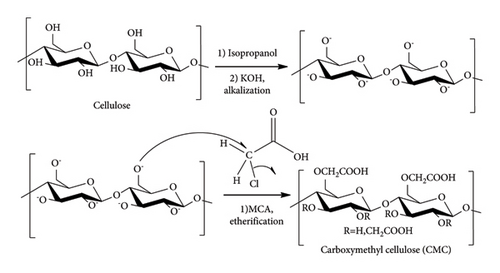
Alkalization and etherification were the methods used to synthesize CMC from isolated cellulose. Alkalization is used to ionize the cellulose OH group of cellulose to Cellu-O-K+. The Cellu-O-, which acts as a nucleophile, reacts with the electrophile MCA by substitution reaction, and hence, the chlorine in the MCA is substituted by Cellu-O-. This gives carboxylated cellulose called CMC. The full mechanism is depicted in Figure 3. Chemically, CMC is a polymer of anionic cellulose derivative in which hydrogen of the hydroxide part of cellulose is replaced by anionic carboxymethyl group (-CH2-COOH). Unlike cellulose, CMC is water-soluble. Its polymer repeating unit AGU is connected by β −1,4-glycosidic bonds [18].
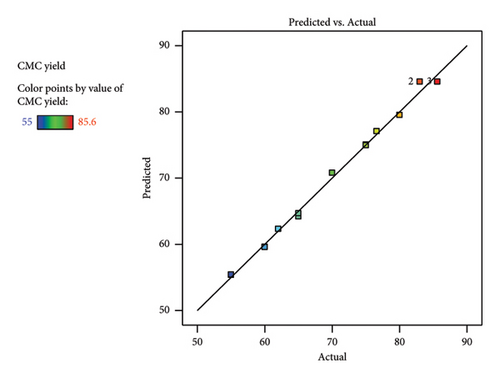
Similarly, the comparison of actual yield vs predicted as per the diagnostic graph (Figure 4(a)) showed there is no big outlier found. Rather, all the maximum and minimum yields are close to each other. This indicates the high degree of similarity between the experimental and calculated predicted yields by the RSM. The 3D plot (Figures 4(b), 4(c), and 4(d)) obtained from RSM analysis showed the multifactor interactions with respect to the synthesized CMC yield. Generally, in all factor interactions, which means etherification vs. alkalization (Figure 4(b)), temperature vs. alkalization (Figure 4(c)), and temperature vs. etherification (Figure 4(d)), the maximum CMC yield was obtained at the red color point of the 3D plot. This indicates the maximum yield was obtained at the middle value of each factor. This concludes that 1 gm (0.006 mol AGU) of cellulose should react with 1 gm (0.019 mol) of KOH (3.24 mol/AGU) and 1 gm (0.012 mol) of MCA (2.05 mol/AGU) at 60°C with a total reaction time of 2 h to get a maximum yield of 85.6%. This finding gives us a clue to run a systematic selection, especially on the DS and viscosity determination, on characterizing the CMC synthesized. Similarly, the method was found to be valid because the maximum actual yield (85.6%) and the predicted (84.56%) values are very close to each other. Similarly, the adequate precision value (30.7) obtained indicates the method is precise. The yield (85.6%) obtained in this research is also in a good range with a study conducted by [19], in which they found a yield of 91.5% CMC from the halophytic plant Salicornia brachiata. Similarly, a similar CMC yield was obtained from the weed Mimosa pigra [20]. The synthesis of commercial CMC from cellulose was started in Germany in 1920 [18]. However, still now it continues with different sources of cellulose. Until now, it was possible to synthesize CMC from Mimosa pigra [21], Durian rind [22], Juncus plant stem [23], Mulberry paper waste [21], and so on. It is not only the different sources of cellulose that are still now under study for CMC synthesis. Rather, the synthesis method is getting guided or modified by the use of RSM. For instance, the following research was performed with the aid of RSM from cacao shell [24], bagasse [25], cocoa pod husks [26], and corn peel [27]. In particular, the RSM result of CMC synthesized from the bagasse [25] was found to be similar to this research. This includes the temperature (56°C), reaction time (150 min), 3D plot, and the viscosity (243 cP) they found, which was similar to this research.
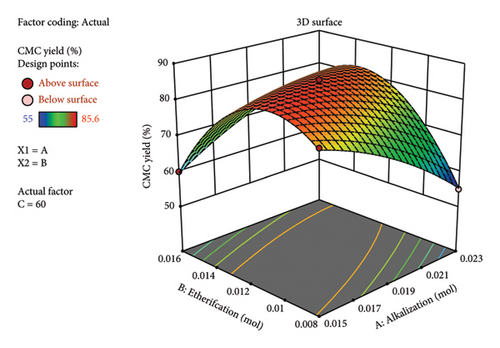
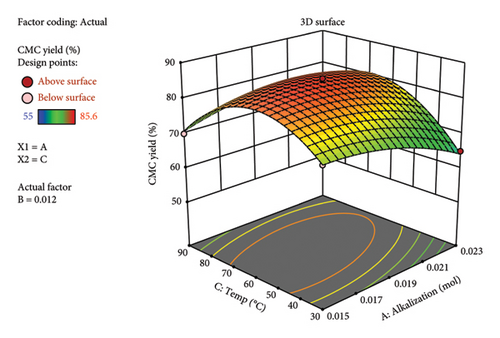
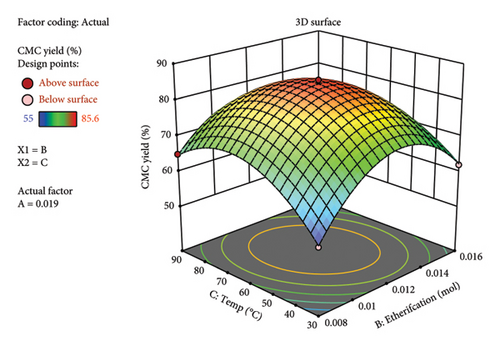
This means that if the KOH is found in excess, it may react directly with the added MCA before the etherification reaction (reaction between “oxide cellulose” and MCA) happens. Hence, potassium glycolate is formed, which is a liquid by-product material and hence reduces the yield.
3.3. Characterization of CMC
3.3.1. Apparent Viscosity, DS, and Purity
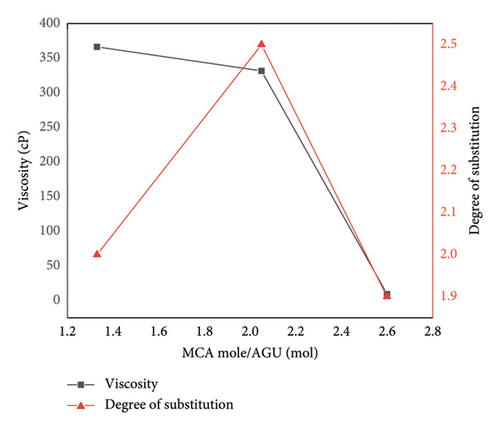
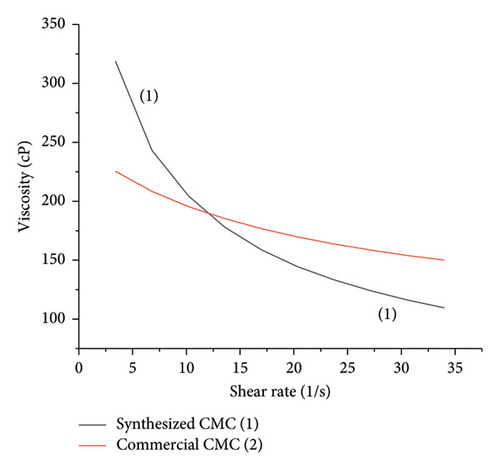
Rheology or viscosity and DS are the two crucial properties of any synthesized CMC. Viscosity and DS determine the solubility, emulsion ability, and thickening effect; hence, these parameters are used to classify the synthesized CMC for the intended applications. The apparent viscosity at a fixed shear rate (3.4 s−1) determined by rheometer indicates the CMC synthesized at 2.5 mol of KOH/AGU and 1.33 mol of MCA/AGU (366 cP), and 3.24 mol of KOH/AGU and 2.05 mol MCA/AGU (331 cP), and is higher and close to the commercial CMC viscosity (227 cP) determined (Table 3 and Figure 5). However, the CMC synthesized by a much higher mole of KOH/AGU (3.8) and MCA/AGU (2.6) than the cellulose mole used gives a very low viscosity (9 cP). This result supports the RSM analysis because the RSM analysis indicates the maximum yield was obtained when 2.5 mol of KOH/AGU and 1.33 mol of MCA/AGU (366 cP) and 3.24 mol of KOH/AGU and 2.05 mol MCA/AGU (331 cP) react with 6 mol of AGU cellulose, which is 80% and 85.6% of CMC yield, respectively. Similarly, the DS determined by the standard method (ASTM, 2005) indicates a similar result. It means when 2.5 mol of KOH/AGU and 1.33 mol of MCA/AGU (366 cP) and 3.24 mol of KOH/AGU and 2.05 mol MCA/AGU (331 cP) are used to prepare the CMC, the DS became 2.1 and 2.5, respectively. More importantly, the DS of 2.5 of the CMC synthesized by 3.24 mol of KOH/AGU and 2.05 mol MCA/AGU (331 cP) showed much closer DS with respect to the commercial CMC (2.9) (Table 3 and Figure 5). Generally, both degrees of substitution and viscosity increase when using MCA mole/AGU of 1.33 to 2.05 and suddenly decrease when using 2.6 mol of MCA/AGU (Figure 5). This indicates that based on the RSM analysis and DS and viscosity analysis, the optimum reaction condition to achieve good yield and high quality of CMC was when 1 gm or 6 mol AGU cellulose reacts with 1 gm or 3.24 mol of KOH/AGU and 1.1 gm of 2.05 mol MCA/AGU. The DS obtained at the optimized point (2.5) was also in reasonable agreement obtained by a study conducted on corn husks [28], in which they found a DS of 2.41. The DS value of CMC mostly lies between 0 and 3. As mentioned previously, the solubility is determined by DS. Hence, a study by [18] showed that although a CMC with a DS below 0.4 is completely insoluble or swellable, a CMC with a DS above 0.4 is soluble. Therefore, our synthesized CMC is water-soluble; hence, it can be used in any industry for different applications. Similarly, this research also showed that it is possible to tune polymeric cellulose insolubility by changing it to polymeric CMC, which is more soluble than the starting polymeric cellulose material. Similarly, the CMC was synthesized under optimized conditions, and the commercial CMC showed a non-Newtonian pseudoplastic fluid behavior. This is because both these materials’ viscosity decreases as the shear rate increases from 3.4 to 34 s−1 (Figure 6). The purity test was carried out on the synthesized CMC and the commercial CMC. The synthesized CMC was optimized and had a comparable DS with the commercial CMC. Although the optimized synthesized CMC was slightly purer than the commercial CMC, like the viscosity and not the DS result, the purity of the synthesized CMC and commercial CMC was comparable. The purity determination performed via ASTM methods showed that the synthesized CMC showed 91.76% ± 0.2 purity, whereas the commercial CMC showed 87.5% ± 0.1 purity. This result was also in a good range, as the FAO 1922 stated that CMC with the above purity range (mostly > 90%) can be used in cosmetics, food, and beverages [29].
| Viscosity (cP), at 25°C and shear rate of 3.4 s−1 | Degree of substitution | |
|---|---|---|
| CMC synthesized from 0.006 mol AGU of cellulose (1 gm of dry cellulose) and 0.84 gm or 0.015 mol of KOH (2.5 mol of KOH/AGU), 0.75 gm or 0.008 mol of MCA (1.33 mol of MCA/AGU), at 60°C | 366.39 ± 0.56 | 2.1 ± 0.01 |
| CMC synthesized from 0.006 mol AGU of cellulose (1 gm of dry cellulose) and 1 gm or 0.019 mol of KOH (3.24 mol of KOH/AGU), 1.1 gm or 0.012 mol of MCA (2.05 mol of MCA/AGU), at 60°C | 331.64 ± 0.68 | 2.5 ± 0.02 |
| CMC synthesized from 0.006 mol AGU of cellulose (1 gm of dry cellulose) and 1.2 gm or 0.023 mol of KOH (3.8 mol of KOH/AGU), 1.5 gm or 0.016 mol of MCA (2.6 mol of MCA/AGU), at 60°C | 9.26 ± 0.6 | 1.9 ± 0.01 |
| For comparison, commercial carboxymethyl cellulose, sodium salt | 227.08 ± 0.3 | 2.9 ± 0.02 |
3.3.2. FTIR Analysis
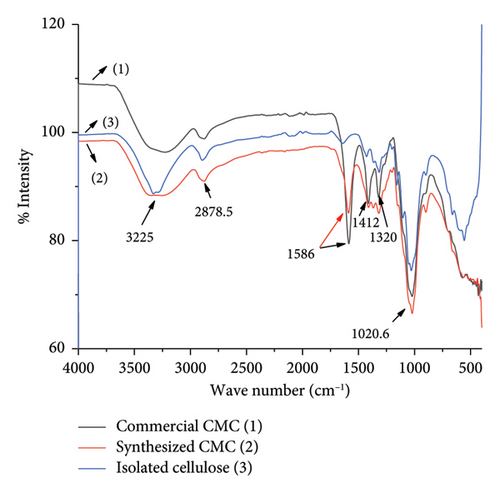
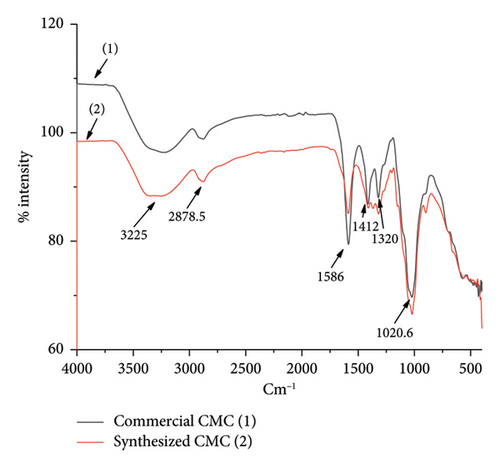
The heterogeneous reaction effect, or the conversion of isolated cellulose to CMC, was monitored by FTIR spectroscopy. Similarly, FTIR spectrum comparison between synthesized CMC and commercial CMC was also investigated in this research. The FTIR spectrum (Figure 7) indicates that although the intensity of the peaks was different, the isolated cellulose, synthesized CMC, and commercial CMC have five identical peaks found in both the isolated cellulose and the CMC in total. Each peak accounts for hydroxyl–OH stretching at 3225 cm−1, C–H stretching vibration (2878.5 cm−1), hydrocarbon–CH2 scissoring at 1300–1450 cm−1, C–O–C ether starching found in the main chain of the cellulose and CMC. However, the carbonyl -C=O stretching at 1586 cm−1 was almost only found in a very high intensity in the commercial CMC and synthesized CMC. This indicates the cellulose conversion to CMC was achieved greatly. For a clear comparison between the commercial CMC and the synthesized CMC (Figure 8), the FTIR spectrum of commercial CMC and synthesized CMC was constructed separately. The figure shows how similar the synthesized CMC was to the commercial CMC. The same FTIR peak with a small value difference was found in a study conducted on CMC synthesis from the plant Asparagus Stalk end [11].
3.3.3. XRD Analysis
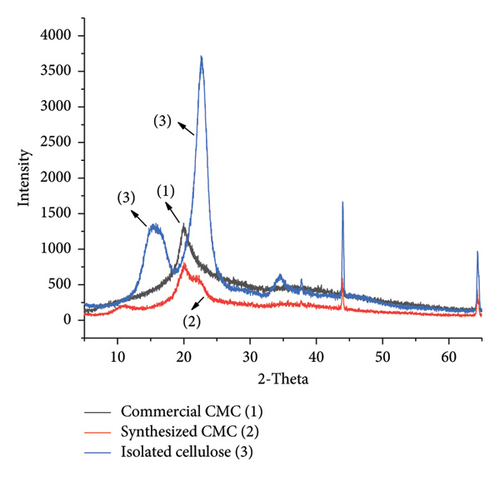
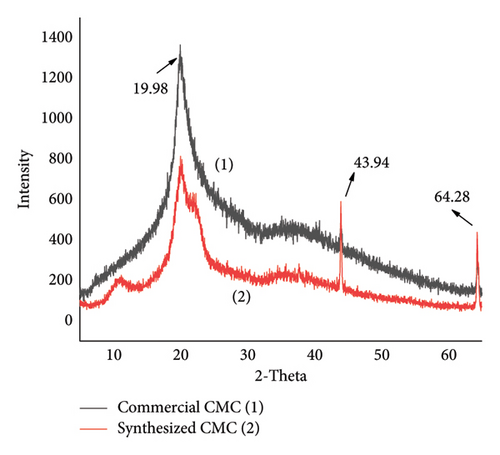
The crystalline nature of isolated cellulose, synthesized CMC, and commercial cellulose was compared in Figure 9, which presents an XRD 2-theta versus intensity graph. This indicates that the isolated cellulose was more crystalline than both commercial CMC and synthesized CMC. This is because the commercial CMC and synthesized CMC lost more hydrogen bonds than the isolated cellulose. Of course, even if there may be a chance of hydrogen bond formation between the hydroxide of carboxymethyl of CMC, it makes a large separation between the main cellulose polymer chains, and hence, the crystallinity decreases. In Figure 9, the shift in the XRD peak from isolated cellulose to the CMC was attributed to the nature of cellulose. Although cellulose I was found in the isolated cellulose, cellulose II was found in the main chain of the CMC. This is because 6% KOH was used to isolate the cellulose from the weed and 20% KOH was used to synthesize the CMC during alkalization. The same XRD peak and shift were also found in a study conducted by [30]. The other XRD graph (Figure 10) shows that similar crystallinity existed between the commercial CMC and the synthesized CMC. However, the commercial CMC crystallinity was more intense than the synthesized CMC. Similarly, the calculated CI of synthesized CMC (29.6) and commercial CMC (27.02) was much lower than isolated cellulose (78%).
3.3.4. SEM Analysis
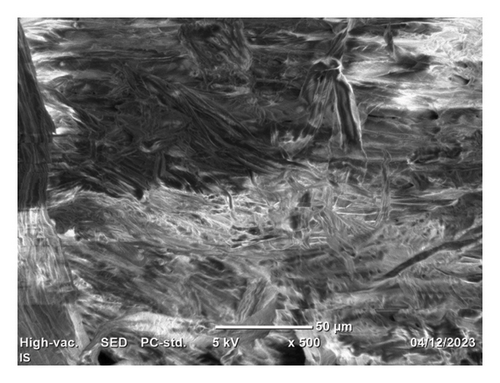
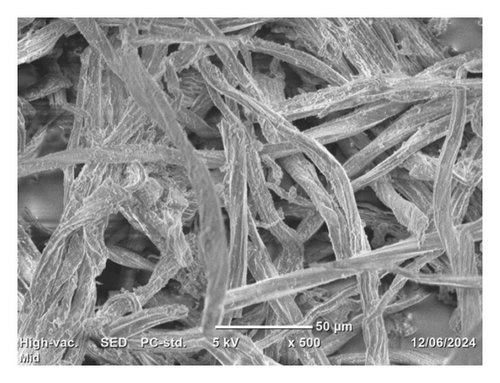
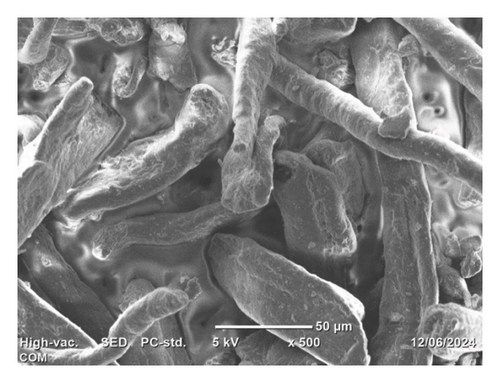
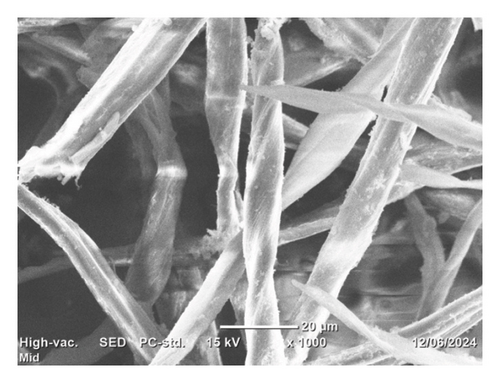
The SEM top morphology images of the isolated cellulose, commercial CMC, and synthesized CMC are depicted in Figure 11. It indicates that although the isolated cellulose (Figure 11(a)) looks like loose thin film-like fiber, the synthesized CMC (Figure 11(b)) and commercial CMC (Figure 11(c)) look like a thick bundle of fiber. This indicates the reaction takes place on the isolated cellulose fiber and is converted to CMC. The slight morphology difference observed between synthesized CMC and commercial CMC was due to pulverization. The commercial CMC was completely pulverized, whereas the synthesized CMC was not. The other figures, Figures 11(d) and 11(e), showed similar morphology between the synthesized CMC and the commercial CMC, respectively. However, these images were taken at 20 μm and 15 kv, whereas the other images were taken at 50 μm and 5 kv. A study by [31] found similar SEM images of CMC synthesized from cotton waste. However, they found the DS (0.87) much lower than the CMC synthesized in this research (2.5).

3.3.5. Thermal Stability Analysis (TGA/DTA)
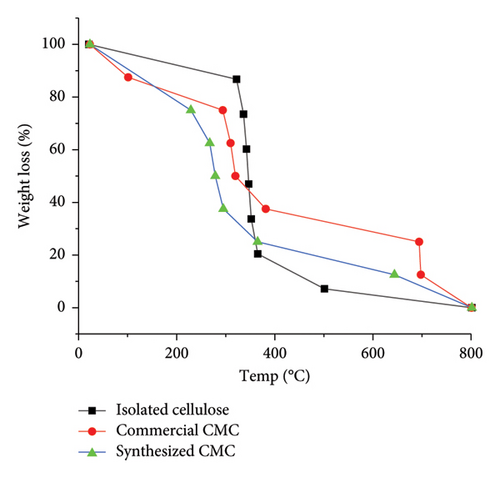
The effect of the alkalization and etherification method on the isolated cellulose, commercial CMC, and synthesized CMC was thermally investigated using TGA (Figure 12). It indicates that although the molecular weight of synthesized CMC and commercial CMC is a bit higher than the isolated cellulose, the isolated cellulose was initially more thermally stable up to 322°C. This is because the isolated cellulose has more hydrogen bonds, which makes the isolated cellulose more thermally stable. However, after 365.38°C the isolated cellulose became thermally less stable than the two types of CMC. Similarly, the commercial CMC was initially thermally less stable than the synthesized CMC. It means the commercial CMC loses its 1 mg or 12.5% weight loss at a much lower temperature (101.16°C) than the synthesized CMC (228.84°C). This is because, logically, the commercial CMC may have a lower number of hydrogen bonds. This logic was also supported by the higher DS value (2.9) of the commercial CMC than the synthesized CMC (2.5). Additionally, after 365°C and up to 800°C, the commercial CMC, then the synthesized CMC, was more thermally stable than isolated cellulose. This is because the commercial CMC has more carboxymethyl substituted CMC than the synthesized CMC and the isolated cellulose has no substituted carboxymethyl. Generally, Figure 12 indicates that although the commercial CMC was thermally stable at 381.63, the synthesized CMC was thermally stable at 365.03°C. Similarly, all the isolated cellulose, commercial CMC, and synthesized CMC could resist heat up to 800°C. Despite the nature of the weed being different, a study performed on CMC synthesis from seaweed cellulose also shows a similar thermal stability to the CMC around 385°C [32]. The other method used for thermal stability comparison between the commercial CMC and the synthesized CMC was DTA. The DTA graph (Figure 13) showed that the moisture content of commercial CMC was a bit higher than the synthesized CMC. This is because in Figure 13 the first and the only endothermic peak occurred around 75–77°C, indicating both the commercial CMC and the synthesized CMC undergo endothermic heat change. Similarly, Figure 13 shows there are only two exothermic peaks. These peaks indicate that the synthesized CMC quickly decomposes with a smaller temperature difference than the commercial CMC. This is because the synthesized CMC molecular weight, which has a lower DS than the commercial CMC, was slightly lower than the commercial CMC. The two exothermic peaks appeared from 216°C–409°C and 584°C–641°C and 250°C–411°C and 669.51°C–710°C for synthesized CMC and commercial CMC, respectively. A CMC synthesized from coir fiber also showed similar exothermic peaks [33].

4. Conclusion
This research successfully and significantly achieved the conversion of nonusable invasive weed Senna didymobotrya cellulose to the industrial chemical called CMC.
The methods used to synthesize CMC from the weed cellulose were alkalization and etherification. These methods were guided by RSM. The RSM method indicates that the maximum CMC yield obtained, 0.85 gm or 85.6%, was achieved when 1 gm or 6 mol AGU cellulose reacts with 1 gm or 3.24 mol of KOH/AGU and 1.1 gm or 2.05 mol MCA/AGU at 60°C with a total reaction time of 2 h. This finding opens a new avenue for saving waste of chemicals while producing industrial chemicals. The RSM analysis also indicates that the method was significant and valid. This is because the factors and factor interactions used in this method were significant (p < 0.05) and the method was precise because the adequate precision (30.7) found was much higher than the expected precision value of 4. The factors used were alkalization, etherification, and temperature. The DS of synthesized CMC was 2.5 and comparable with the commercial CMC (2.9). The viscosity measurement of the synthesized CMC and commercial CMC indicates that both materials showed non-Newtonian pseudoplastic behavior. This means that the viscosity decreases with an increased shear rate. The viscosity of the synthesized CMC was 331.64 cP and the commercial CMC was 227.08 cP. This indicates that the synthesized CMC was a bit more viscous than the commercial CMC. Hence, the synthesized CMC could be used as a good thickener in different factories. Similarly, the purity of the synthesized CMC (91.76%) was slightly higher than the commercial CMC (87.5%). The FTIR, XRD peaks, and SEM images indicate that the CMC was synthesized from the isolated cellulose. The TGA/DTA analysis also indicates the CMC was thermally stable up to 380°C and exhibited heat resistance up to 800°C. Therefore, the two simplest, not time- and energy-taking, methods used and their characterization results with respect to commercial CMC indicate our synthesized CMC from the weed Senna didymobotrya cellulose can be extended to large-scale production of CMC and marketed locally and worldwide to fulfill the tremendously growing need and consumption of CMC.
Conflicts of Interest
The authors declare no conflicts of interest.
Funding
No funding was received for this research.
Acknowledgments
We thank Addis Ababa Science and Technology University for providing the lab facilities.
Open Research
Data Availability Statement
The data that support the findings of this study are available on request from the corresponding author. The data are not publicly available due to privacy or ethical restrictions.


