Acetazolamide-Loaded Poly(δ-Decalactone) Nanoemulsion for Topical Eye Delivery: Enhanced Corneal Permeation and Sustained Intraocular Pressure Reduction in Glaucoma Therapy
Abstract
Glaucoma is a neurodegenerative ocular disease characterized by an elevated intraocular pressure (IOP) resulting from impaired aqueous humor outflow, leading to optic nerve damage and potential vision loss. Acetazolamide (ACZ), a carbonic anhydrase inhibitor, is a clinically established diuretic in glaucoma management. The Biopharmaceutics Classification System (BCS) categorizes drugs by their aqueous solubility and intestinal permeability. ACZ, a BCS Class IV drug, exhibits both poor solubility and poor permeability, typically resulting in low oral bioavailability. This investigation focused on developing an ACZ-loaded nanoemulsion (ACZ-NE) utilizing biodegradable oily polymer poly(δ-decalactone) (PDL) to enhance the drug’s solubility, permeability, and therapeutic efficacy. The formulation was optimized via Box–Behnken design and prepared using the nanoprecipitation method. The resultant nanoemulsions (NEs) exhibited favorable ophthalmic characteristics, including a mean droplet size of 238.5 nm, with a narrow polydispersity index, i.e., 0.107, and negative zeta potential (-−11.9 mV). In vitro release studies demonstrated sustained drug release for up to 14 h, prolonging the therapeutic impact and reducing the need for frequent administration. Ex vivo corneal permeation was significantly enhanced in ACZ-NE compared to an aqueous drug suspension, indicating enhanced transcorneal permeation ability of NE. In addition, the NE demonstrated ocular safety in the Draize test and effectively reduced IOP for up to 12 h in experimental rabbits. In vivo pharmacokinetic evaluation from the ocular route revealed a prolonged half-life (1.92 h), increased Cmax (0.083 μg/mL), and AUC0−∞ (1360.32 μg·h/mL) relative to the marketed formulation. Histopathological examination confirmed improved ocular tissue integrity following treatment with the developed NE. These findings collectively suggest that the PDL-based ACZ-NE not only offers a promising strategy for sustained ocular drug delivery but also has the potential to mitigate the systemic adverse effects associated with conventional oral therapy of ACZ tablets, thereby instilling confidence in its potential to improve patient outcomes.
1. Introduction
Glaucoma is one of the primary causes of irreversible blindness worldwide, posing a significant public health concern, with millions affected globally. Characterized by progressive optic nerve damage, the primary contributor to this condition is elevated intraocular pressure (IOP), resulting from an imbalance in the production and drainage of aqueous humor. Projections indicate that by 2040, approximately 111.8 million individuals will be impacted by glaucoma, emphasizing the urgent need for effective management and therapeutic strategies [1]. Current pharmacological interventions are aimed at enhancing aqueous humor outflow or reducing its production, which is critical in managing the disease’s progression [2]. However, these treatments often face challenges such as poor bioavailability, frequent dosing requirements, and systemic side effects, which limit their efficacy and patient compliance.
Acetazolamide (ACZ), a widely used oral carbonic anhydrase inhibitor (CAI), effectively reduces IOP by about 30%. However, its systemic use often causes off-target inhibition, leading to side effects such as diuresis, fatigue, and gastrointestinal disturbances [3]. In addition, ACZ’s low solubility and poor permeability limit its suitability for oral and topical formulations [4, 5]. While topical delivery may reduce side effects by targeting the eye directly, it faces significant barriers from the eye’s defenses, such as low corneal adherence and tear production, which reduce the bioavailability and require frequent dosing. Prolonged topical use may also cause adverse effects such as dry eye and allergic conjunctivitis. These challenges hinder ACZ’s effectiveness in delivering sufficient drug levels to the target, i.e., the ciliary body [6].
Given these challenges, research has focused on enhancing the ocular bioavailability of ACZ to create a more effective topical treatment. Innovative delivery platforms, particularly nano- and micropharmaceutical systems, promise to overcome these barriers by improving drug solubility, penetration, and therapeutic outcomes for glaucoma management [7, 8]. ACZ delivery has been successfully achieved through various nanocarrier systems. These include nanoemulsions (NEs) with olive oil and Tween-20 [9], nanovesicle-hydrogel systems [10], cubosomes [11], nanocrystals [12], and transgelosomes with different edge activators [13]. Among these, NEs have shown promise as effective carriers, offering enhanced drug solubility, corneal penetration, and ocular bioavailability [14].
However, these systems often lack the stability and sustained release profiles for optimal therapeutic outcomes. Moreover, the variability in natural oil-based NEs can lead to inconsistent drug release and reduced shelf life [15–17]. The need for a stable, biocompatible, and effective topical delivery system for ACZ remains unmet, particularly one that can achieve sustained IOP reduction while minimizing dosing frequency and systemic side effects. Our study addresses this gap by developing a poly(δ-decalactone) (PDL)-based NE that combines enhanced stability with prolonged IOP reduction, offering a novel and comprehensive approach to glaucoma therapy.
Nowadays, novel glaucoma therapies are significantly advancing beyond traditional treatments, emphasizing improved efficacy, patient convenience, and new therapeutic targets. Key existing innovations include the repositioning of selective laser trabeculoplasty as a highly effective first-line treatment, outperforming eye drops in some studies [18]. Recent advancements in nanotechnology have further expanded the scope of ocular drug delivery for glaucoma [7, 19, 20]. For instance, Dubey et al. developed brinzolamide-loaded chitosan nanoparticles, achieving sustained IOP reduction in rabbits for up to 24 h, though the study noted challenges with long-term stability and potential cytotoxicity of chitosan [21]. Similarly, Guo et al. explored a novel NE for the co-delivery of latanoprost and α-tocopherol to address retinal cell damage in glaucoma, demonstrating significant reductions in ROS accumulation, retinal ganglion cell (RGC) apoptosis, and inflammatory cell infiltration, thereby offering neuroprotection beyond mere IOP-lowering [22]. Similarly, Sánchez-López et al. investigated topical memantine-loaded PLGA-PEG nanoparticles to address RGC loss in glaucoma, demonstrating significant neuroprotection and a reduction in RGC loss in a rodent model of ocular hypertension [23]. While these studies highlight the potential of nanotechnology, they often focus on single therapeutic mechanisms (e.g., IOP reduction or neuroprotection) and face limitations in stability, combination therapy, or clinical translation.
Bansal and others introduced an eco-friendly method for synthesizing novel polymeric materials for biomedical applications, utilizing sustainable feedstocks. They used δ-decalactone, a renewable, nontoxic, and cost-effective monomer derived from the plant Cryptocarya massoia, to produce high-molecular-weight PDL [24]. This biocompatible and degradable polymer exhibits inherent hydrophobicity and viscosity, making it an excellent candidate for formulating stable NEs for ocular drug delivery [24, 25]. Unlike natural oils, which are susceptible to rancidity and Ostwald ripening, PDL enhances drug solubility and permeability while minimizing these stability issues [26–28], as demonstrated by its superior performance in delivering antifungal agents such as ketoconazole and eugenol [29]. PDL’s safety is well-established through hemolysis and biocompatibility studies, further supporting its potential for glaucoma treatment [24]. In addition, the use of Pluronic® F68 (Pluronic F68), a nonionic, FDA-approved surfactant with an optimal hydrophilic–lipophilic balance (HLB), ensures formulation stability and safety, making it ideal for ophthalmic applications where these properties are critical [25, 30].
Our present research distinguishes itself from existing literature primarily through the implementation of the oily polymer PDL, a material not previously documented in glaucoma-related formulations. While prior studies have developed ACZ-loaded NE employing natural oils as the dispersed phase, these oils are susceptible to rancidity and Ostwald ripening, issues that PDL inherently mitigates. This study seeks to formulate and refine a novel PDL-based NE for delivering ACZ topically in glaucoma treatment, employing a quality by design (QbD) strategy. The research thoroughly assesses various physicochemical characteristics such as particle size, polydispersity index (PDI), and drug loading capacity, along with stability and therapeutic effectiveness via detailed in vitro, ex vivo, and in vivo evaluations. The assessments of drug release kinetics, ocular toxicity, penetration, and efficacy aim to provide a more effective and patient-friendly alternative to existing glaucoma therapies, overcoming the drawbacks encountered in systemic and current topical ACZ delivery methods. By leveraging the distinctive attributes of PDL alongside systematic QbD optimization, this work presents a stable and effective solution that differentiates itself from earlier studies through its comprehensive strategy and potential for clinical application.
2. Materials and Methods
2.1. Materials
ACZ and Pluronic F68 were purchased from Sigma-Aldrich. PDL (see Supporting Figure S1) was a kind gift from Bansal et al., which was synthesized using a reported procedure [31] by utilizing benzyl alcohol as an initiator. Acetone and all other analytical-grade chemicals were purchased from CDH, Mumbai, India.
2.2. Formulation Optimization
A statistically robust Box–Behnken design (BBD) within the response surface methodology (RSM) framework was employed to design the PDL-based ACZ-loaded NE (ACZ-NE). BBD utilizes a strategically chosen combination of three-factor levels (−1, 0, +1) to minimize experimental runs (15 in this case) compared to a full factorial design. This approach focuses on the central region, reducing the influence of corner points and improving model prediction. The software, factorial Design-Expert-10, facilitated the design generation. BBD evaluates not only the individual effects of independent variables (surfactant concentration, PDL concentration, and stirring time) on the desired responses (globule size, PDI, and % encapsulation efficiency [%EE]) but also captures potential interaction effects, enabling the development of a formulation with optimal properties.
| Run | Formulations | Factor 1 A: polymer concentration (% w/v) | Factor 2 B: surfactant (Pluronic F68) concentration (% w/v) | Factor 3 C: stirring speed (rpm) | Response 1: droplet size (nm) | Response 2: PDI | Response 3: %EE |
|---|---|---|---|---|---|---|---|
| 1 | NE 1 | 1.5 | 12 | 1200 | 229.1 | 0.162 | 86 |
| 2 | NE 2 | 1.5 | 10 | 1000 | 248.3 | 0.434 | 84.61 |
| 3 | NE 3 | 1.5 | 8 | 800 | 286.4 | 0.44 | 76 |
| 4 | NE 4 | 1 | 10 | 1200 | 260.2 | 0.372 | 80.1 |
| 5 | NE 5 | 1 | 8 | 1000 | 270 | 0.44 | 74 |
| 6 | NE 6 | 2 | 12 | 1000 | 240 | 0.28 | 85.3 |
| 7 | NE 7 | 1.5 | 8 | 1200 | 257.6 | 0.436 | 77.3 |
| 8 | NE 8 | 2 | 10 | 800 | 287.7 | 0.487 | 81.7 |
| 9 | NE 9 | 1.5 | 12 | 800 | 255.8 | 0.458 | 78.9 |
| 10 | NE 10 | 1.5 | 10 | 1000 | 248.5 | 0.431 | 84.5 |
| 11 | NE 11 | 2 | 10 | 1200 | 248 | 0.19 | 83.6 |
| 12 | NE 12 | 1 | 12 | 1000 | 255 | 0.381 | 76.5 |
| 13 | NE 13 | 1 | 10 | 800 | 276.8 | 0.363 | 74.5 |
| 14 | NE 14 | 2 | 8 | 1000 | 284 | 0.481 | 76 |
| 15 | NE 15 | 1.5 | 10 | 1000 | 248 | 0.43 | 84.7 |
To ensure the robustness of the statistical analysis and conclusions, each experimental run within the design space was performed in triplicate (n = 3). Subsequently, the statistically identified optimal formulation, characterized by the specific combination of variable settings, was validated through triplicate (n = 3) independent production runs, both with and without the drug substance. This replication step verifies the formulation’s reproducibility and predicted responses under optimal conditions [32]. Table 2 details the independent and dependent variables employed in the BBD, along with their respective levels and identified constraints.
| Factors (independent variables) | Levels | ||
|---|---|---|---|
| Low (−1) | Medium (0) | High (+1) | |
| Factor A: polymer conc. (%) | 1 | 1.5 | 2 |
| Factor B: surfactant conc. (%) | 8 | 10 | 12 |
| Factor C: stirring speed (rpm) | 800 | 1000 | 1200 |
| Responses (dependent variables) | Constraints | ||
| Response 1: droplet size (nm) | Minimum | ||
| Response 2: PDI | Minimum | ||
| Response 3: %EE | Maximum | ||
2.3. Method of Preparation
The nanoprecipitation method was employed to prepare ACZ-NE, using PDL and the drug in acetone as the oil phase, while Pluronic F68 (as a surfactant) in Milli-Q water served as the aqueous phase. The oil phase was added dropwise to the aqueous phase and stirred on a magnetic stirrer for 3 h. PDL is utilized as the oil without preparing a ternary phase diagram for NE [24]. The optimal PDL and Pluronic F68 concentrations for the final ACZ-NE formulation were determined using an RSM approach, and the selected concentrations are detailed in Section 3.1.1.
2.4. Characterization of the ACZ-NE
2.4.1. Visual Assessment
A vital part of our research involves visually assessing the ACZ-NE’s color, clarity, homogeneity, and phase separation in daylight against white and black backgrounds. This evaluation guarantees the emulsion’s consistency and stability by monitoring for color uniformity and the absence of clear oil or water layers. Visual indicators of instability may suggest issues with uniformity or stability, which are essential for the effectiveness of ACZ-NE formulations.
2.4.2. Fourier Transform Infrared Spectroscopy (FTIR)
FTIR spectroscopy assessed interactions between ACZ and excipients in formulations. IR spectra of ACZ, PDL, Pluronic F68, a physical mixture, and ACZ-NE were obtained with an FTIR spectrophotometer. Powdered materials were analyzed using a Shimadzu 1700 from Japan, employing the potassium bromide (KBr) pellet method; liquid samples were assessed with a PerkinElmer FTIR instrument using the attenuated total reflection (ATR) method. A background spectrum was recorded under the same conditions for correction. The scanning range included 4000–400 cm−1.
2.4.3. Droplet Size, PDI, Zeta Potential, and Morphological Analysis (Transmission Electron Microscopy [TEM])
The optimized ACZ-NE was characterized for droplet size, PDI, zeta potential, and morphology to assess its suitability for ocular drug delivery. Droplet size, PDI, and zeta potential were determined using a Malvern Zetasizer Nano ZS at 25°C. Samples were diluted 1:10 (v/v) with Milli-Q water (100 μL of 10 mg/mL NE1 mixed with 900 μL water, achieving a final concentration of 1 mg/mL) to minimize scattering effects. Droplet size and PDI were measured via dynamic light scattering (DLS) in polystyrene cuvettes at a 173° backscatter angle, utilizing a helium–neon laser (633 nm) at an intensity of 105 counts per second; the dispersant refractive index (water) was set to 1.33, and the material refractive index (PDL) was 1.48. PDI was calculated for size distribution uniformity, targeting values ≤ 0.2 for monodispersity. Zeta potential was measured using electrophoretic light scattering (ELS) in folded capillary cells with water as the diluent, applying the Smoluchowski approximation at a field strength of 20 V/cm to evaluate stability; negative zeta potential indicates electrostatic repulsion. All measurements were performed in triplicate.
Morphological analysis used a Tecnai G2 30 S-TWIN TEM (FEI Co., USA) at 200 kV. A 20-μL droplet of diluted NE1 was placed on a 200 mesh copper grid for 10 min. Excess liquid was removed, and the grid was stained with a drop of 2% phosphotungstic acid for contrast enhancement before air-drying. The stained grid was imaged to visualize the nanostructure.
2.4.4. pH and Viscosity Analysis
The pH and viscosity of optimized ACZ-NE were evaluated for ocular compatibility and patient comfort. pH was measured at 25°C with a LABMAN LMPH10 pH meter (LABMAN Scientific Instruments, India), targeting 7.2 ± 0.2 to align with tear fluid pH and minimize irritation (result: 7.18 ± 0.05, n = 3). Viscosity was assessed at 25°C using a Brookfield Rheometer (AMETEK, LV-1, spindle no. 61), aiming for below 20 mPa·s for easy instillation and spreading (result: 15.6 ± 0.8 mPa·s, n = 3). Measurements were conducted in triplicate for reproducibility.
2.4.5. %EE
2.4.6. In Vitro Drug Release
Franz diffusion cells, commonly used in pharmaceutical research for mimicking biological membranes, were evaluated for ACZ release from ACZ-NE. The cells had an orifice area of 1 cm2 and a 10 mL receptor volume. Cellulose membranes with a 12,000 Dalton molecular weight cutoff were prehydrated in double-distilled water for 24 h at 25°C. After hydration, the membrane was placed between the donor and receptor compartments. An ACZ-NE sample (2 mL) was added to the donor compartment, while the receptor contained 10 mL of stirred simulated tear fluid (STF) at 200 rpm.
Samples (2 mL) were withdrawn from the receptor compartment at intervals (0.5–14 h) and replaced with fresh STF to maintain sink conditions. ACZ concentration was determined spectrophotometrically at 295 nm. The cumulative percentage of drug released was plotted against time to generate release profiles and compared using ACZ suspension (same drug concentration as ACZ-NE) [34, 35]. The release kinetics of ACZ-NE were assessed with DDSolver software, highlighting our commitment to advanced mathematical modeling and analysis of release data.
2.4.7. Thermodynamic and Accelerated Stability Studies
Comprehensive stress testing protocols were used to evaluate the physical stability of ACZ-NEs systematically. These tests simulate various environmental conditions the formulation might encounter during storage or use and ensure that it remains stable and effective. The protocols included multiple heating–cooling cycles (alternating between 4°C and 40°C for six cycles of 48 h each), freeze-thaw cycles (alternating between −21°C and 25°C for three cycles of 48 h each), and centrifugation analysis (10,000 rpm for 30 min) [36, 37]. The formulations were monitored throughout these stress conditions for any visual indicators of physical instability, particularly phase separation or creaming.
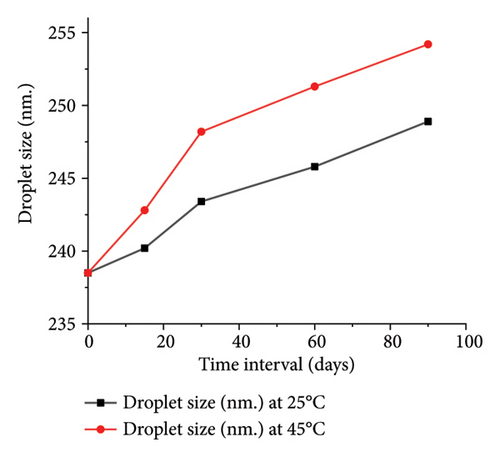
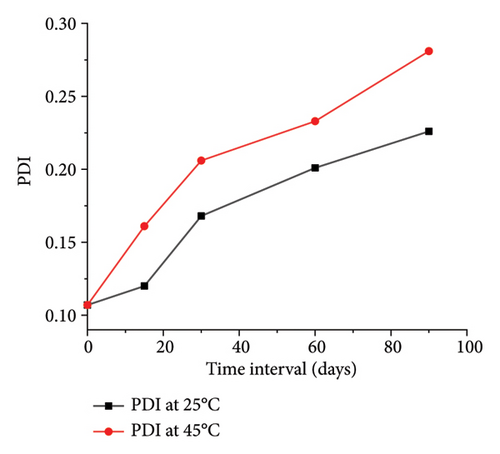
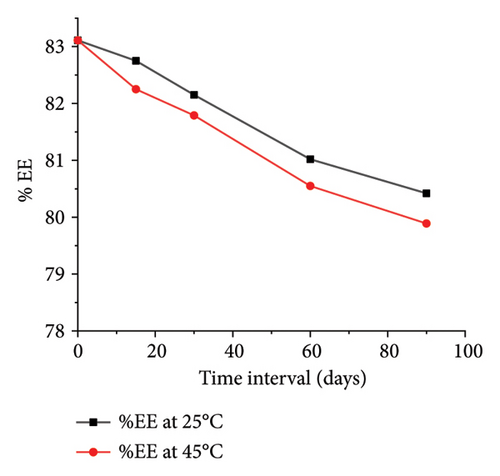
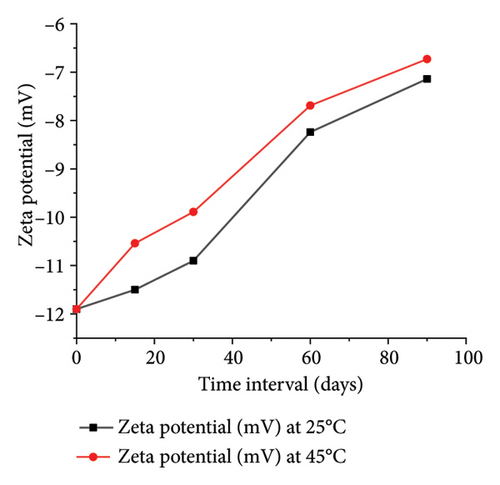
To assess stability under varied environmental conditions, the ACZ-NE was stored at both 45°C and ambient temperature (25.0 ± 0.5°C) for 90 days. At predetermined intervals (0, 15, 30, 60, and 90 days), the NEs’ droplet size, PDI, zeta potential, and %EE were quantitatively determined [38].
2.4.8. Ex Vivo Corneal Permeation Study
The ex vivo drug permeation study was meticulously conducted using goat corneas from a slaughterhouse. The corneas were carefully dissected with a 2–4 mm scleral rim, rinsed, and stored in cold STF (pH 7.4). Franz diffusion cells were employed, with the corneas positioned epithelial-side up in the donor compartment (effective diffusion area: 1 cm2). The receptor compartment, filled with STF (pH 7.4), maintained at 34°C and stirred at 50 rpm, mimicked tear fluid, and the donor compartment was filled with 1 mL of ACZ-NE. Samples were withdrawn from the receptor compartment at predetermined intervals (replaced with fresh STF to maintain volume) over a 4 h study. ACZ concentration in the samples was quantified using UV-spectrophotometry at 295 nm. The mean permeation of three independent experiments (presented with standard deviation [SD]) was plotted against time to calculate relevant permeation parameters [39]. The same procedure was followed for ACZ suspension, and the result was compared with ACZ-NE, providing a valuable comparison for the audience to understand the superiority of ACZ-NE.
2.4.9. Postpermeation Corneal Hydration Assessment
Following the permeation study, goat corneas were carefully dissected to remove residual scleral tissue for both ACZ-NE and ACZ suspension. The wet weight of the cornea was then measured. To evaluate corneal hydration, the corneal tissue was dehydrated by immersion in methanol and dried overnight at 80°C. The final dry weight was measured, and the difference between the initial wet and final dry weights reflects the cornea’s water content (hydration level).
Ex vivo testing of goat corneas helps evaluate drug permeation but does not account for necessary in vivo factors such as tear turnover, blinking, and immune responses that impact NE performance. In vivo studies with rabbits are crucial due to their ocular physiology resembling humans, particularly in corneal thickness (∼0.4-0.5 mm) and tear dynamics. These studies will validate NE retention, penetration, and tolerability while addressing physiological aspects overlooked by ex vivo models. By examining pharmacokinetics, pharmacodynamics, and safety in rabbits, we aim to pave the way for human clinical trials, ensuring our findings are relevant for real-world ocular applications [40].
2.5. Animal Testing
In vivo evaluation was performed on adult male New Zealand albino rabbits (2-3 kg) housed individually with standard diet and water access under controlled temperature and pressure. The animal protocol adhered to OECD guidelines and was approved by the Institutional Animal Ethical Committee, Institute of Pharmacy, Bundelkhand University, Jhansi, with approval no. BU/Pharma/IAEC/A/23/06.
2.5.1. Ocular Tolerability or Ocular Irritancy Test [15]
2.5.1.1. Modified Draize Test (Low Volume Eye Test)
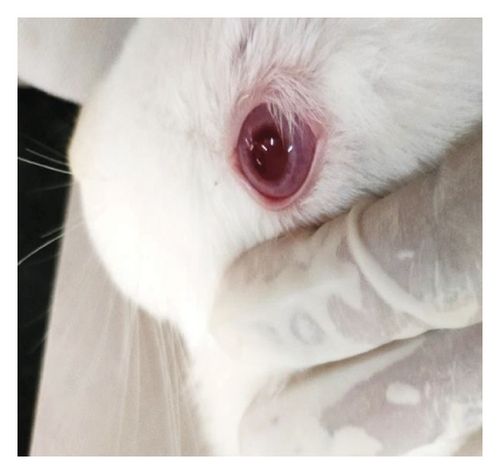
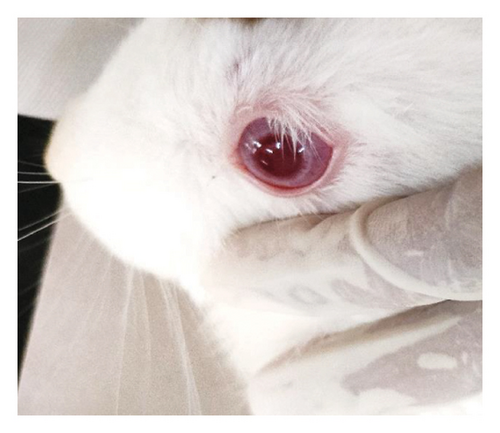
The ocular irritation potential of ACZ-NE was thoroughly evaluated using a modified Draize test on six New Zealand albino rabbits, divided into two groups of three animals each. The study design assigned the right eye as the control and the left eye for test formulation administration. Utilizing sterilized glassware and 0.22 μm filtered formulations, 50 μL of either ACZ-NE (test group) or saline solution (control group) was instilled into the lower eyelid of each test eye. Ocular irritation parameters (redness, discharge, swelling, and lesions) were systematically assessed at 1, 24, 48, and 72 h postadministration using a standardized scoring system ranging from 0 (no irritation) to 4 (severe irritation) (Supporting Table S2). The formulation’s safety was determined based on individual scores and the overall irritation index, where scores of 2 or 3 in any category or a total index exceeding 4 indicated clinically significant irritation [41, 42].
2.5.2. Pharmacodynamic and Pharmacokinetic Evaluations
Using a two-group comparison method, the sustained action of ACZ-NE was evaluated in New Zealand white rabbits. The study design incorporated both normal and experimentally induced ocular hypertension conditions. For baseline measurements, six rabbits were divided into two groups. In the first group, ACZ-NE was applied to the left eyes, with the right eyes serving as untreated controls. The second group received a commercial 1% w/v brinzolamide suspension in the left eyes, with the right eyes serving as controls. IOP was measured with the help of a Schiotz tonometer at baseline, 5 min after application, and 10 min intervals until returning to baseline.
To assess IOP-lowering efficacy under hypertensive conditions, each group underwent a glucose-induced ocular hypertension procedure. Test formulations (50 μL) were instilled twice in treated eyes at 2 h and 30 min before glucose infusion. Ocular hypertension was induced by rapid injection of 5% glucose solution (15 mL/kg body weight) through the marginal ear vein [43, 44]. IOP was measured every 10 min postinfusion until returning to baseline, with each eye undergoing three measurement cycles for average values [45].
Pharmacokinetic studies were conducted on six additional rabbits (n = 3 per group). ACZ-NE or marketed formulation (50 μL) was applied to the left eye. Aqueous humor samples (50 μL) were collected at predetermined intervals (0.5–12 h) using a 28-gauge needle. Samples were centrifuged (15,000 rpm, 15 min), and drug concentrations in the sediment were analyzed spectrophotometrically (Shimadzu UV-1800, Japan). Pharmacokinetic parameters (Cmax and Tmax) were calculated using PK Solver software, employing noncompartmental analysis with the linear trapezoidal method [28, 46].
This comprehensive approach evaluates the formulation’s efficacy, sustained action, and pharmacokinetics compared to a marketed product under normal and hypertensive ocular conditions.
2.5.3. Histopathological Test
A histopathological examination evaluated potential microscopic signs of irritation and tissue abnormalities after administering test formulations. Following in vivo testing and euthanasia, rabbit eyes were enucleated and fixed in Davidson’s solution to prevent tissue degradation. This fixative contained glacial acetic acid (100 mL), ethanol (95%, 300 mL), neutral buffered formalin (10%, 200 mL), and distilled water (300 mL). Eyes were immersed in the fixative after trimming excess tissue, with gauze padding ensuring complete submersion.
After 24 h, the eyes were transferred to a 10% formalin solution for continued preservation. Representative tissue specimens were dissected, washed, and dehydrated using graded alcohols. The dehydrated tissues were cleared with xylene and embedded in paraffin blocks. Sections (4–6 μm thick) were obtained and stained with hematoxylin and eosin (H&E) for light microscopy evaluation [47].
- (i)
Normal control (nonglaucomatous right eye receiving saline in Draize test)
- (ii)
Untreated control (glaucomatous right eye without treatment)
- (iii)
ACZ-NE-treated left eye
- (iv)
Marketed formulation-treated left eye
2.6. Statistical Analysis
Descriptive statistical analysis, including the calculation of mean and SD, was conducted using Microsoft® Excel and OriginPro 2018. Data are presented as mean ± SD unless otherwise noted. Statistical significance was determined using a p value threshold of ≤ 0.05.
3. Results and Discussion
3.1. Formulation Optimization
The developed ACZ-NE formulation was characterized by key response variables: droplet size, PDI, and %EE. The estimated polynomial coefficients for the quadratic models (discussed later) will be utilized to investigate potential statistically significant interactions among these response variables.
3.1.1. Effect of Independent Variables on Droplet Size
Analysis of equation (5) revealed that all independent factors (A, B, and C) had negative coefficients, indicating an inverse relationship with droplet size. Factors B and C exerted a statistically stronger negative influence than A, suggesting they play a more significant role in size reduction. The negative interaction terms AB and AC imply a synergistic effect, where the combination of these factors further reduces droplet size. Although minimal, the positive coefficient for the BC interaction term may suggest a counteracting effect [49]. A 3D surface plot (Figure 1) can visualize these interactions. Consistent with previous reports, increasing oil concentration likely leads to larger droplets.
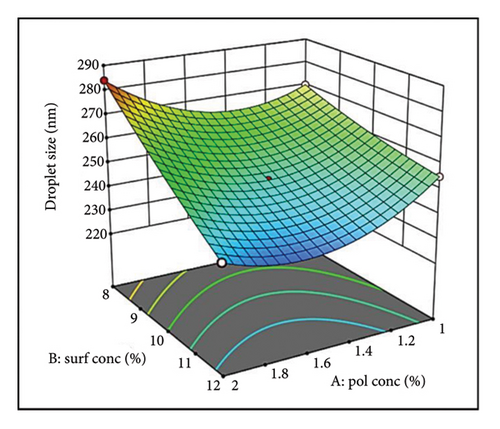
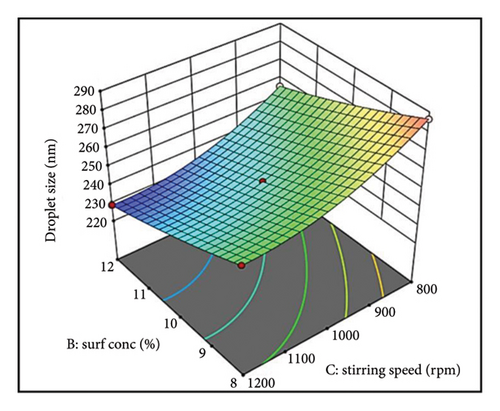
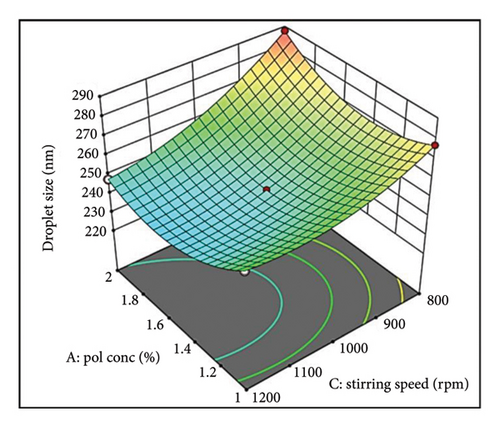
Figure 1(a) reveals a nonlinear relationship between oil (PDL) concentration and droplet size. At lower concentrations, efficient oil dispersion and packing within the aqueous phase led to smaller droplets [50, 51]. However, excessive oil disrupts this arrangement and increases viscosity, hindering emulsification and favoring larger droplets. Surfactant concentration (Figure 1(a)) also exhibits a nonlinear trend. Initially, surfactants reduce interfacial tension and sterically stabilize droplets [52]. However, a potentially high concentration of surfactant can cause coalescence and a slight increase in droplet size [53].
The 3D plot in Figure 1(a) suggests an additive effect between oil (Factor A) and surfactant (Factor B) concentration on droplet size. The impact of oil (Factor A) depends on the surfactant level (Factor B). At low surfactant (Factor B), increasing oil (Factor A) leads to a size increase due to insufficient interfacial coverage [54]. Conversely, a higher surfactant (Factor B) provides adequate coverage even with increasing oil (Factor A), promoting smaller droplets (Supporting Figure S2a).
The parallel curves in Figure 1(b) suggest an additive effect on size between surfactant (Factor B) and stirring speed (Factor C). This implies their effects are independent with no significant interaction. These findings highlight the importance of optimizing oil concentration, surfactant level, and stirring speed for achieving the desired droplet size in NEs [55].
The influence of stirring speed (Factor C) on droplet size was nonlinear (Figure 1(c)). At lower speeds, inadequate shear forces resulted in larger droplets due to inefficient oil phase breakdown. Increasing speed within an optimal range facilitated droplet disruption and size reduction. However, excessive speed compromised the surfactant layer, leading to droplet coalescence and increased sizes. This highlights the necessity of optimizing stirring speed for effective emulsification while maintaining droplet stability [56].
The interaction between polymer concentration (Factor A) and stirring speed (Factor C) was also noteworthy. At lower stirring speeds, an increase in polymer concentration resulted in larger droplets. Conversely, at higher stirring speeds, this increase was less pronounced or even reversed (Supporting Figure S2b). This suggests that optimal stirring speeds can mitigate the size-increasing effect of higher polymer concentrations.
Figure 1(c) illustrates a complex interplay between stirring speed (Factor C) and oil concentration (Factor A) in determining the final droplet size. At lower stirring speeds, insufficient shear forces hinder oil phase disruption, resulting in larger droplets as oil concentration increases. Conversely, a threshold effect emerges at higher speeds, where increased shear effectively breaks down larger oil droplets, promoting smaller sizes. This emphasizes the critical role of stirring speed in controlling droplet size.
The relationship between surfactant concentration (Factor B) and stirring speed (Factor C) appears to be additive (Supporting Figure S2c). This suggests that their effects on droplet size are independent, with no significant interaction observed.
3.1.2. Effect of Independent Variables on PDI
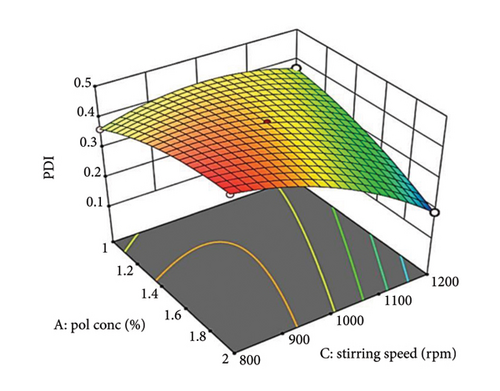
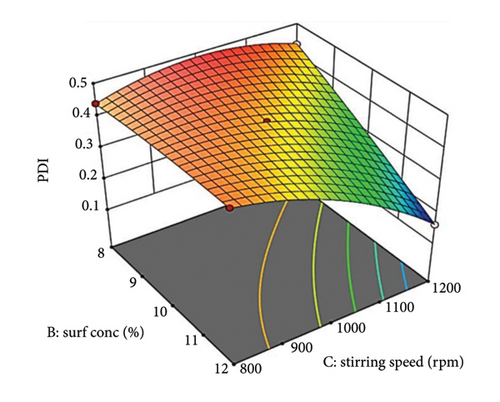
All independent factors, oil concentration (Factor A), surfactant concentration (Factor B), and stirring speed (Factor C), show negative coefficient values (equation (6)), indicating an inverse relationship with droplet size. Factors B and C have more significant negative coefficients, implying a greater effect on reducing PDI than Factor A. The negative coefficients for the interaction terms AB (oil concentration and surfactant concentration) and AC (oil concentration and stirring speed) suggest a synergistic effect in reducing droplet size. The combined impact of these factors is more substantial than their individual effects. However, the positive coefficient for the BC interaction term (surfactant concentration and stirring speed) indicates an antagonistic interaction.
A 3D surface plot (Figures 2(a), 2(b), and 2(c)) demonstrates how Factors A, B, and C influence PDI. In Figure 2(a), a nonlinear relationship is observed between the oily polymer (PDL) concentration and PDI. At low oil concentrations, the oil is effectively dispersed into smaller droplets, leading to a low PDI [57]. However, as the oil concentration rises, increased viscosity and volume cause some droplet fragmentation, resulting in larger droplet sizes and higher PDI. In addition, the enhanced packing efficiency of oil at higher concentrations can obstruct size reduction. This nonlinear curve illustrates the trade-off between better droplet stabilization at lower concentrations and steric hindrance and viscosity challenges at elevated concentrations.
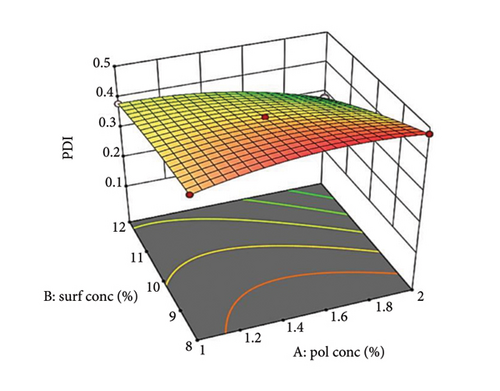
Increasing surfactant concentration typically decreases PDI by reducing interfacial tension and creating a protective steric barrier around droplets. This effect is more significant at optimal surfactant concentrations. At lower concentrations, insufficient surfactant results in less effective stabilization and higher PDI [58].
Supporting Figure S3a illustrates the interaction between oil concentration (Factor A) and surfactant concentration (Factor B) at a constant stirring speed. Increased oil concentrations result in a larger PDI at low surfactant levels due to insufficient surfactant to coat all the droplets, which leads to aggregation. Conversely, at higher surfactant concentrations, PDI decreases as a result of enhanced steric stabilization. The 3D graph (Figure 2(a)) reveals a nonlinear relationship with a steeper slope for surfactant concentration, highlighting its significant impact on PDI.
Figure 2(b) illustrates the relationship between stirring speed and PDI. Low stirring speeds result in high PDI due to insufficient shear forces. Higher stirring speeds decrease PDI by promoting efficient droplet breakdown [59]. However, excessively high speeds can disrupt the steric barrier, causing re-aggregation and larger droplets [60]. Supporting Figure S3b shows that increasing oil concentration raises PDI at low stirring speeds due to insufficient shear force and high viscosity. Sufficient shear force reduces PDI at higher speeds by efficiently breaking down and distributing polymer droplets. The 3D graph (Figure 2(b)) shows a nonlinear interaction, with a steeper slope for stirring speed, highlighting its significant influence on PDI.
Supporting Figure S3c depicts the interaction between surfactant concentration (Factor B) and stirring speed (Factor C) at constant oil concentration (Factor A). Increasing surfactant concentration slightly increases PDI at low stirring speeds due to possible micelle formation [61, 62]. At higher speeds, PDI decreases significantly with increasing surfactant concentration due to improved droplet disruption and steric stabilization. The 3D graph (Figure 2(c)) shows a nonlinear interaction, with a steeper curvature for stirring speed, indicating its significant impact on PDI.
3.1.3. Effect of Independent Variables on %EE
The polynomial equation (equation (7)) indicates that all independent factors, polymer concentration (A), surfactant concentration (B), and stirring speed (C), have positive coefficients, demonstrating a direct proportional relationship with %EE. This suggests that increasing any of these factors will improve the %EE. However, the interaction terms present a more complex scenario. The positive coefficients for AB and BC imply synergistic effects, meaning their combined influence is greater than their individual contributions. In contrast, the negative coefficient for AC signifies an antagonistic effect, where simultaneously increasing both polymer concentration and stirring speed leads to a less favorable or detrimental impact on %EE.
Figure 3(a) shows the influence of oil concentration (Factor A) on %EE, revealing a positive correlation. Higher oil concentrations provide a more dispersed phase (PDL), increasing the drug’s accommodation within the droplets [63]. Similarly, Factor B, surfactant concentration, positively affects %EE by improving drug solubilization within the oil phase, reducing interfacial tension, and stabilizing droplets, leading to higher drug encapsulation [64].
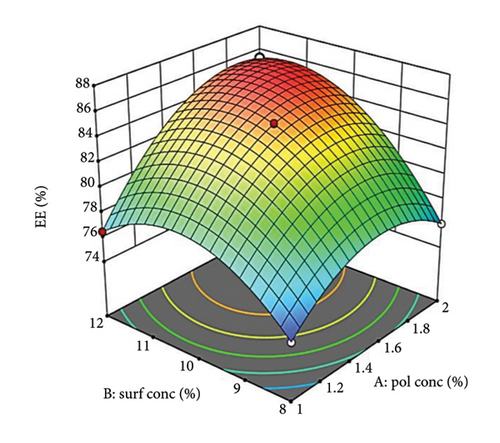
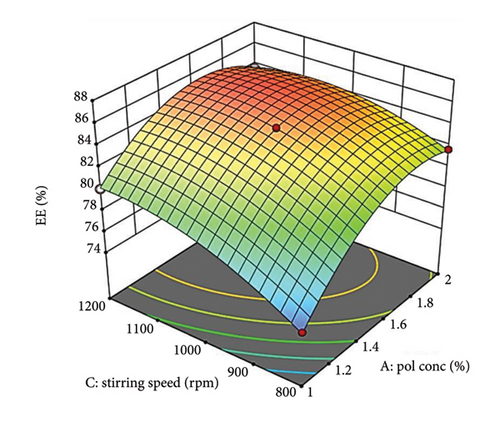
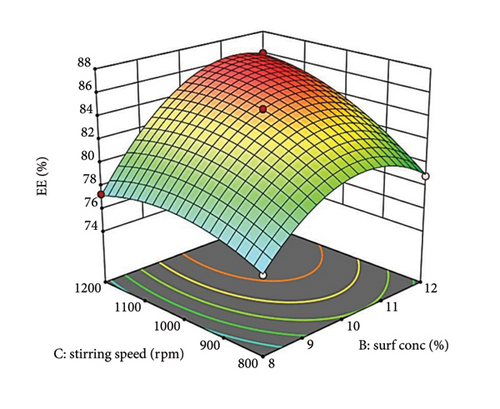
Supporting Figure S4a demonstrates the relationship between oil concentration (Factor A) and surfactant concentration (Factor B) while maintaining a constant stirring speed (Factor C). When surfactant levels are low, a gradual increase in oil concentration leads to a slow rise in %EE, likely attributed to saturation or increased viscosity. In contrast, at elevated surfactant levels, the increase in %EE is more pronounced, indicating better drug solubilization and stabilization with additional surfactant. Figure 3(b) depicts how stirring speed (Factor C) influences %EE, which improves with higher stirring speeds due to better mixing and the formation of smaller, more uniform droplets. However, excessively high speeds may compromise droplet stability, ultimately decreasing %EE [65].
Supporting Figure S4b illustrates the relationship between oil concentration (Factor A) and stirring speed (Factor C) while keeping surfactant concentration (Factor B) constant. At low stirring speeds, a rise in oil concentration results in a sharper increase in %EE, likely because the reduced shear forces facilitate better interaction among polymers. Conversely, at higher speeds, even with increased polymer amounts, strong shear forces can impede droplet formation and diminish the %EE. The more pronounced curve for polymer concentration compared to stirring speed in Figure 3(b) suggests that oil concentration has a substantial effect on %EE.
Supporting Figure S4c illustrates the interaction between surfactant concentration (Factor B) and stirring speed (Factor C) while keeping oil concentration (Factor A) constant. At lower stirring speeds, increasing the surfactant concentration leads to a gradual increase in the %EE. However, at higher speeds, the increase in %EE is more substantial, thanks to improved droplet formation and stabilization. The 3D graph in Figure 3(c) emphasizes the sharper response of %EE to surfactant concentration, suggesting it has a more considerable impact compared to stirring speed.
RSM determined the ideal formulation parameters: 1.5% oil (polymer) concentration (Factor A), 12% surfactant concentration (Factor B), and a stirring speed of 1200 rpm (Factor C), resulting in a high desirability value. Formulation NE1 emerged as the most optimal by evaluating the combined effects of all factors and the best responses achieved. The criteria for the responses included low particle size distributions, high %EE, and low PDI values, all of which were best represented in NE1. This is why NE1 was chosen as the optimized formulation.
3.1.4. Diagnostic Analysis
Diagnostic analysis in DOE is crucial for interpreting experimental outcomes and revealing the underlying reasons for the observed effects. This step offers deeper insights, allowing for more informed decisions, improving predictive capabilities and bolstering the reliability of the experiment’s conclusions.
Design-Expert software generated diagnostic plots (normal probability and externally studentized residuals vs. predicted) to assess the model fit. The normal probability plots of externally studentized residuals (Supporting Figure S5a for droplet size, S6a for PDI, and S7a for %EE) showed that residuals were normal, with data points aligning along the normal probability line, indicating relevant analysis for each response. The externally studentized residuals vs. predicted plots (Supporting Figure S5b for droplet size, S6b for PDI, and S7b for %EE) exhibited data points within acceptable limits close to the zero-axis, suggesting no constant error. In addition, the predicted vs. actual plot confirmed strong alignment between actual and predicted response values, validating the model’s goodness of fit and lack of constant error [66].
3.1.5. Cross-Validation of Predicted and Measured Values for NE1
The predicted values for NE1 from Design-Expert 13 software were compared with experimental measurements (refer to Supporting Table S4). The percentage prediction error (%PE) was computed for each parameter. The droplet size exhibited a %PE of 3.88%, indicating a close alignment between the experimental and predicted values, which fall within the acceptable size range for ophthalmic formulations. The measured PDI of 0.107 was lower than the predicted value of 0.162, reflecting a more uniform distribution of droplet sizes in the optimized formulation, which is beneficial for NEs. Furthermore, the measured %EE of 83.11% was slightly below the predicted 86%, indicating an adequate drug encapsulation.
3.2. Preparation of O/W NE1
O/W NEs represent a promising method for delivering hydrophobic drugs in ophthalmology. Pluronic F68 is a favored option for this application because of its nonionic properties, safety, and HLB value (8–16), which are ideal for O/W emulsions [25].
The NE1 was created using the nanoprecipitation technique (see Supporting Figure S8), with PDL as the oil component. Optimal concentrations were PDL at 1.5% w/v in acetone and Pluronic F68 at 12% w/v in Milli-Q water, stirred at 12000 rpm, determined via the RSM approach. ACZ was included at 1% w/w. The mixture was filtered through a 0.22 μm membrane syringe filter. Key parameters such as globule size, PDI, and zeta potential were evaluated. The stability of the polymeric NE system and the hydrophobic characteristics of PDL facilitated a straightforward preparation process, eliminating the need for a ternary phase diagram.
3.3. Characterization of the NE1
3.3.1. Visual Assessment
The final formulation was visually assessed and tabulated in the Supporting Table S3 for color, appearance, homogeneity, and phase separation.
3.3.2. FTIR
FTIR spectroscopy (Figure 4) validated the presence of ACZ by identifying characteristic absorption bands. The N-H stretching vibrations were detected at 3290.61 cm−1 (asymmetric, NH2SO2), 3176.47 cm−1 (stretching, RCONH), and 3090.46 cm−1 (symmetric, NH2SO2). Moreover, CH3 and aromatic N-H stretching bands were noted at 2900.16 cm−1 and 2773.83 cm−1, respectively. The band observed at 1675.70 cm−1 is associated with either C=O stretching or NH2 scissoring vibrations of the primary amide group. The in-plane N-H deformation vibration was recorded at 1539 cm−1. The bands at 1361.56 cm−1 and 1316.85 cm−1 were linked to asymmetric SO2 stretching and C-N-C stretching, respectively. These findings are consistent with previously published FTIR data for ACZ [67].
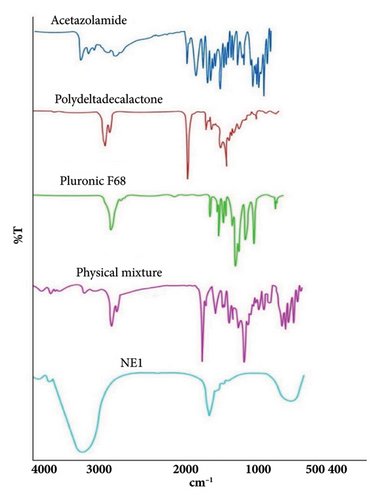
For pure Pluronic F68, a strong band at 2882 cm−1 indicated C-H stretching vibrations in aliphatic hydrocarbons, and a band at 3500 cm−1 showed stretching of the OH band. The spectrum also showed a band at 1112 cm−1, corresponding to C-O stretching vibrations within the polyether units, consistent with published FTIR spectra for Pluronic F68 [68].
FTIR analysis of PDL revealed a sharp peak at 2929.67 cm−1, indicative of aliphatic C-H stretching. The strong peak at 1728.30 cm−1 corresponded to carbonyl (C=O) stretching in the ester groups of the polymer backbone. The peak at 1378 cm−1 suggested C-H bending vibrations, while the peak at 1160 cm−1 fell within the C-O stretching range for esters [31].
The physical mixture’s FTIR spectrum displayed characteristic absorption bands corresponding to the functional groups of ACZ, confirming the absence of any significant drug-excipient interactions.
The FTIR spectral analysis of NE1 revealed significant peak position shifts compared to the native spectra of PDL and Pluronic F68, suggesting effective molecular interactions within the formulation. Key shifts included PDL’s C=O stretching vibration moving from 1728 cm−1 to 1768 cm−1 and its CH bending vibration shifting from 1378 cm−1 to 1396 cm−1. Meanwhile, Pluronic F68’s CH stretching vibration at 2882 cm−1 coalesced into a broad peak at 3200 cm−1. This broad peak at 3200 cm−1 indicates strong intermolecular hydrogen bonding between PDL’s carbonyl groups and ACZ’s sulfamoyl group. In addition, the lack of clear ACZ absorption bands in the ACZ-NE1 spectrum further confirms effective drug encapsulation within the PDL and Pluronic F68 matrix, supporting the formulation’s efficacy.
Although differential scanning calorimetry (DSC) and X-ray diffraction (XRD) were not used to confirm the physical state of ACZ in PDL NEs, we recognize that FTIR alone cannot adequately verify if the substance is amorphous or crystalline. We did not use DSC and XRD because of their limitations with liquid NEs: DSC is influenced by volatile components such as water and oil, and XRD produces broad, nonspecific halos due to the lack of crystalline order [69]. Instead, FTIR and TEM analyses confirmed both molecular interactions and an average droplet size of ∼100 ± 3.2 nm, indicating a noncrystalline state, supported by the observed 90-day stability (droplet size measured at 105 ± 4.0 nm at 30°C/60% RH). Future research will include lyophilization to allow DSC and XRD analysis.
3.3.3. Droplet Size, PDI, Zeta Potential, and Morphological Assessment (TEM)
The NE1 exhibited favorable characteristics: an average droplet size of 238 nm, PDI of 0.107 (Figure 5(a)), and a zeta potential of −11.9 mV (Figure 5(b)). NEs typically range from 100 to 500 nm in size [70]. NE1 falls well within this range, contributing to good formulation stability. Smaller droplet sizes provide a larger surface area for drug encapsulation, potentially enhancing contact with the ocular surface and improving drug absorption [15].
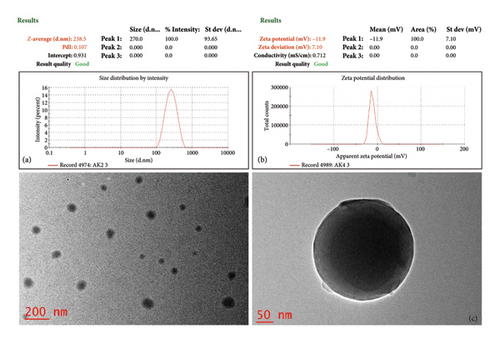
NE1’s PDI of 0.107 falls within the typical range of 0.01–0.5, indicating consistent droplet sizes in the aqueous phase. This uniformity is crucial for stability and results from steric stabilization due to Pluronic poly(ethylene oxide) (PEO) blocks at the oil droplet interface. While a zeta potential over ±30 mV usually suggests enhanced stability, NE1’s potential is −11.9 mV, highlighting the importance of steric stabilization in its colloidal stability. The hydrophilic PEO blocks inhibit aggregation, contributing to NE1’s stability through steric effects and possible weak electrostatic repulsion. Despite its zeta potential being below ±30 mV for electrostatic stabilization, long-term stability relies on steric influences, recognized as an effective strategy for pharmaceutical nanocarriers. This mechanism illustrates how adsorbed Pluronic forms a hydrated, flexible barrier that repels droplets and reduces van der Waals attractions, enhancing stability that is less sensitive to physiological variations in ionic strength and pH compared to systems depending on electrostatic stabilization [12, 71].
TEM analysis was conducted to examine the morphology of the NE1 formulation. As depicted in Figure 5(c), the TEM images confirm the successful formation of a stable NE1, with uniformly distributed, discrete, and nonaggregated spherical globules.
3.3.4. pH and Viscosity Analysis
Ophthalmic formulations aim for a pH of 7.2 ± 0.2 for optimal ocular compatibility, though a broader range of 3.5–8.5 is acceptable [14]. Tear fluid, with an average pH of 6.5–7.6 (mean: 7.0), has a limited but significant buffering capacity [72], allowing it to adjust the pH of instilled formulations by up to 2.5–3 units for unbuffered preparations [73].
NE1’s measured pH of 4.73 ± 0.21 is crucial in balancing tear comfort and drug stability. Upon administration, tear fluid can buffer this acidity, enhancing ocular compatibility. The acidic pH also contributes to the stability of ACZ, which is optimal within the pH range of 4-5 and degrades at alkaline pH values. This balance in pH underscores NE1’s potential for effective glaucoma treatment. This slightly acidic pH may cause transient stinging that should resolve as tears restore neutrality [15].
Viscosity is a critical parameter in ophthalmic formulations, as it can influence drug retention time on the ocular surface, thereby enhancing drug absorption and prolonging therapeutic effects. The NE1 exhibited a viscosity of 4.18 ± 0.48 mPa·s, which falls within the acceptable range for ophthalmic formulations. The viscosity of NEs must be compatible with the viscosity of tears (approximately 1.5 mPa·s) and should not exceed 20 mPa·s. NE1’s viscosity was well below this threshold, ensuring it would not obstruct the tear ducts and maintain ocular comfort [70].
3.3.5. %Encapsulation Efficiency Determination
The %EE of NE1 was determined spectrophotometrically. NE1 demonstrated a high %EE of 83.11 ± 0.62%, indicating sufficient drug loading for therapeutic efficacy. This remarkable encapsulation can be attributed to the unique molecular interactions between PDL, the drug, and the surfactant system.
High encapsulation efficiency results from two main molecular interactions. First, hydrogen bonds form between PDL’s carbonyl groups (C=O) and the amide nitrogen (N-H) of ACZ’s sulfamoyl group. Despite being individually weak, these bonds create a strong network that enhances drug retention in the PDL matrix. Second, hydrophobic interactions occur between ACZ’s methyl group and the hydrophobic core of the PDL matrix, facilitating effective physical encapsulation.
3.3.6. In Vitro Drug Release
The in vitro drug release studies using Franz diffusion cells demonstrated distinct release profiles between the NE1 formulation and pure ACZ suspension. The NE1 formulation exhibited sustained release behavior, achieving 92.62 ± 0.33% drug release over 14 h, while the pure ACZ suspension released 99.13 ± 0.8% within 1.5 h (Figure 6).
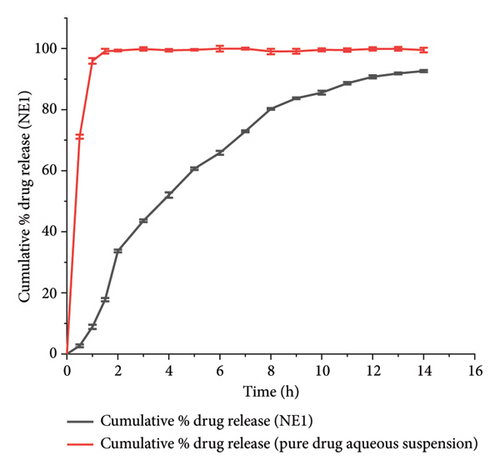
The enhanced drug release profile of NE1 is attributed to two key mechanisms. First, the PDL matrix in NE1 effectively solubilizes ACZ, increasing the surface area for diffusion and enabling controlled release through gradual polymer degradation [28]. Second, the Pluronic F68 in NE1 stabilizes the nanodroplets, forming a protective steric barrier that regulates ACZ release, further contributing to sustained drug delivery [74]. The controlled release profile demonstrated by NE1 not only suggests its potential for maintaining therapeutic drug levels over an extended period but also highlights its promising role in enhancing patient compliance in glaucoma treatment. This potential could significantly improve the management of this condition, offering hope for better patient outcomes.
The ACZ release mechanism for NE1 was analyzed using various models: zero-order, first-order, Higuchi, Hixson–Crowell, and Korsmeyer–Peppas. The most suitable model was selected based on R2 values (over 0.95), the lowest Akaike information criterion (AIC), and a model selection criterion (MSC) of three or higher. The first-order model (R2 = 0.99, AIC = 90.07, MSC = 4.28) and Hixson–Crowell model (R2 = 0.988, AIC = 92.45, MSC = 4.15) best described the ACZ release (see Supporting Table S5). These findings are typical for NEs, where release is influenced by diffusion across the oil–water interface or partitioning. First-order kinetics apply when release profiles show rapid initial release followed by a slower phase. The Hixson–Crowell model is suitable for NE1’s release profile due to its small droplet size and large surface area. NE1 may follow Hixson–Crowell kinetics if drug release is driven by erosion or dissolution from the NE droplet surface, especially when the drug is within an erodible polymer matrix (PDL), which leads to release through surface dissolution or degradation influenced by tear turnover in the ocular environment, corresponding to the reduction in droplet size during release.
3.3.7. Thermodynamic and Accelerated Stability Studies
Thermodynamic stability testing assessed the NE1 formulation’s stability through heating–cooling cycles, freeze-thaw cycles, and centrifugation. It passed all tests without creaming, cracking, or phase separation, confirming excellent physical stability under various environmental stresses, vital for its use as an ocular drug delivery system.
The optimized formulation demonstrated strong stability, preserving its physicochemical integrity and performance when stored at room temperature and 45°C for over 90 days (Figures 7(a), 7(b), 7(c), and 7(d)). Under varied conditions, this stability assessment suggests a significant shelf life of about 360 days at room temperature, instilling confidence in its long-term use ex vivo [38].
3.3.8. Ex Vivo Corneal Permeation Study
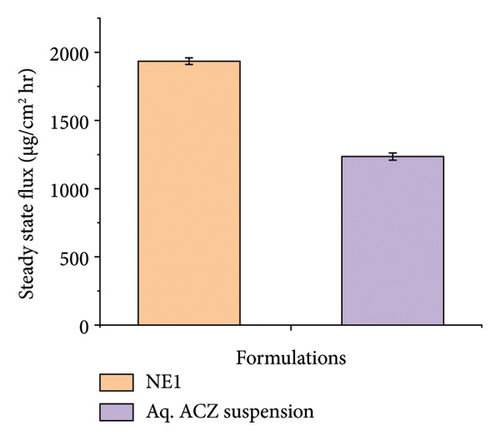
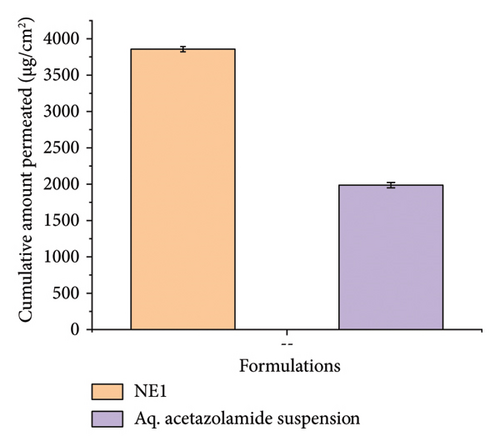
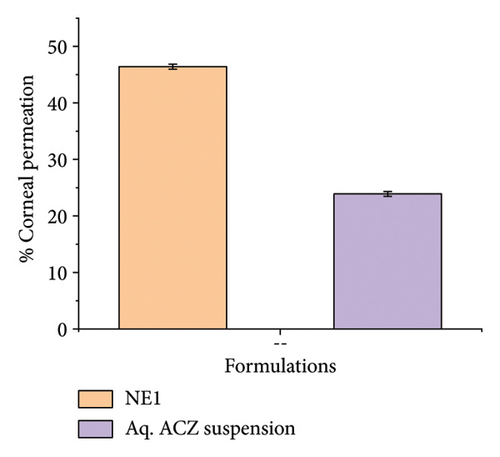
Ex vivo corneal permeation studies showed that NE1 significantly improved drug delivery over an aqueous drug suspension (Figures 8(a), 8(b), and 8(c)). This demonstrates NE1’s effectiveness in penetrating the cornea, a key barrier in ocular drug delivery. Encapsulating ACZ in PDL nanodroplets addressed issues of low solubility and permeability. The NE’s kinetic stability, single-phase nanocolloidal structure, and greater surface area-to-volume ratio supported enhanced ACZ solubility and permeability [75]. Furthermore, the oily nature of PDL increased the formulation’s viscosity, promoting prolonged corneal adhesion and drug penetration, leading to a greater cumulative permeated amount. This characteristic of PDL is vital for improving the drug’s bioavailability by extending contact with the corneal surface and enhancing absorption potential.
3.3.9. Postpermeation Corneal Hydration Assessment
Corneal hydration serves as an important indicator of possible damage from topical formulations, with a healthy cornea usually maintaining hydration levels between 75% and 80%. Notable deviations from this range may indicate potential damage to ocular cells. In the case of NE1, corneal hydration consistently remained within the normal range of 75%–80%, suggesting that NE1 does not harm ocular cells. Likewise, a 1% pure ACZ suspension in water showed no impact on corneal hydration, indicating that ACZ itself is not inherently damaging to ocular cells.
3.4. In Vivo Studies
3.4.1. Ocular Tolerability or Ocular Irritancy Test
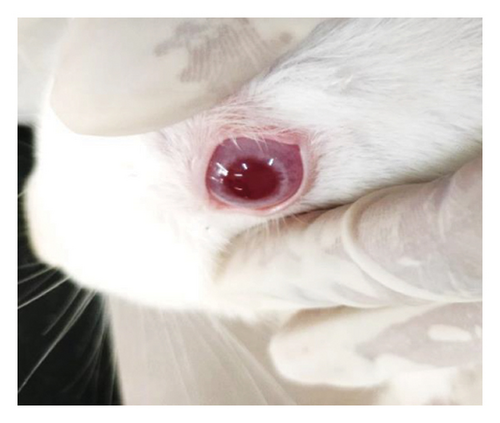
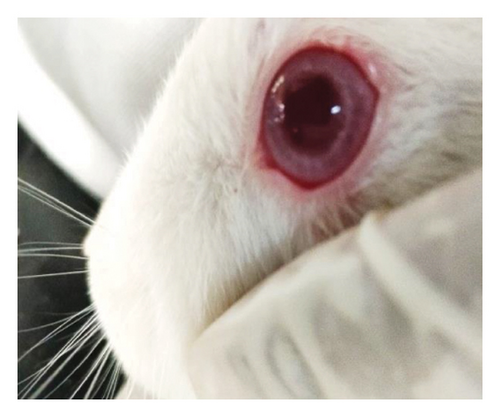
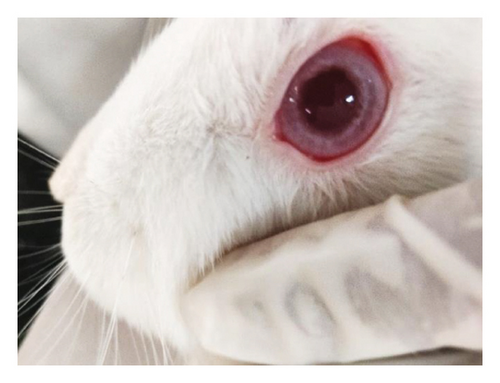
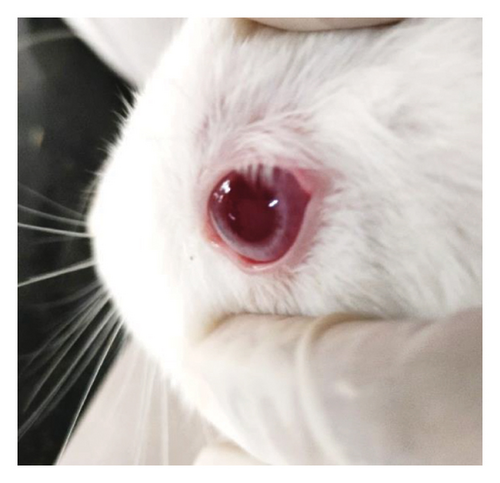
Modified Draize test (low volume eye test): The ocular irritation and tolerability of NE1 were assessed per OECD guidelines (see Supporting Table S2) and compared with a marketed product. Table 3 shows NE1’s exceptional biocompatibility, with no ocular irritation or toxicity (refer to Figures 9(a), 9(b), 9(c), 9(d), 9(e), and 9(f)). Its ocular lesion grading closely matched that of the 1% brinzolamide suspension, a well-established treatment. According to OECD guidelines, if any formulation shows irritation or lesions within the first three days, the study ends, followed by a 21-day observation for lesion reversibility. The results were encouraging, as NE1 demonstrated strong acceptance for ophthalmic use without irritation or toxicity. Furthermore, Pluronic® F68, the surfactant used, is FDA-approved for ophthalmic applications, emphasizing its safety.
| Safety parameters | Observation | Value |
|---|---|---|
| Cornea (degree of opacity) | Normal saline | 0 |
| NE1 | 0 | |
| 1% Brinzolamide marketed suspension | 0 | |
| Iris | Normal saline | 0 |
| NE1 | 0 | |
| 1% Brinzolamide marketed suspension | 0 | |
| Conjunctivae (redness) | Normal saline | 0 |
| NE1 | 0 | |
| 1% Brinzolamide marketed suspension | 0 | |
| Chemosis | Normal saline | 0 |
| NE1 | 0 | |
| 1% Brinzolamide marketed suspension | 0 | |
3.4.2. Pharmacodynamic and Pharmacokinetic Tests
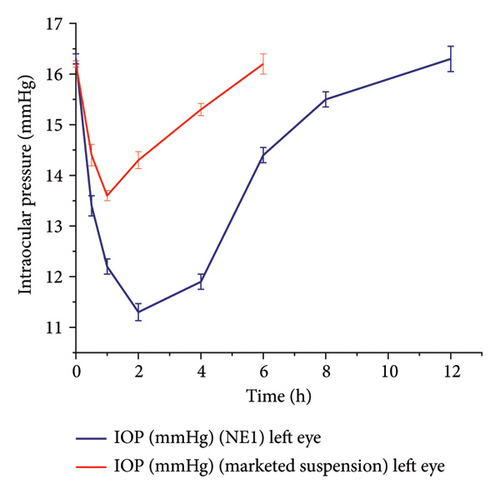
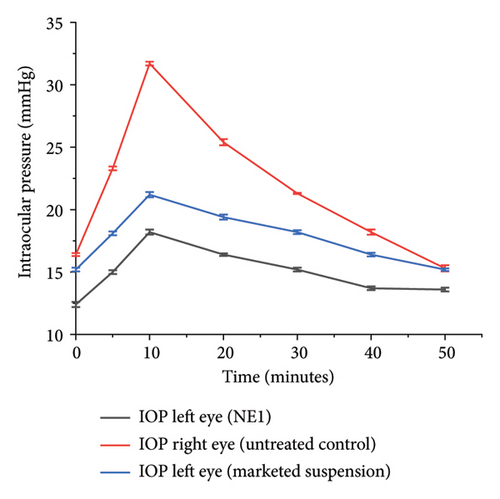
Figure 10(a) shows the IOP reduction in normal rabbits after administering NE1 compared to a commercial 1% brinzolamide suspension. NE1 lowered the IOP from an initial 16.3 ± 0.1 mmHg to 12.2 ± 0.15 mmHg within 1 h, with this reduced pressure sustained for 12 h before returning to baseline levels. In contrast, the commercial brinzolamide suspension only decreased IOP from 16.2 ± 0.06 mmHg to 13.6 ± 0.1 mmHg, and its effect lasted for just 6 h. Similar experiments on glaucomatous rabbits (Figure 10(b)) indicated that NE1 consistently achieved superior IOP reduction compared to the commercial product. With NE1, the average IOP was 14.97 ± 0.15 mmHg, which is significantly lower than the 17.68 ± 0.03 mmHg seen with the marketed formulation over a period of 50 min. Therefore, NE1 exhibited a more prolonged effect in reducing IOP.
Pharmacokinetic studies indicated that NE1 has a longer half-life (t1/2) of 1.92 h compared to the marketed formulation’s 1.18 h, suggesting that NE1 remains in the eye for a longer duration. Both formulations exhibited comparable absorption rates, each having a Tmax of 4 h. Nevertheless, NE1 demonstrated better absorption, achieving a higher Cmax of 0.083 μg/mL in contrast to the marketed formulation’s 0.017 μg/mL. In addition, the AUC0−∞ for NE1 (1360.31 μg·h/mL) was substantially greater than that for the marketed product (534.16 μg·h/mL), reflecting a higher overall drug exposure for NE1.
The improved pharmacodynamic effect of NE1 is probably attributable to its enhanced drug penetration, caused by its small droplet size that enlarges the contact surface area with the corneal membrane. This is consistent with the principle that smaller particles facilitate membrane diffusion. Furthermore, NE1’s oily composition may boost bioavailability by prolonging the formulation’s residence time on the corneal surface, thereby fostering sustained drug absorption [76].
3.4.3. Histopathological Test
Ocular drug delivery systems must ensure high patient compliance by minimizing side effects such as irritation, burning, stinging, and tearing, which can hinder medication adherence and affect therapeutic efficacy [77].
Histopathological analysis indicated that the corneal section from a normal control eye (Figure 11(a)) showed intact, healthy corneal layers, which included the epithelium, Bowman’s layer, stroma, Descemet’s membrane, and endothelium. In contrast, the cornea from the glaucomatous eye (Figure 11(b)) displayed signs of edema, marked by fluid accumulation within the corneal stroma and damage to the epithelium. Following treatment with NE1 (Figure 11(c)), the cornea exhibited decreased swelling and enhanced epithelial recovery. The commercially available formulation also alleviated swelling but did not achieve the same degree of epithelial restoration.
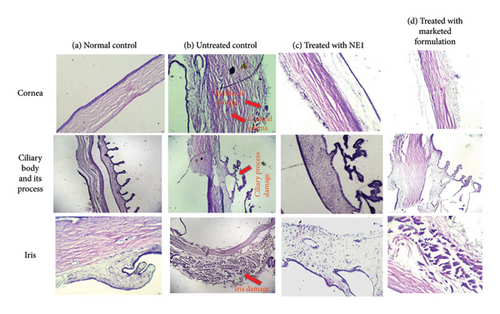
The ciliary process in the normal control eye (Figure 11(a)) appeared healthy, whereas the glaucomatous eye (Figure 11(b)) exhibited damage. Both eyes treated (Figures 11(c) and 11(d)) displayed normal ciliary processes. The iris in the normal control eye (Figure 11(a)) showed a healthy structure, while the iris stroma in the glaucomatous eye (Figure 11(b)) was swollen. Treatment with both NE1 and the marketed formulation (Figures 11(c) and 11(d)) resulted in the recovery of the iris stroma [78].
4. Conclusion
The ACZ-NE using PDL as a biodegradable oily phase marks a breakthrough in glaucoma drug delivery. The optimized formulation, NE1, showed excellent physicochemical properties, including a droplet size of approx. 238 nm, a low PDI of 0.107, and a zeta potential of −11.9 mV, ensuring stability. NE1 also achieved an entrapment efficiency of 83.11 ± 0.62%, indicating effective drug incorporation. In vitro and ex vivo studies demonstrated improved drug solubility, a sustained release for over 14 h, and enhanced corneal permeation compared to an aqueous ACZ suspension, highlighting its advantages over traditional formulations. In vivo studies confirmed NE1’s effectiveness, with a prolonged IOP reduction lasting up to 12 h in glaucomatous rabbits (average IOP of 14.97 ± 0.15 mmHg over 50 min), outperforming the marketed 1% brinzolamide suspension (17.68 ± 0.03 mmHg for 6 h). Pharmacokinetic assessments revealed NE1’s superior profile, showing a longer half-life (1.92 h vs. 1.18 h), a higher Cmax (0.083 μg/mL vs. 0.017 μg/mL), and a greater AUC0−∞ (1360.31 μg·h/mL vs. 534.16 μg·h/mL), indicating enhanced drug absorption and ocular retention. In addition, NE1 showed significant ocular safety and biocompatibility, as indicated by a modified Draize test (score 0) and histopathological evaluations that demonstrated reduced corneal swelling and improved epithelial recovery. These features suggest NE1’s potential to decrease dosing frequency, enhance patient adherence, and reduce systemic side effects from oral ACZ therapy.
From an economic viewpoint, NE1 serves as a cost-efficient option compared to existing glaucoma treatments. The active ingredient, ACZ, is significantly cheaper than widely prescribed medications such as travoprost and latanoprost. Moreover, the precursor for PDL, δ-decalactone, is also financially feasible, which makes the formulation appealing for clinical implementation. Future research should focus on assessing the long-term stability and antimicrobial resistance of this preservative-free formulation to confirm its appropriateness for clinical applications. Exploring the addition of supplementary therapeutic agents for combination therapy could further increase its therapeutic efficacy. This study addresses vital obstacles in glaucoma treatment and provides a promising foundation for improving ocular drug delivery systems.
Conflicts of Interest
The authors declare no conflicts of interest.
Funding
This study was supported by Business Finland, 10.13039/501100014438, 1609/31/2021; Academy of Finland, 10.13039/501100002341, 336355; Stiftelsen för Åbo Akademi, 10.13039/501100007360.
Acknowledgments
The authors sincerely thank Bundelkhand University, Jhansi, for providing research facilities. The first author acknowledges Dr. Neelima Gupta’s support with histopathological sample preparation and thank Amity University, Gwalior, for access to their microscope facilities for histopathological investigations. The authors also gratefully acknowledge the Central Instrumentation Facilities at Dr. Harisingh Gour Vishwavidyalaya, Sagar, and Lovely Professional University, Phagwara, for their invaluable assistance with characterization services, including TEM, zeta potential, droplet size, and PDI analysis.
Supporting Information
Additional supporting information can be found online in the Supporting Information section.
Open Research
Data Availability Statement
The data that support the findings of this study are available on request from the corresponding author. The data are not publicly available due to privacy or ethical restrictions.


