In Vitro and Ex Vivo Evaluation of Zinc Peroxide Nanoparticles in Gel for Their Application as Intracanal Medication in Endodontics
Abstract
Introduction: The primary goal of endodontics is to cure or prevent periapical pathology. Bacteria and their by-products are the main etiological factors in apical periodontitis. Common disinfectants include NaOCl, chlorhexidine, and EDTA, often used with intracanal medications such as calcium hydroxide (Ca(OH)2). Recently, various nanoparticulate materials, particularly silver nanoparticles (AgNPs), have shown promise due to their excellent antimicrobial properties and high biocompatibility. However, zinc peroxide nanoparticles (ZnO2NPs) have notable chemical stability, low toxicity to human cells, and antimicrobial properties through the release of reactive oxygen species (ROS). This study aims to synthesize, characterize, and evaluate the antimicrobial activity of ZnO2NP and compare their properties with AgNP and Ca(OH)2.
Materials and Methods: AgNPs were synthesized via a chemical reduction method, while ZnO2NPs were synthesized using a solgel method. Nanoparticles were characterized using Fourier-transform infrared (FT-IR) spectroscopy, ultraviolet–visible spectroscopy (UV–Vis), dynamic light scattering (DLS), and transmission electron microscopy (TEM). Gels containing 1.5% hydroxyethyl cellulose were prepared with AgNP and ZnO2NP. Disk diffusion and dilution methods were used to evaluate antimicrobial activity against Enterococcus faecalis (ATCC 29212). Fifteen extracted single-rooted teeth were used to evaluate biofilm formation and infection with SEM and LIVE/DEAD kits. Statistical analysis included the Kruskal–Wallis and Mann–Whitney U tests (p < 0.05).
Results: ZnO2NPs showed higher antimicrobial activity with a mean inhibition zone of 15.2143 mm, compared to Ca(OH)2 (10.2857 mm) and AgNP (8.1786 mm). ZnO2NPs also had the lowest absorbance, indicating higher antibacterial activity.
Discussion: ZnO2NP’s superior antimicrobial activity is likely due to ROS production, which bacteria find hard to resist. Their chemical stability and amphoteric nature make ZnO2NP promising for endodontic use.
Conclusion: ZnO2NP gels exhibited greater antimicrobial activity compared to AgNPs and Ca(OH)2, suggesting their potential as an alternative intracanal medication in endodontics.
1. Introduction
The primary goal of endodontics is to cure or prevent periapical pathology [1]. Bacteria and their by-products are the main etiological factors in apical periodontitis [2, 3]; therefore, disinfection processes are essential for the success of root canal treatment [4–6]. Various materials, systems, and techniques have been developed to achieve optimal disinfection of the root canal system (RCS) [7, 8]. Disinfection of the RCS is traditionally performed using irrigants such as NaOCl [9], chlorhexidine [4], and EDTA [10]. These irrigants are often used in conjunction with intracanal medications such as calcium hydroxide (Ca(OH)2) [11], triple antibiotic pastes [12], and iodoform pastes [13].
Over time, Ca(OH)2 has become the preferred intracanal medication for root canal treatment due to its low solubility, which allows for the gradual release of calcium and hydroxyl ions, creating a highly alkaline environment with a pH of 12 that inhibits bacterial growth [14]. However, the texture and consistency of calcium hydroxide (Ca(OH)2) present significant challenges in terms of its handling and proper application, especially in narrow or highly curved canals. Additionally, the complete removal of Ca(OH)2 is often problematic, as it can leave a residue that covers approximately 20%–45% of the root canal wall surfaces. Even after applying activated irrigation techniques with solutions such as NaOCl and EDTA using sonic or ultrasonic methods, the Ca(OH)2 residue can interfere with the obturation process and compromise the quality of the treatment [15]. Another significant concern is that Ca(OH)2 is not completely effective against various endodontic pathogens, such as Enterococcus faecalis and Candida albicans [16]. The ability of Ca(OH)2 to comprehensively eradicate bacteria in the RCS has been questioned by several studies. In a clinical study, the number of canals with the presence of bacteria was observed to increase after the application of Ca(OH)2 [17]. Moreover, other studies have also indicated that Ca(OH)2 did not consistently eliminate bacteria, and in some cases, cultures turned from negative to positive after the administration of Ca(OH)2 [18].
In this context, several nanoparticulate materials have been explored as potential alternatives for intracanal medication, but silver nanoparticles (AgNPs) have stood out in the field of endodontics due to their excellent antimicrobial properties, nanometric size, and high biocompatibility. In 2010, AgNPs were used for the first time as irrigants, and to date [19], they have been widely studied and applied in disinfection processes and the inhibition of bacterial growth [20]. On the other hand, it has been found that zinc peroxide nanoparticles (ZnO2NPs) exhibits notable chemical stability, low toxicity to human cells, and possesses antimicrobial properties by releasing oxygen derivatives such as hydrogen peroxide, hydroxyl radicals, and oxygen radicals, known as reactive oxygen species (ROS) [21]. However, ZnO2NPs have not been used as intracanal medication in the field of endodontics.
The aim of this study was to synthesize, characterize, and evaluate the antimicrobial activity of ZnO2NPs and compare them with the properties of AgNPs and Ca(OH)2. The antimicrobial activity will be assessed using in vitro methods, including disk diffusion, dilution, and confocal laser microscopy.
2. Materials and Methods
2.1. Synthesis of AgNPs
The AgNPs were synthesized using the chemical reduction method described by Mariam, Dongre, and Kothari [22]. Initially, two solutions were prepared: a sodium citrate (Na3C6H5O7) solution and a silver nitrate (AgNO3) solution. For the preparation of the sodium citrate solution, 7.74 g of sodium citrate was dissolved in 10 mL of distilled water to yield a concentration of 3 M. Simultaneously, 0.1698 g of silver nitrate was dissolved in 10 mL of distilled water, yielding a solution of 0.1 M. Both solutions were prepared in separate Erlenmeyer flasks. For the synthesis of the nanoparticles, the sodium citrate solution was added drop by drop to the silver nitrate solution under continuous agitation in an environment protected from direct light to avoid reactant photodegradation. This step was crucial to control the rate of reduction of AgNO3 and facilitate uniform nucleation of the AgNPs. During the addition, the solution changed color from colorless to bright yellow, indicating the formation of the nanoparticles. Subsequently, the mixture was heated to 60°C to promote the chemical reaction. Temperature control was essential for efficient silver nitrate reduction and nanoparticle stabilization. At the end of the process, the concentration of the nanoparticles in the colloidal solution was 0.83 mg/mL.
2.2. Synthesis of ZnO2NPs
The synthesis procedure adopted in this study was based on a previously standardized method as described by Ramírez et al. [23]. Zinc acetate (Zn(CH3COO)2) and hydrogen peroxide (H2O2) were used as the starting materials for the synthesis of ZnO2NPs. One gram of zinc acetate was accurately weighed and dissolved in 45 mL of distilled water to prepare a 0.01 M solution. Simultaneously, 5 mL of 3% (1.2 M) hydrogen peroxide solution was prepared. The zinc acetate solution was transferred to an Erlenmeyer flask. The hydrogen peroxide solution was then added slowly to the zinc acetate solution under continuous stirring to ensure thorough mixing and prevent local reactant excess that could lead to uneven particle formation.
The mixture of zinc acetate and hydrogen peroxide was subjected to sonication for 30 min in an ultrasonic bath. The temperature of the sonic bath was maintained at 60°C throughout the process. This step was critical for promoting the chemical reaction between zinc ions and hydrogen peroxide, leading to the formation of ZnO2NPs. The reaction mixture gradually turned into a milky white solution, which indicated successful ZnO2NP synthesis. The color change served as a visual confirmation of nanoparticle synthesis. The final concentration of the ZnO2NPs in the solution was determined to be 2 mg/mL. This concentration was achieved under controlled experimental conditions to ensure reproducibility and stability of the nanoparticle dispersion [23].
2.3. Characterization of Nanoparticles
Fourier-transform infrared (FT-IR) spectra were collected in an attenuated total reflectance (ATR) configuration ranging from 4000 to 400 cm−1 using a Thermo Scientific IR ATR Nicolet IS10 spectrophotometer. Ultraviolet–visible (UV–Vis) spectra were recorded on a DR-5000TM Hach spectrophotometer over a range of 200–800 nm. A Zetasizer Nano S DTS1060 Malvern instrument was used to determine the size and surface charge of the synthesized nanoparticles. Transmission electron microscopy (TEM) was conducted using a Hitachi H7500 microscope with a LaB6 filament operated at 80 kV.
2.4. Gel Preparation
Following the protocol of Bruneira et al., 1.5% w/v hydroxyethyl cellulose (C2H6O2)n (9904-62-0, Cellosize) gels were prepared [24]. The AgNP gel was prepared by mixing 0.75 g of hydroxyethyl cellulose with 50 mL of the AgNP solution and stirring vigorously until a homogeneous and fluid gel was obtained. A homogeneous solution was formed. The ZnO2NP gel was prepared by dissolving 2 mg of nanoparticles in 50 mL of distilled water to which 0.75 g of hydroxyethyl cellulose was added.
2.5. Antimicrobial Susceptibility Testing (AST)
Two methods were employed to assess the antibacterial activity of the nanoparticles. The first test was the agar disk diffusion method, where the zone of inhibition determines the degree of antibacterial activity. The second test used the dilution technique, which was evaluated by absorbance.
2.5.1. Microorganisms and Tested Materials
The bacterial strain Enterococcus faecalis (ATCC 29212) was cultured on Petri dishes with Tryptic Soy Agar (Beckton Dickinson) at 37°C for 24 h in an incubator (VWR International Model 1545). Five colonies were selected and suspended in Mueller–Hinton broth (Becton Dickinson) to obtain an initial bacterial suspension of 0.5 McFarland. The properties of AgNP and ZnO2NP gels were evaluated. A commercial 35% Ca(OH)2 paste (Ultracal XS, Ultradent) was used as a positive control.
2.5.2. Disk Diffusion Method
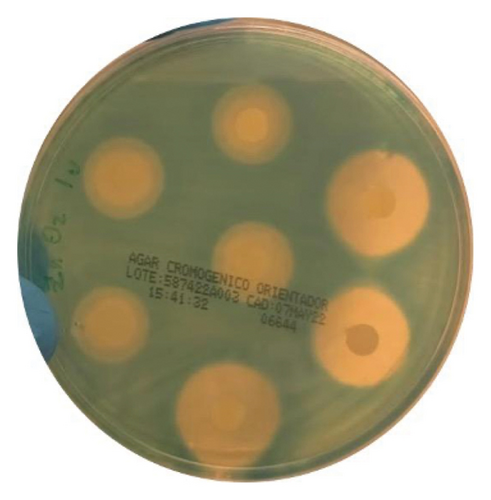
Tests were performed using the disk diffusion method on chromogenic agar (CHROMagar) with the Kirby–Bauer technique. The assay used 6-mm filter paper disks impregnated with AgNP gel, ZnO2NP gel, and Ca(OH)2 paste. The disks were impregnated just before the experiment. After impregnation, the disks were allowed to dry for 5 min. Using sterile tweezers, 6 equidistant disks were carefully placed onto the agar surface. The plates were then incubated in an inverted position at 37°C in an aerobic atmosphere for 24 h. Finally, the zone of complete inhibition of bacterial growth was determined using a Vernier caliper. The determination was made by placing a dark surface under reflected light on the back of the Petri dish without removing the lid. The endpoint of complete growth inhibition was estimated visually. The measurement included the diameter of the disk and the inhibition halo observed from the outer edge of the disk containing the cement, with the endpoint being the appearance of bacterial colonies.
2.5.3. Antibacterial Microdilution Assay
Dilution tests were performed in sterile 10-mL glass tubes to which 3 mL of the Mueller–Hinton broth (Becton Dickinson), 4 μL of the bacterial solution, and 75 mg of AgNP gel, ZnO2NP gel, and Ca(OH)2 paste were added. They were incubated for 7 days at 150 rpm and 37°C under aerobic conditions. Absorbance was measured at 650 nm with a Thermo Spectronic Genesys 5 spectrophotometer. The negative control was culture broth, and the positive control was culture broth plus bacterial solution.
2.6. Ex Vivo Experiments
A total of 15 extracted single-rooted teeth were used as research material in this study. This study received ethical approval from the Research Ethics and Postgraduate Evaluation Committee (CEIP) of the Universidad Autónoma de Baja California (UABC), Faculty of Health Sciences (Approval No. 072/2023-1). Each tooth was sectioned horizontally 1 mm below the cementoenamel junction and 2 mm from the apex using a TF-13 bur (Manni) to obtain 4-mm dentin blocks. Each dentin block was divided into two semicylindrical halves. Subsequently, each sample underwent a sequential treatment, first with 5.25% NaOCl (Cloralex) for 4 min, followed by 17% EDTA (Zeyco) for an additional 4 min. This procedure was performed using an ultrasonic bath to remove the smear layer. The samples were then rinsed in sterilized water for 10 min to ensure the removal of any chemical residues. Finally, the samples were sterilized in an autoclave (Lorna) at 121°C for 20 min.
For dentin cube infection, the bacterial strain Enterococcus faecalis (ATCC 29,212) was used. First, an initial bacterial solution of 0.5 McFarland was prepared and adjusted in brain heart infusion (BHI). Subsequently, 2 mL of BHI, 500 μL of the bacterial suspension, and the dentin cube were mixed using an Olympus 24-well plate (Genesee Scientific) with a capacity of 3.5 mL. Samples were incubated at 37°C for 4 weeks, changing the medium every 48 h to ensure bacterial viability. Finally, two samples were taken and analyzed by scanning electron microscopy (SEM) to evaluate biofilm formation and bacterial infection of the dentinal tubules. SEM images were acquired with a Hitachi SU300 SEM at 7.00 kV.
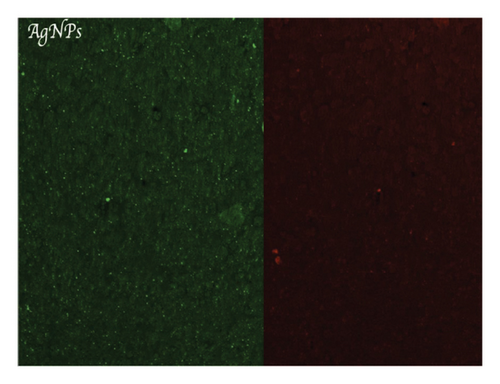
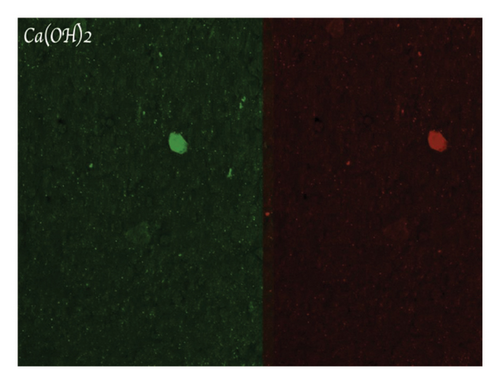
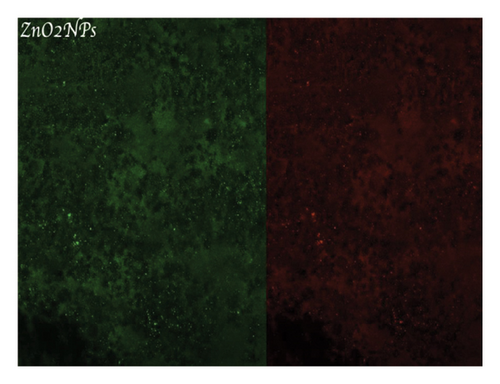
Biofilms formed on dentin cubes were stained using a LIVE/DEAD bacterial viability kit (Biotium). This kit provides two-color fluorescent staining of both live (green) and dead (red) bacteria using two DNA dyes, DMAO and EthD-III, respectively. After staining, the samples were washed for 1 min with phosphate-buffered saline (PBS, ABI). Images of the stained dentin cubes were taken using an Olympus FV 1000 multiphoton microscope. Each sample was examined and scanned in random areas. Four samples were evaluated for each group. Five images were taken at random locations from each disk, producing 20 images per group. Image analysis and the creation of two-dimensional/three-dimensional images were performed using ImageJ software, National Institutes of Health.
3. Statistical Analyses
Categorical variables were expressed as frequencies and percentages and continuous variables as means ± standard deviations and ranges. The Shapiro–Wilk and Brown–Forsythe tests were performed to determine the distribution of the variables. We used the Kruskal–Wallis test and Mann–Whitney U test to establish the differences between groups. Data were analyzed using JMP Ver. 15 (SAS Institute, Cary, NC) statistical software. The significance level was set at p < 0.05.
4. Results
4.1. Synthesis and Characterization of Nanoparticles
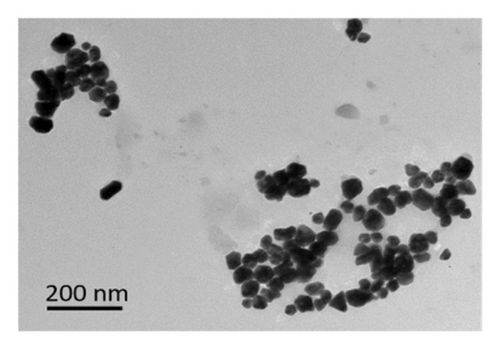
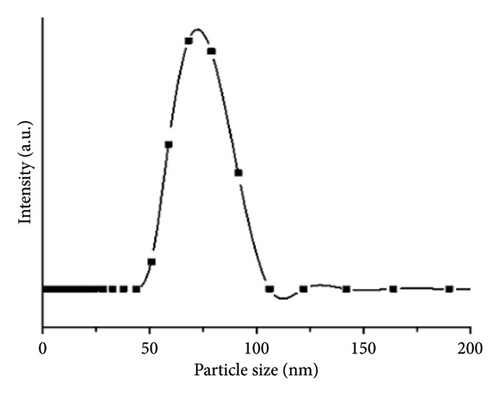
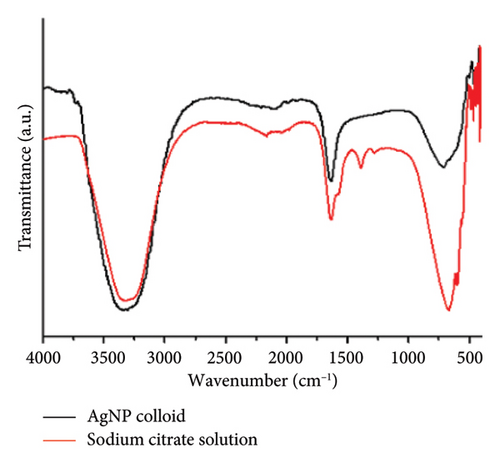
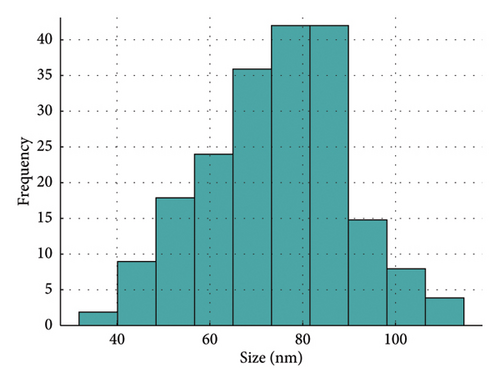
A colloidal solution of AgNPs was obtained, in which sodium citrate acted as a reducing and stabilizing agent for the nanoparticles. The AgNPs in the colloidal solution were characterized by UV–Vis, TEM, dynamic light scattering (DLS), and FT-IR. Figure 1(a) presents a TEM micrograph showing that the AgNPs have a variable spherical morphology with diameters ranging between 50 and 100 nm (Figure 1(f)), results that are consistent with those found by UV–Vis and DLS. DLS (Figure 1(b)) showed a size distribution centered at 80 nm with a polydispersity index (PDI) of 0.54, indicating a moderately broad size distribution. The FT-IR spectrum of sodium citrate displayed prominent peaks at 3331, 2098, 1643, and 714 cm−1, corresponding to the stretching vibrations of OH, antisymmetric and symmetric C=O, and C–H groups, respectively. The FT-IR spectrum of AgNPs is similar to that of sodium citrate, with the main difference being that the signal at 714 cm−1 decreases and broadens at lower wavenumbers, which is attributed to the stretching of the metal–ligand frequency formed due to the interaction between the stabilizer and the AgNPs (Figure 1(c)). The formation of AgNPs was confirmed by UV–Vis spectroscopy (Figure 1(d)), which revealed an absorption peak at a maximum wavelength (λmax) of 420 nm, characteristic of the surface plasmon resonance of metallic AgNPs. The zeta potential analysis showed that the nanoparticles possessed a negative charge of −8.08 mV (Figure 1(e)), suggesting that sodium citrate was adsorbed onto their surface, promoting stability and reducing agglomeration in the colloidal solution.


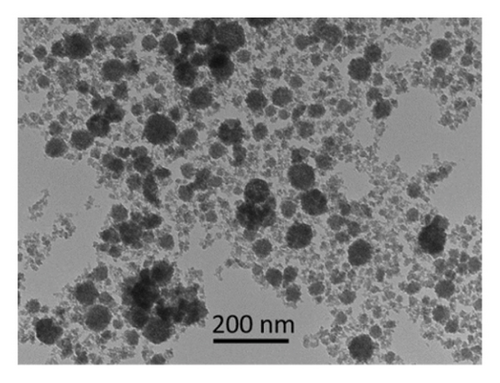
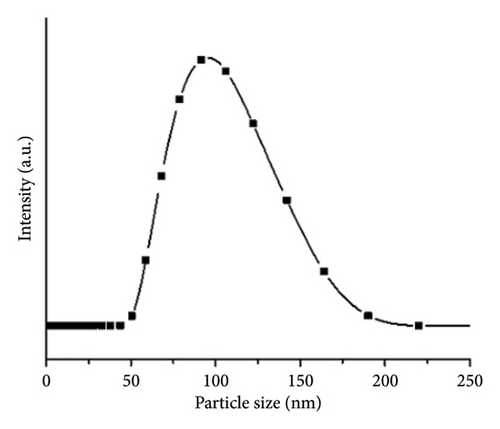
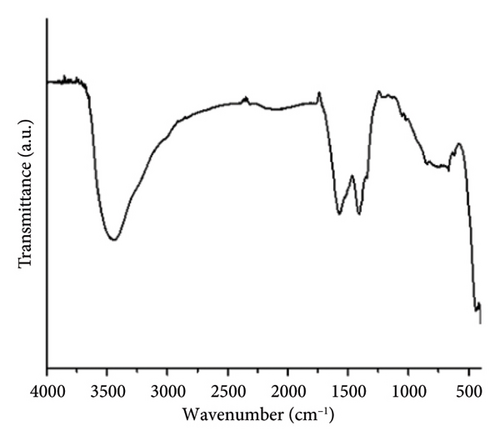
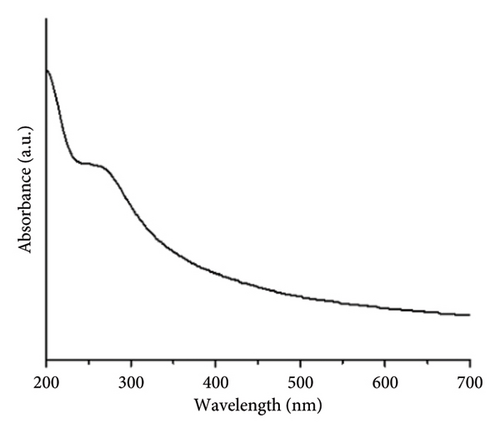
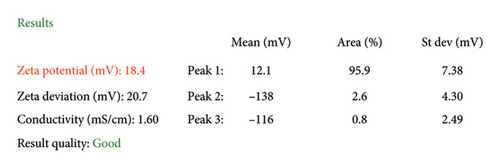
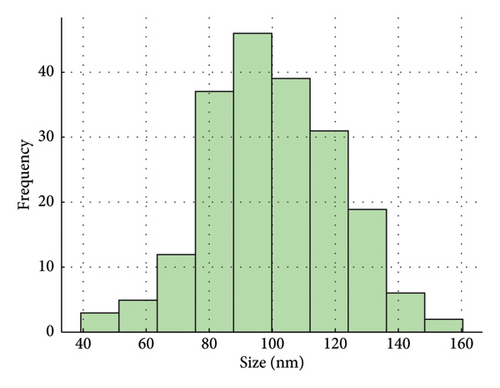
The ZnO2NPs were obtained in a solid and particulate state, and the characterization results are shown in Figure 2. The micrographs (TEM) suggest the formation of primary nanoparticles approximately 10 nm in size, which agglomerate to form clusters with a spherical morphology and dimensions of up to 100 nm (Figure 2(a)). DLS analysis indicated a size distribution centered at 105 nm with a moderately low PDI of 0.252 (Figure 2(b)). This supports the TEM findings, indicating the presence of nanoparticle clusters approximately 100 nm in size with a near-normal size distribution (Figure 2(f)). The FT-IR spectrum displayed characteristic absorption peaks at 3446, 1574, 1403, 754, and 440 cm−1 (Figure 2(c)). The peak at 440 cm−1 corresponds to the Zn–O bond vibration. The peaks at 1574, 1403, and 754 cm−1 may correspond to O–O bond vibrations of peroxide ions (O−2). However, the peaks at 1574 and 1403 cm−1 could also arise from the asymmetric and symmetric stretching vibrations of COO− groups from zinc acetate, potentially present in the sample due to the absence of thermal treatment. UV–Vis spectroscopic analysis revealed a maximum absorption peak at a wavelength (λmax) of 210 nm (Figure 2(d)), characteristic of ZnO2NPs. Figure 2(e) shows the zeta potential profile of the nanoparticles measured in a solution with a pH of 6.7, where an average value of 18.4 was obtained.
4.2. Disk Diffusion Test
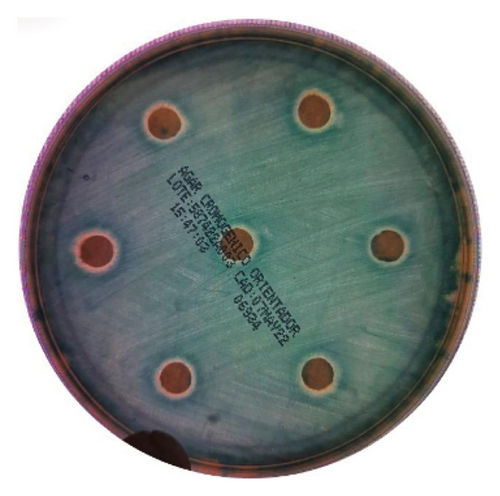
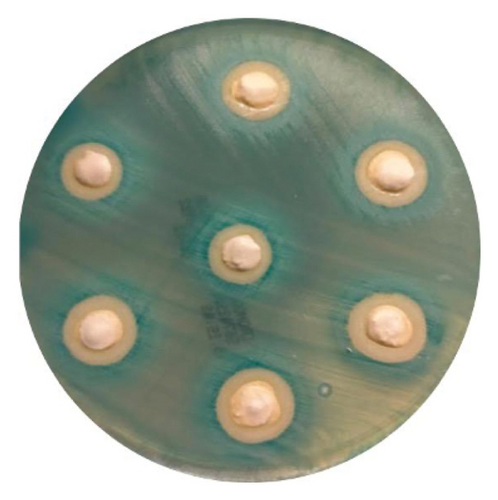
The intracanal medications tested were AgNP gel, ZnO2NP gel, and Ca(OH)2. Each medication was tested with 28 replicates, measuring the zones of inhibition for Enterococcus faecalis growth. The ZnO2NP gel demonstrated the largest bacterial growth inhibition zone, followed by calcium hydroxide, while the AgNP gel showed the smallest inhibition of bacterial growth (Table 1, Figure 3).
| Group | Mean (mm) | Standard deviation (mm) | p value |
|---|---|---|---|
| ZnO2NP | 15.2143 | 1.0313 | < 0.001 |
| Ca(OH)2 | 10.2857 | 0.5998 | |
| AgNP | 8.1786 | 0.6118 | |
| Comparison | pvalue | ||
| AgNP vs Ca(OH)2 | < 0.001 | ||
| AgNP vs ZnO2NP | < 0.001 | ||
| Ca(OH)2 vs ZnO2NP | < 0.001 | ||
4.3. Antibacterial Microdilution Assay
This assay evaluated AgNPs gel, ZnO2NPs gel, and Ca(OH)2. A total of 20 replicates were performed for each medication, and the absorbance of each group was measured to quantify bacterial growth inhibition. E. faecalis in Tryptic Soy Agar was used as a positive control, and Tryptic Soy Agar was used as a negative control. The ZnO2NP gel demonstrated lower absorbance, indicating a higher antibacterial capacity, followed by calcium hydroxide, with the AgNP gel being the least effective. Additionally, higher concentrations of the nanoparticles corresponded to greater bacterial growth inhibition (Table 2).
| Group | Mean (absorbance) | Standard deviation | p value |
|---|---|---|---|
| ZnO2NP | 0.37 | 0.01 | < 0.001 |
| Ca(OH)2 | 0.41 | 0.00 | |
| AgNP | 0.44 | 0.01 | |
| Comparison | pvalue | ||
| ZnO2NP vs CaOH2 | < 0.001 | ||
| ZnO2NP vs AgNP | < 0.001 | ||
| CaOH2 vs AgNP | < 0.001 | ||
4.4. Results of Ex Vivo Experiments
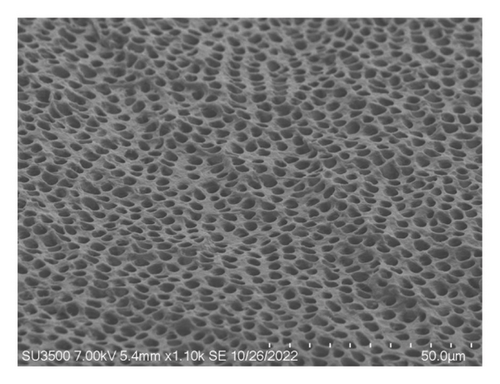
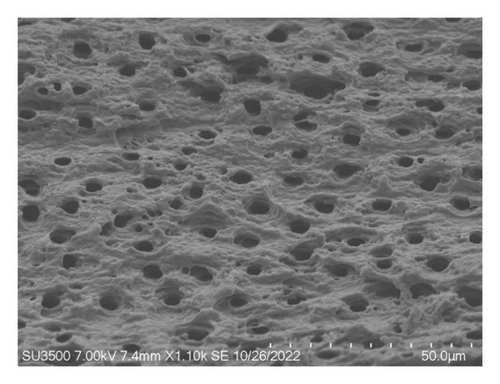
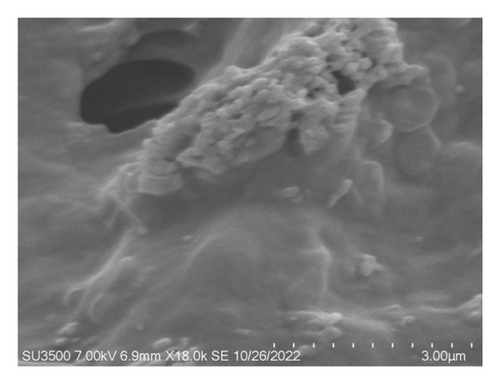
Figure 4(a) shows a highly organized dentinal surface with open and well-defined tubules, indicating effective cleaning. Figure 4(b) presents a rougher texture with partially obstructed tubules by smear layer. Figure 4(c), at higher magnification, reveals debris covering the dentinal surface, potentially blocking some tubules. Following ZnO2NP treatment, prominent red fluorescence was observed, indicating a significant number of dead cells. This indicates that the nanoparticles effectively eradicate biofilm bacteria. Ca(OH)2 treatment also resulted in significant red fluorescence, reflecting a substantial number of dead cells. This demonstrates that calcium hydroxide has notable antimicrobial effects but appears to be less effective than ZnO2NPs. Lastly, in the AgNP treatment, the red fluorescence is present but not as dominant, indicating that AgNPs exhibit lower antimicrobial efficacy than both ZnO2NPs and calcium hydroxide. In summary, live/dead staining results demonstrated that ZnO2NPs exhibited the highest antimicrobial activity, followed by calcium hydroxide, with AgNPs showing the lowest effectiveness among the three treatments (Figures 4(d) and 4(f)).
5. Discussion
Various materials have been explored as intracanal medications in endodontics to achieve effective disinfection. However, none exhibit the ideal combination of low toxicity, high efficacy against resistant microorganisms, and ease of placement and removal from the RCS [25]. Therefore, the exhaustive search for these properties has resulted in the use of new technologies, including nanotechnology, which encompasses ZnONP, ChNP, AgNP, and our proposed ZnO2NP. Calcium hydroxide (Ca(OH)2) is considered the gold standard intracanal medication in endodontics. This study compared the effects of ZnO2NP gels and AgNPs to Ca(OH)2 [26].
This study demonstrated that ZnO2NPs in gel form were more effective as an intracanal medication compared to calcium hydroxide and AgNPs in diffusion, dilution, and confocal laser microscopy models. Among the calcium hydroxide and AgNP groups, AgNPs were the least efficient. This may be attributed to nanoparticle size, which plays a critical role in antimicrobial efficacy; smaller nanoparticles are generally more bactericidal. The AgNPs in this study had an average size of 80 nm [27]. Additionally, our AgNPs had a negative charge, and it has been previously reported that positively charged AgNPs exhibit the highest antimicrobial activity against endodontic bacteria [28].
We believe that these differences in results are not only due to size; different types of synthesis, charge, and storage time should also be considered because, over time, AgNPs tend to agglomerate, leading to changes in their specific physicochemical properties and, consequently, their antibacterial activity [29, 30]. Another factor to consider is the model in which the experiments were conducted since they have not been standardized in the field of endodontics, and each author arbitrarily determines the conditions under which the assays are performed. Many of these studies do not include characterizations, making it very difficult to reproduce and compare them [31].
A possible explanation for our finding that ZnO2NP gel showed greater antimicrobial activity compared to AgNPs and calcium hydroxide as intracanal medication may be due to the fact that the primary antibacterial mechanism of zinc nanoparticles is considered to be the production of ROS[32]. Bacteria generally find it challenging to develop resistance to high levels of ROS, as ROS target multiple bacterial cell structures [33]. In fact, strategies based on ROS are now being considered for controlling resistant infections, for example, inhibiting bacterial antioxidant systems. It has been shown that altering the genes responsible for synthesizing bacterial antioxidant proteins makes them more susceptible to high levels of ROS [34, 35]. Another mechanism is the depletion of metal ions present in bacteria, such as manganese (Mn2+) and zinc (Zn2+), which function as cofactors for the proper functioning of bacterial antioxidant enzymes [36]. The inhibition of the synthesis of extracellular substances, such as the pigment staphyloxanthin in S. aureus, which provides some resistance to ROS, could also be employed [37].
The primary mechanism of action for the AgNPs gel synthesized in this study is likely the release of silver ions, as most nanoparticles were confined within the gel matrix [38]. The silver ions subsequently interact with cellular structures such as the membrane, proteins, DNA, and signaling pathways and even generate ROS, which cause bacterial death [39].
Recent studies report that bacteria can neutralize silver ions released by nanoparticles [40]. For example, it has been reported that the bacterium Microcystis aeruginosa has the ability to produce an extracellular matrix with a special capacity to capture the silver ions released by nanoparticles [41]. Furthermore, it has also been reported that silver nanoparticle–resistant E. faecalis is capable of producing an extracellular matrix similar to the one mentioned above [42].
It has also been reported that heavy metal efflux pumps are involved in expelling silver ions from the bacterial cell, preventing them from damaging the internal structures of the bacteria. Recently, it was reported that silver nanoparticle–resistant E. faecalis has heavy metal efflux pumps such as the copper transporter CopA and the Heavy Metal Translocating P-type ATPase [42]. A high prevalence of genes encoding silver efflux pumps was also recently reported in bacterial samples isolated from secondary endodontic infections [43].
Silver nanoparticle–resistant E. faecalis also showed an increase in the activity of genes and proteins responsible for inactivating ROS [42]. However, it is likely that zinc dioxide nanoparticles have a higher rate of ROS production compared to AgNPs and that this elevated concentration was sufficient to overcome the defenses of E. faecalis (ATCC 29212) against ROS [44]. The strong capacity of zinc dioxide nanoparticles to generate ROS has already been demonstrated previously [45]. The mechanisms of bacterial resistance to the antibacterial activity of various types of nanoparticles have been studied recently; however, their study in endodontic bacteria is scarce [46]. It has also been reported that obligate anaerobes, facultative anaerobes, and microaerophilic bacteria have few defense mechanisms against ROS [47], and these types of bacteria are the main constituents of endodontic microbiota [48, 49].
Another advantage of ZnO2NPs compared to AgNPs is their “amphoteric” property. This means that zinc can interact with acids or bases, forming zinc salts or zincate complexes, respectively. This characteristic could potentially increase the antibacterial activity of zinc oxide or peroxide nanoparticles by allowing them to interact with and damage a wide range of bacterial cell structures [50]. For example, Toledano et al. evaluated the antimicrobial activity of polymeric nanoparticles supplemented with doxycycline, calcium, and zinc. The authors reported that the nanoparticles with the greatest activity were those supplemented with doxycycline, followed by zinc and calcium. However, the authors also mention that doxycycline has been reported to have amphoteric properties [51].
Another advantage is that zinc is an essential element for humans, so zinc oxide and its nanoparticles along with manganese and titanium dioxide nanoparticles, are considered safe by the Food and Drug Administration (FDA 2011) US Code of Federal Regulations (Title 21-CFR 182.8991) [52]. This seems to align with the recent applications of ZnO2NPs for preventing wound infections and combating peri-implantitis in periodontal treatments [53, 54]. This is not the case for AgNPs, which are considered to potentially cause toxicity much more easily due to their accumulation in the body and the environment [55, 56].
As previously mentioned, according to the literature review conducted by the authors of this study, there are few studies evaluating the synthesis of gels with nanoparticles as intracanal medications. However, recently, Berrio et al. reported the synthesis of gels supplemented with silver and copper nanoparticles as intracanal medication. Silver nanoparticle gels at a concentration of 0.3 and 0.5 M had the highest antimicrobial activity. Additionally, the characteristics of the gels that contributed to improving their antibacterial activity were high dissolution, high viscosity, low surface roughness, and low porosity [57]. On the other hand, Roig et al. synthesized a gel loaded with calcium hydroxide nanoparticles that was also thermosensitive and exhibited both a liquid and elastic phase depending on the temperature. Other important characteristics of this gel were its great penetration into dentinal tubules and its good biocompatibility [58].
Marín-Correa et al. synthesized gels supplemented with two different concentrations of AgNPs (300 and 500 μg/mL). The authors reported that both gels had the same antimicrobial activity as calcium hydroxide [59].
Samiei et al. synthesized gels supplemented with zinc oxide nanoparticles and a combination of zinc oxide nanoparticles and AgNPs, compared to a mixture of calcium hydroxide and chlorhexidine. According to their results, the combination of calcium hydroxide and chlorhexidine had greater antibacterial activity compared to the gels supplemented with nanoparticles [60].
This study offers valuable insights into the antimicrobial properties and potential applications of ZnO2NPs as intracanal medication in endodontics. However, several limitations warrant further investigation. Future research should incorporate in vivo experiments to evaluate the behavior, safety, and efficacy of ZnO2NPs under clinically relevant conditions. The absence of long-term stability assessments is another limitation. Factors such as nanoparticle aggregation, degradation, and changes in ROS release could affect performance over time. Long-term stability studies under varied environmental conditions would be critical for determining storage protocols and shelf-life.
Furthermore, while the antimicrobial activity of ZnO2NPs was highlighted, the potential for functionalization to enhance targeting, biocompatibility, or ROS release was not explored. Investigating surface modifications could optimize their application. The study also does not comprehensively evaluate the toxicity of ZnO2NPs at different concentrations, which is necessary to identify the therapeutic window balancing efficacy and safety. Although batch-to-batch reproducibility was considered, a deeper analysis is required to ensure consistency in nanoparticle size, charge, and purity, as variations could affect their performance. Comparisons were limited to calcium hydroxide and AgNPs, including other intracanal medications like chlorhexidine or triple antibiotic pastes could provide a broader context for evaluating ZnO2NPs. Addressing these limitations in future research will enhance the understanding of ZnO2NPs and their potential as a novel intracanal medication [61].
6. Conclusion
The gel supplemented with ZnO2NPs demonstrated greater antimicrobial activity compared to the gel supplemented with AgNPs and calcium hydroxide. This could be explained by the high capacity of ZnO2NPs to generate ROS that could be overcoming the defenses of the evaluated bacteria.
Conflicts of Interest
The authors declare no conflicts of interest.
Funding
No funding was received for this research.
Open Research
Data Availability Statement
The data that support the findings of this study are available on request from the corresponding author. The data are not publicly available due to privacy or ethical restrictions.


