The Composite of Activated Carbon/Magnetic Iron Oxide: Synthesis, Isothermal, and Kinetic Studies of Ciprofloxacin and Tetracycline Adsorption From a Binary-Component Solution
Abstract
The composite of activated carbon/magnetic iron oxide (AC/Fe3O4) is in situ prepared from AC derived from rice husk and the mixture of ferrous and ferric salt solutions in the present study. The obtained material is examined for phase composition, surface area, morphology, elemental composition, and oxidation state by modern physicochemical methods. The highly effective adsorption for ciprofloxacin and tetracycline from a binary-component solution of the composite is demonstrated. For the isotherm study of the adsorption, the extended Langmuir, the Langmuir model using P-factor, the Langmuir, Freundlich, and Sips models according to the ideal adsorbed solution theory are employed to evaluate the data. The maximum adsorption capacity according to the extended Langmuir model is 63.57 mg/g for ciprofloxacin and 74.98 mg/g for tetracycline in a binary system. Akaike’s information criterion (AIC) is used to determine the best model instead of the determination coefficient (R2). Ho’s second-order kinetic model is confirmed to be a better description of the kinetic data than Lagergren’s first-order model. Based on the Weber–Morris intraparticle diffusion model, the diffusion of ciprofloxacin and tetracycline inside the composite capillary is indicated as the step determining the rate of the adsorption. The mechanism of the adsorption is proposed.
1. Introduction
As far as we know, the amount of environmental pollutants has increased because of the rapid development of industries. Therefore, human diseases continuously increase due to the accumulation of toxins in the human body over time. This also means the enhancement of demand for medicines, especially antibiotics. Ciprofloxacin (CIP) and tetracycline (TET) are two common antibiotics that can kill both gram-positive and gram-negative bacteria, beta-lactam or aminoglycoside [1, 2]. Currently, the excessive use of antibiotics has enhanced antibiotic residues in the aquatic environment and the accumulation of them in organisms living in this environment. In addition, the aquaculture industry also uses a large amount of antibiotics. As a result, people are increasingly exposed to antibiotics. Antibiotic resistance is also one of the concerns. In Vietnam, antibiotic residue is about 0.25 μg/L in aquaculture wastewater and more than 50 μg/L in medical wastewater [3]. Obviously, the treatment of antibiotic residue in the aquatic environment is an urgent problem. Scientists applied and developed many ways to remove antibiotics from water such as adsorption [4, 5], using osmotic membranes [6, 7], oxidation [8, 9], or photocatalysis [10, 11]. Among them, adsorption is confirmed to be one of the effective, cheap, and suitable methods for green chemistry by using environmentally friendly adsorbents [4, 5, 12].
Activated carbon (AC) is well known as a fast and effective adsorbent of colorants, odors, and heavy metals from aqueous solution due to its extremely large surface area [13–15]. The natural sources used for the synthesis of AC can be agricultural waste such as rice husk (RH) [16, 17], bagasse [18, 19], coconut coir [20, 21], sawdust wood [22, 23], walnut shell [24, 25], and palm kernel shell [26]. Among them, RH is one of the largest wastes in agricultural countries. In Vietnam, it is very easy to find RH everywhere in the countryside during and after the rice harvest season. Therefore, using RH to synthesize AC not only reduces a large amount of this waste but also creates materials with highly effective treatment of antibiotics. However, AC is often very fine and strongly dispersed in solution, leading to some obstacles when recovering the material after treatment [27, 28].
An interesting suggestion noticed by many scientists is the combination of AC with a magnetic material such as Fe3O4 nanoparticles [27–31]. Fe3O4 nanoparticles not only have a rather large surface area enhancing the adsorption capacity of the obtained composite, but also have strong magnetization that is helpful for trapping pollutants and separating the adsorbent from the solution [32]. In addition, the synthesis of Fe3O4 nanoparticles is quite simple and their toxicity to the environment is very low. However, Fe3O4 nanoparticles are easily oxidized on the surface, thus reducing their magnetism. They are also easily agglomerated due to magnetism, which greatly reduces the surface area, limiting their application. Therefore, modifying the surface of Fe3O4 with other materials such as AC is also an effective solution.
According to our best knowledge, some previous studies focused on the synthesis and employment of AC/Fe3O4 composite for the removal of dyes such as methyl orange [29], methylene blue [33, 34], methylene blue and methyl violet [35], rhodamine B [36], methylene blue, malachite green, and cango red [37]; heavy metals such as Cr(VI), Cu(II), Cd(II) [38], and Cr(VI) [39]; or antibiotics such as metronidazole [40], ceftriaxone [41], and cefazolin [42]. The single-component solutions of TET [43] and CIP [44] have also been noted to adsorb onto AC/Fe3O4 composite. However, the influence and interaction between antibiotics in multicomponent solutions during the adsorption process have not been paid attention to. In particular, the research on the removal of CIP and TET from binary-component solutions is limited. The isothermal investigation of binary-component adsorption of CIP and TET onto AC/Fe3O4 composite using different isotherm models including extended Langmuir (EL) isotherm, P-factor Langmuir models, and ideal adsorbed solution theory (IAST) has not been carefully considered. The mechanism of the adsorption of CIP and TET from a binary-component solution has not been clarified.
Herein, for the first time, the simultaneous adsorption of CIP and TET antibiotics onto AC/Fe3O4 composite is observed, in which Fe3O4 nanoparticles are in situ formed in the solution containing AC prepared from RH. The EL isotherm, P-factor Langmuir models, and IAST are employed to describe the adsorption isotherm data [45–47]. Kinetic data of the simultaneous adsorption of CIP and TET are evaluated based on Lagergren’s first-order (LFO), Ho’s second-order (HSO) kinetic, and Weber–Morris intraparticle diffusion (IPD) models, and the mechanism of the adsorption is proposed.
2. Experimental
2.1. Materials
All used chemicals are analytical grade (99.99%). The synthesis process of AC/Fe3O4 composite is presented in Scheme 1. RHs were collected in Phu Thuong ward, Hue city, Thuan Hoa district, Vietnam. After being washed with water, RHs were dried and calcined at 400°C for 3 h to obtain rice husk ash (RHA). The amount of silicon was removed by soaking RHA in NaOH (China, PA) solution before synthesizing AC. RHA was soaked in NaOH solution with a NaOH/SiO2 molar ratio of 2.5 at 200°C for 30 min and then at normal temperature for 24 h. The solid is filtered, dried, and activated at 700°C for 3 h. Then, it is stirred in an activating agent of HCl (Merck) 0.05 M solution for 12 h. The solid is filtered, dried at 100°C for 24 h, and activated again at 700°C for 3 h to obtain AC.
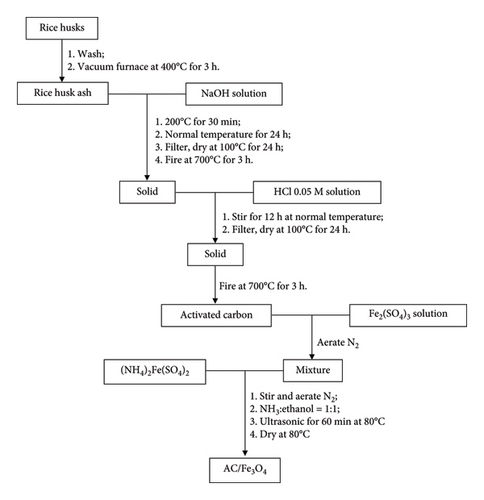
The resulting AC was added to a 250-mL flask containing 50 mL of Fe2(SO4)3 (China, PA) solution with continuous N2 aeration. In this condition, (NH4)2Fe(SO4)2 was added to the above mixture with a defined weight ratio of Fe3O4:AC (w/w). Then, the mixture of NH3:ethanol with a volume ratio of 1:1 (v/v) was added to form Fe3O4 nanocrystals on the surface of AC. The composite was separated from the mixture after that had been under ultrasonic conditions at 80°C for 60 min before and dried at 80°C.
The bonding between functional groups (COO−) on the surface of AC and Fe3+/Fe2+ is formed during the synthesis, resulting in AC/Fe3O4 composite.
2.2. Methods
2.2.1. Characterization of Material
Modern and accurate physicochemical analysis methods including X-ray diffraction (XRD) using RINT2000/PC device (Rigaku, Japan), scanning electron microscopy (SEM) using Hitachi S4800 device (Japan), vibrating sample magnetometry (VSM) on Micro Science Easy VSM 20130321-02 (USA), energy-dispersive X-ray (EDX) on Hitachi S4800 equipment (Japan), the X-ray photoelectron spectroscopy (XPS) using Axis Supra (Japan), and the N2 adsorption and desorption method using a Tristar-3030 system (USA) have been engaged to confirm phase composition, morphology, magnetic saturation, elemental composition, chemical state, and BET surface area of the obtained composite, respectively. The pH drift method mentioned in our previous study is used to determine the point of zero charge (PZC) value [48].
2.2.2. Simultaneous Determination of CIP and TET
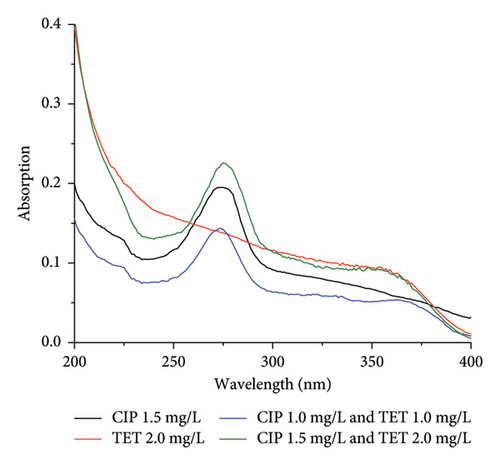
CIP and TET concentrations were simultaneously determined on the Cary 60 UV–Vis (Agilent) equipment by UV–Vis molecular absorption spectrometric at nonoverlapping maximum absorption wavelengths which is 274 nm for CIP and 363 nm for TET (Figure 1). The comparison of the individual spectra of each antibiotic with the spectrum of binary mixture of them confirmed their influence on each other. The quantification of CIP and TET was carried out by the standard addition method. The substrate was the solution with a pH of 7.4 collected after soaking AC/Fe3O4 composite in distilled water.
2.2.3. Adsorption Studies
For the isothermal study, Inam et al. [49] found that two major factors that create the difference between binary-component and single-component adsorption were (i) ion complexation and (ii) competitive adsorption between ion species. Therefore, the isotherm models for a single system are not applicable. The adsorption equilibrium data of CIP and TET onto AC/Fe3O4 composite in the binary system were calculated by different isotherm models including the extended Langmuir model (EL), the Langmuir model using P-factor (P-L), and the Langmuir, Freundlich, and Sips isotherm models according to the IAST-L, IAST-F, and IAST-S, respectively.
The P-factor describes the interaction between components in the system. The antagonistic interaction occurs when the adsorption process of one component is hindered by other components present in system (P-factor > 1); the synergistic interaction occurs when the adsorption is enhanced by the presence of other components in the system (P-factor < 1); and if there are no any interactions between components in the system, the adsorption capacity does not depend or unremarkably depends on the existence of other components in the system, P-factor = 1.
The IAST that was first proposed by Prausnitz and Myers predicts the adsorption isotherms of binary solution based on isotherm data of single-component solution [53].
- 1.
All components in the solution are ideal solutes and adsorbed according to Raoult’s law. Therefore, the concentration of each component in the equilibrium liquid phase is proportional to the mole fraction or mass fraction of its adsorbed phase.
- 2.
The chemical potential of the adsorbed phase and the liquid phase is equal for each component. Therefore, the propagating pressure (Ψ) is constant for all the components.
The value of AIC can be negative or positive. A model with a lower AIC value has a better fit with the empirical data.
3. Results and Discussion
3.1. Characterization of AC/Fe3O4 Composite
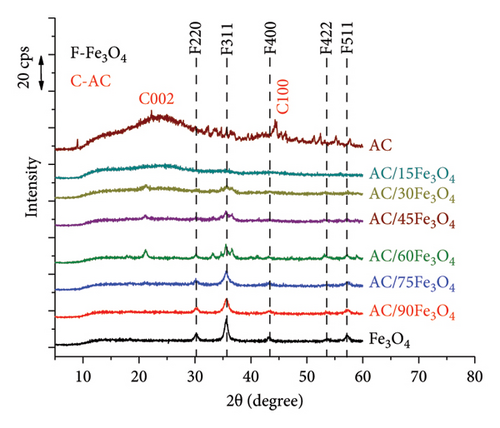
The phase composition of AC/Fe3O4 composite containing different weight percentages of Fe3O4 (15%, 30%, 45%, 60%, 75%, and 90%) is presented in Figure 2(a). All XRD patterns of materials expose the characteristic diffraction peaks at 2θ of 30.4, 35.7, 43.7, 53.2, and 57.2°, corresponding to (220), (311), (400), (422), and (511) lattice faces which demonstrate the spinel structure of the phase of Fe3O4 (JCPDS No 19-0629) [55, 56]. The crystal size of Fe3O4 nanoparticles calculated from the XRD diagram (black line) is around 17 nm which is quite similar to this determined by Juturu et al. [57]. The presence of AC reduces the magnetically induced agglomeration of Fe3O4 nanoparticles, so the smaller crystal size of nanoparticles in the composite is observed around 11 nm for AC/90Fe3O4, 13 nm for AC/75Fe3O4, and 16 nm for AC/60Fe3O4. The lattice constant obtained is 0.8322 nm which meets the standard of magnetic nanoparticles [57]. The intensity of the peaks gradually decreases as the weight percentage of Fe3O4 decreases. For the AC sample, the peak band at 2θ of 24° and the peak band at 2θ of 44.3° corresponding to (002) and (100) lattice faces are characteristic of the amorphous phase of carbon. A sharp and very low peak appears at 2θ of 33.7, corresponding to a small amount of crystalline phase of SiO2 in the RH that has not been completely removed during the soaking of RHA in NaOH [58].
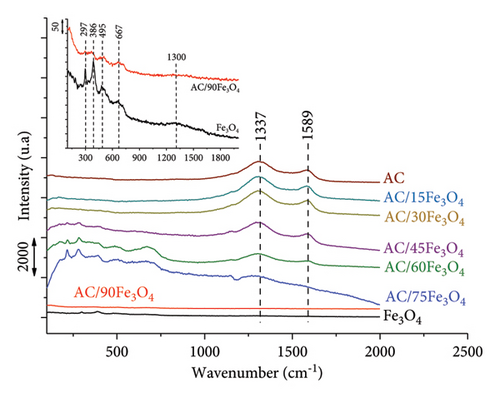
Raman spectra of materials (Figure 2(b)) are recorded to determine the nature of the iron oxide core. Panta and Bergmann pointed out that low laser powers produced weak Raman scattering for nano-Fe3O4 because of the laser-induced phase transition [59]. In the present study, a 785 nm laser (power of 1.2 mW) is used to create the Raman spectrum of the sample. The results in Figure 2(b) show that the main structures of the spectrum are 297, 386, 495, 667, and 1300 cm−1, in which the peak at a wavenumber of 667 cm−1 is characteristic of the Fe3O4 phase, and the remaining peaks are predicted to be characteristic of the γ-Fe2O3 phase because the magnetic iron oxide sample has been oxidized by a high-power laser. This allowed confirmation of the formation of Fe3O4 [59, 60].
For AC materials, the Raman spectrum shows that peak D (D = disorder) at 1337 cm−1 characterizes the presence of amorphous carbon and structural defects. The structure of graphite is shown in peak G (G = graphite) at 1589 cm−1. The level of defects in the material structure is evaluated using the ratio of peak intensity D and G (ID/IG). The larger this ratio is, the higher the level of defects is [61, 62].
With the presence of AC in the composite and the increase in weight percentage of AC (from AC/90Fe3O4 sample to AC/15Fe3O4 sample), the characteristic peaks of AC appear more clearly and the intensity of the characteristic peaks of Fe3O4 gradually decreases. It is found that the ID/IG ratios of AC/Fe3O4 samples are higher than that of AC sample (as shown in Table 1), which confirms that the penetration of Fe3O4 nanoparticles into the pores of AC results in the higher level of defects of AC.
| Samples | ID | IG | ID/IG | Saturation magnetization (emu) | SBET (m2/g) | Pore diameter (nm) |
|---|---|---|---|---|---|---|
| Fe3O4 | — | — | — | 51.97 | 118.0 | 15.6 |
| AC/90Fe3O4 | — | — | — | 41.52 | 131.6 | 6.6 |
| AC/75Fe3O4 | — | — | — | 38.02 | 226.2 | 5.1 |
| AC/60Fe3O4 | 312 | 204 | 1.53 | 36.56 | 262.5 | 3.5 |
| AC/45Fe3O4 | 677 | 494 | 1.37 | 27.13 | 246.6 | 3.9 |
| AC/30Fe3O4 | 654 | 586 | 1.11 | 12.41 | 370.1 | 2.2 |
| AC/15Fe3O4 | 653 | 523 | 1.24 | 6.83 | 407.7 | 2.7 |
| AC | 550 | 526 | 1.04 | — | 859.6 | 2.1 |
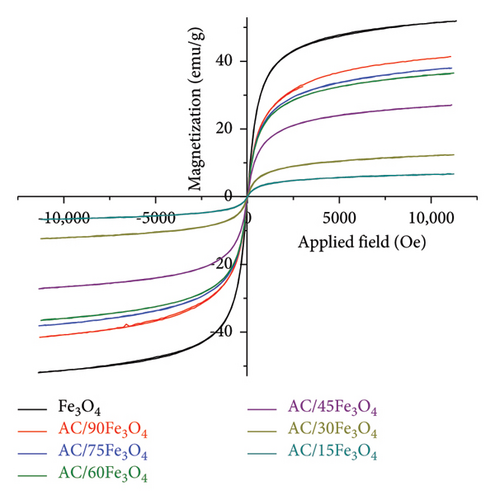
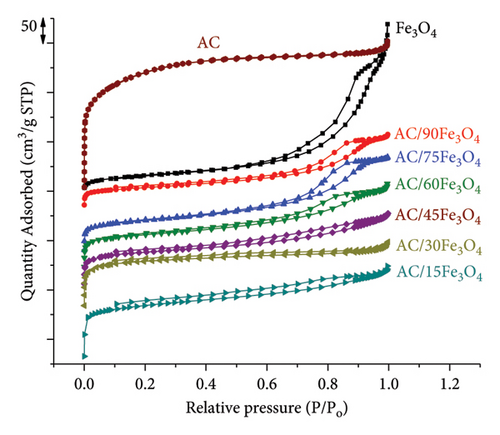
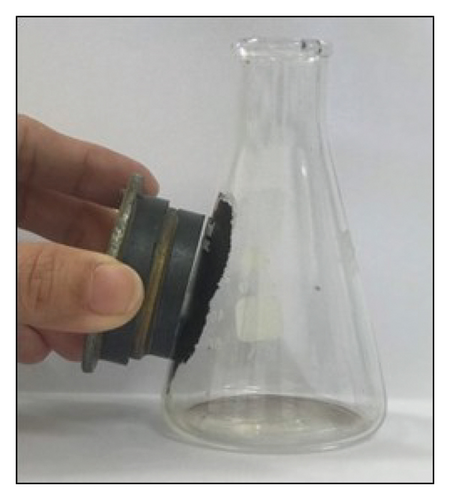
Figure 3(a) shows that Fe3O4 and AC/Fe3O4 materials display superparamagnetic behavior due to the fact that the superparamagnetic curve and hysteresis loop of each material coincide and pass through the origin of the axes [63, 64]. In other words, Fe3O4 and AC/Fe3O4 materials exhibit negligible coercivity and remanence when removing the applied magnetic field [65]. The saturation magnetization of the Fe3O4 material is about 52 emu which is quite higher than that of some previous studies [66–69]. The increase in Fe3O4 weight percentage of AC/Fe3O4 composite from 15% to 90% corresponding to the reduction of the amount of diamagnetic AC resulted in the gradual enhancement of the saturation magnetization from 6.83 to 41.52 emu (Table 1). Figure 4 displays a strong magnetic interaction of AC/75Fe3O4 with a magnet, which means that the separation of the composite from a solution will be very fast and effective. On the contrary, the lowering of the BET surface area of AC/Fe3O4 composites (Table 1) from 407.7 to 131.6 m2·g is observed, which may be due to the filling of AC pores with Fe3O4 nanoparticles. This could underline the formation of the composite structure. The mesoporous structure of the composites is confirmed based on the pore diameter ranging from 2.2 to 6.6 nm [70]. The N2 adsorption and desorption isotherm of AC express that the material exhibits a noncapillary structure. For Fe3O4 and AC/75Fe3O4 composites, hysteresis loops appear which is characteristic of Type IV according to IUPAC classification, indicating the existence of mesoporous material (Figure 3(b)).
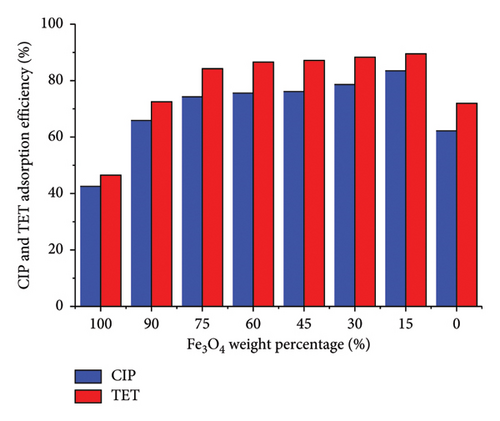
The CIP and TET simultaneous adsorption efficiency of AC/Fe3O4 composites were checked with an initial concentration of each adsorbate of 20 mg/L and adsorbent dosage of 0.4 g/L. The results as shown in Figure 5 present the lowest efficiency of Fe3O4 material (42.5% for CIP and 46.5% for TET). The higher efficiency is obtained for AC/Fe3O4 composites and AC material. By partially replacing Fe3O4 with AC and gradually increasing the AC content, the adsorption efficiency is greatly improved. The rather strong enhancement of efficiency (from 42.5% to 74.3% for CIP and from 46.5% to 84.2% for TET) is observed when 25% (w/w) of Fe3O4 is replaced with AC, and after that, the increase is lighter. More than 83% of CIP and 89% of TET are removed from aqueous solution when replacing 85% (w/w) of Fe3O4 with AC. This confirms that the combination of AC and Fe3O4 increases the adsorption capacity of AC/Fe3O4 composite compared to Fe3O4 material. Although AC material exhibits higher adsorption efficiency than bared-Fe3O4 material, the efficiency is still lower than that of AC/Fe3O4 composite. Besides, compared to AC, the easier separation of the composite after treatment with an external magnetic field is recognized. However, with the aim of overcoming the difficulty in separating AC from solution and the weak adsorption capacity of Fe3O4, the composite of AC/75Fe3O4 exhibits the most significance because the adsorption efficiency is quite high (more than 74% for CIP and 84% for TET) and the solution becomes transparent after being settled in an external magnetic field for only 15 min.
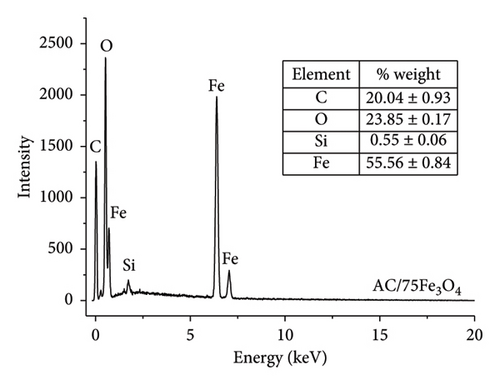
The elemental composition of AC/75Fe3O4 material is presented in Figure 6(a). The results of the weight percent of the main elements which are C, Fe, and O in 3 random material samples (n = 3) are unremarkable different (the standard deviation value of the average value is very small). Their existence suggests that there are no significant contaminants in the obtained composite. The mass percentage of Fe3O4 calculated from the EDX analysis is 76.73% which is in accordance with this value theoretically calculated according to the raw material (75%). This partly confirms the fair distribution between Fe3O4 and AC. Although it is very small, an amount of Si remains in the composite because the Si removal with NaOH missed it in RHA.
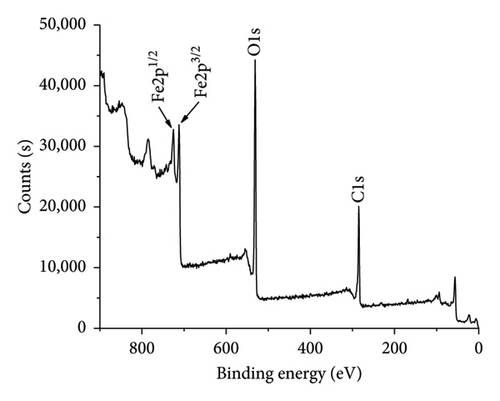
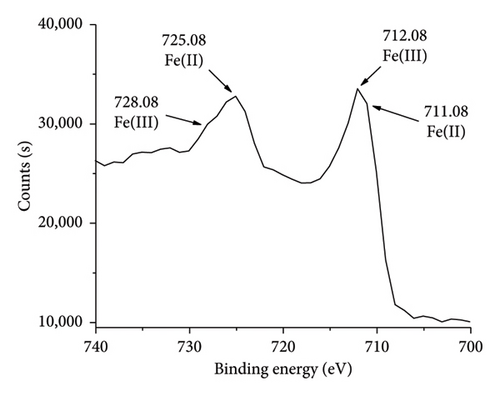
XPS spectrum as shown in Figure 6(b) indicates the elemental and chemical state information of AC/75Fe3O4 composite. Two peaks at 724.78 and 711.28 eV corresponding to the Fe2p1/2 and Fe2p3/2 spin–orbit peaks which are assigned to the presence of Fe3O4 composed of Fe2+ octahedron, Fe3+ octahedron, and Fe3+ tetrahedron. Each peak of Fe2p (Figure 6(c)) contains two peaks corresponding to Fe(II) (711.08 and 725.08 eV) and Fe(III) (712.08 and 728.08 eV). The lattice oxygen at 530.08 eV is attributed to oxygen atoms in the octahedron and tetrahedron lattice. AC is visible in the composite due to the C1s peak at 284.48 eV corresponding to C-C and C=C bonds. All the peaks support the successful anchoring of Fe3O4 nanoparticles onto AC [70]. These results are in an agreement with some reports [71–73]. The atomic percentages of Fe2p, C1s, and O1s found from the XPS analysis are 24.03%, 35.55%, and 40.42%, respectively. These results confirmed the weight percent of Fe3O4 in the composite is 76.82%, which is an agreement with EDX analysis (76.73%).
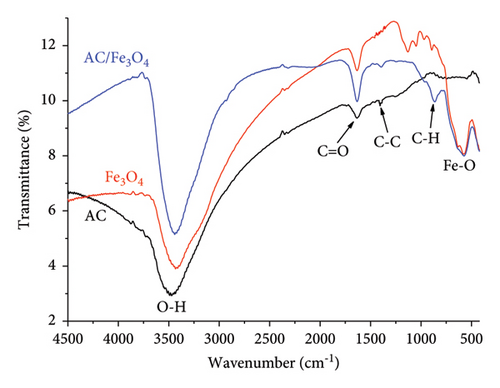
Functional group characteristics on the surface of materials are found on the IR spectra as shown in Figure 7(a). For all materials, a wide peak band associated with OH vibration is observed at the wavenumber around 3400 cm−1 [29, 36]. The appearance of the peaks centered at the wavenumbers of 1641, 1408, and 864 cm−1 indicates C=O, C-C, and C-H vibrations, respectively, on the surface of AC [74, 75] and AC/Fe3O4 composite [35]. The peak at the wavenumber around 550 cm−1 assigned to Fe-O stretching vibration confirms the existence of Fe3O4 in the composite [29, 35, 36].
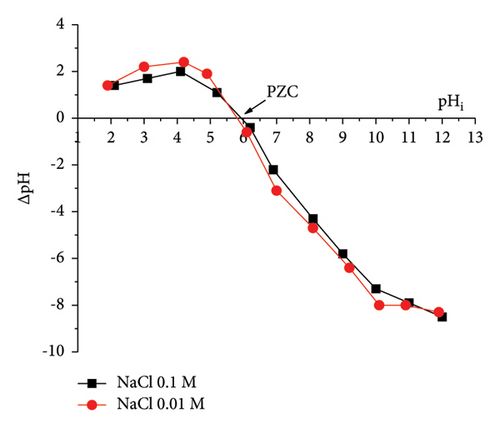
The PZC is one of the important characteristics of the adsorbent. The PZC is the pH value of the solution when the charge of the adsorbent surface is zero. Figure 7(b) shows the data for determining the PZC of AC/75Fe3O4 material. The curves representing the dependence of pHf − pHi on pHi in 0.1 M and 0.01 M NaCl solutions intersect the horizontal axis at pH values of 5.9 and 5.8, respectively. The two intersections obtained are quite close to each other, so pHPZC can be chosen at 5.85. At a pH less than 5.85, anions are adsorbed more strongly than cations (adsorbates). Conversely, at a pH higher than pHpzc, cations are more readily adsorbed.
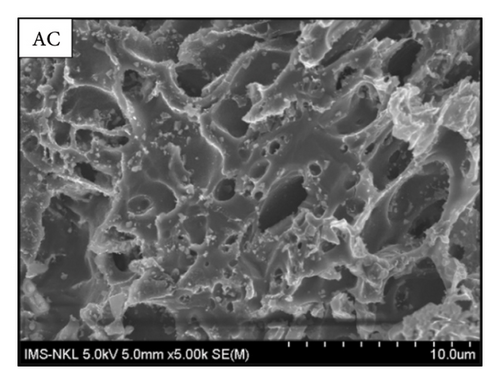
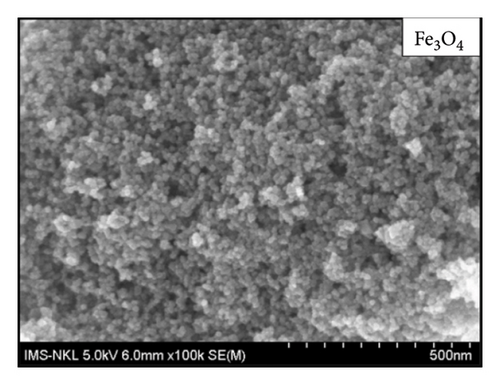
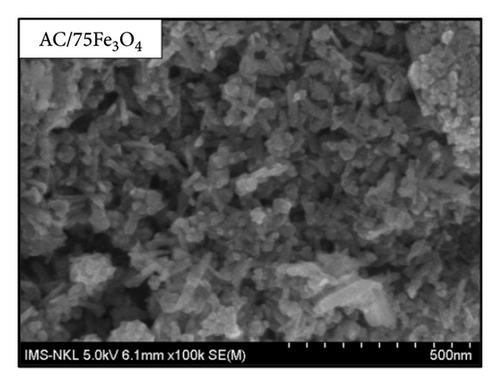
The morphology of materials as presented in Figure 8 shows that spherical Fe3O4 nanoparticles with a uniform size of about 10 nm are distributed on the surface of the AC material which is highly porous.
3.2. Simultaneous Determination of CIP and TET Using UV–Vis Absorption Spectroscopy
The UV–Vis spectra of CIP and TET in the range wavelength from 200 to 400 nm are presented in Figure 1. In the single-component solution with the desired concentrations of CIP of 1.5 mg/L and TET of 2.0 mg/L, the experimental concentrations measured by UV–Vis absorption spectroscopy are 1.45 and 1.97 mg/L. These results are quite consistent with the concentrations of CIP and TET determined in the binary-component solution which are 1.57 and 2.08 mg/L, respectively. As can be seen, the determined concentrations of CIP and TET in the binary-component solution increase slightly compared to the single-component solution. Therefore, it can be considered that the effect of each antibiotic on each other’s UV–Vis spectrum is negligible.
| pH | CIP concentration (mg/L) | TET concentration (mg/L) | ||||||||
|---|---|---|---|---|---|---|---|---|---|---|
| UV–Vis spectroscopy | HPLC | tTN | UV–Vis spectroscopy | HPLC | tTN | |||||
| 3 | 7.02 | 7.11 | 7.09 | 6.90 | 2.63 | 8.37 | 8.21 | 8.26 | 8.48 | 1.74 |
| 5 | 4.71 | 4.65 | 4.66 | 4.60 | 1.65 | 5.58 | 5.56 | 5.54 | 5.52 | 1.63 |
| 7 | 2.25 | 2.11 | 2.13 | 2.32 | 1.50 | 1.10 | 1.21 | 1.14 | 1.15 | 0.32 |
| 9 | 2.67 | 2.35 | 2.43 | 2.71 | 0.98 | 4.42 | 4.29 | 4.30 | 4.48 | 1.44 |
| 11 | 5.09 | 5.12 | 5.11 | 5.18 | 2.64 | 8.37 | 8.28 | 8.29 | 8.47 | 2.31 |
Three experimental turns are set with prespiked concentrations of 1.07, 0.53, and 1.03 mg/L for CIP and 1.02, 2.02, and 1.46 mg/L for TET, respectively. The spiked concentrations of CIP and TET in the two first turns are 0.50 and 1.00 mg/L, while, for the third turn, both CIP and TET are spiked with the content of 1.00 mg/L. The postspiked concentrations are found at 1.61, 1.01, and 2.02 mg/L for CIP and 2.07, 2.94, and 2.43 mg/L for TET. These results demonstrate the values of recovery in 3 turns of the experiment are in the required range which is from 90% to 110%, which confirms the accuracy and precision of the method.
The texp value is compared with the theory value (ttab) looked up from the table at reliability P of 0.05 and degrees of freedom f = n − 1 (n is the number of experimental values measured by the UV–Vis method). The results as shown in Table 2 show that all of texp values are lower than ttab at P of 0.05 and f of 2 (2.920), which confirms that the experimental values of the UV–Vis absorption method are reliable. In other words, the UV–Vis spectroscopy exhibits high accuracy in simultaneously determining CIP/TET content.
3.3. Simultaneous Adsorption of CIP and TET Onto AC/Fe3O4 Composite
3.3.1. Effect of pH
The results show that with the initial CIP and TET concentrations of 20 mg/L and the AC/75Fe3O4 composite dosage of 0.4 g/L, the simultaneous adsorption efficiencies of CIP and TET strongly increase (from 53.4% to 88.3% for CIP and from 52.3% to 94.4% for TET) according to the rising of pH from 2 to 7 and 8, then gradually decrease from pH 8 to 12. CIP and TET (Figure 9) exhibit two and three pKa values including 5.9 and 8.9 for CIP [77] and 3.3, 7.8, and 9.6 for TET [78]. CIP shows a zwitterionic functional group (CIPH+−) in the pH from 5.9 to 8.9. In a solution with pH lower than 5.9 and higher than 8.9, CIP molecules exist as CIPH2+ and CIP− ions, respectively. TET molecules have a neutral charge (TETH2+−) at pH from 3.3 to 7.8, and in the case of pH from 7.8 to 9.6 and higher than 9.6, TETH− and TET2− are dominant, respectively. In contrast, TETH3+ ions are prevalent. The species of CIP and TET affect their adsorption capacity on the material.
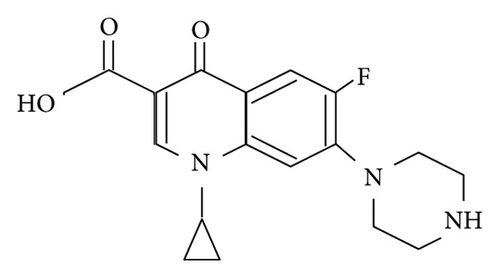
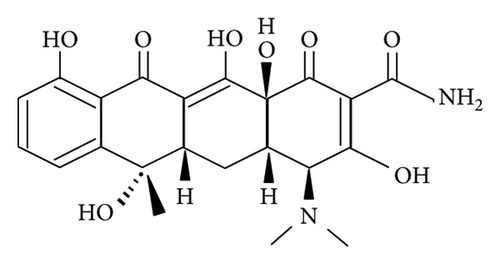
With a pH lower than 5.9 (pHPZC of the adsorbent) (Figure 7(b)), the protonated surface of AC/75Fe3O4 composite hinders the accessibility of positive ions such as CIPH2+ and TETH3+, resulting in low adsorption ability. However, the increase of pH from 2 to 6 tends to the downtrend of positive charge on the surface of the material which enhances the attraction of positive ions to the surface of the adsorbent. That means the adsorption of CIP and TET is more favorable. Then, the adsorption efficiency of CIP and TET decreases at a pH higher than 8. The reason is that the negative surface of material creates a repulsive interaction with negative ions including CIP−, TETH−, and TET2−. It is found that the higher the pH is, the stronger the repulsive force is. In a neutral (pH of 7) or slightly alkaline (pH of 8) solution, the adsorption is maximum due to the negligible resistance of the material surface to zwitterionic functional groups (CIPH+− and TETH2+−). The highest adsorption efficiency reached about 86%–88% for CIP and 93%–94% for TET.
3.3.2. Effect of Adsorbent Dosage
In the binary-component solution containing 20 mg/L of each antibiotic, with the presence of AC/75Fe3O4 composite at a dosage of 0.6 g/L−1, approximately 87% of CIP and 93% of TET were removed from the solution. When using a dosage of 0.8 g/L or more, both CIP and TET adsorption efficiencies reach 99%.
3.3.3. Adsorption Isotherm Study
Two antibiotics including CIP and TET are isothermally adsorbed in a binary solution. The experimental data are evaluated using different isothermal models including EL P-L; and IAST-L, IAST-F, and IAST-S as shown in Table 3. As can be seen, except for the IAST-F model, the determination coefficients (R2) of the other isothermal equations are close to 1 (0.982–0.999), which means there is an unremarkable difference between these models, or in other words, it is difficult to determine the model exhibiting best agreement with experimental data. Therefore, the Akaike parameter is more suitable for comparing the models with different parameters. Comparatively, the smaller the sums of AIC of both antibiotics are, the better the models fit the data.
| Antibiotics | Extended Langmuir model | |||||
|---|---|---|---|---|---|---|
| (mg/g) | (mg/g) | (mg/g) | R2 | AIC | ||
| CIP | 53.43 | 0.30 | 15.77 | 0.992 | −4.76 | |
| TET | 57.85 | 0.34 | 19.51 | 0.996 | −7.21 | |
| Antibiotics | P-factor Langmuir model | |||||
| (mg/g) | (mg/g) | (mg/g) | R2 | AICs | p | |
| CIP | 40.96 | 0.61 | 24.82 | 0.982 | 6.14 | 1.55 |
| TET | 47.04 | 0.63 | 29.71 | 0.999 | −10.52 | 1.59 |
| Antibiotics | IAST Langmuir model | |||||
| (mg/g) | (mg/g) | (mg/g) | R2 | AIC | ||
| CIP | 26.39 | 0.61 | 15.99 | 0.982 | 6.14 | |
| TET | 29.51 | 0.63 | 18.64 | 0.999 | −10.52 | |
| Antibiotics | IAST Freundlich model | |||||
| aF | bF | R2 | AIC | |||
| CIP | 11.79 | 0.27 | 0.904 | 14.59 | ||
| TET | 13.02 | 0.29 | 0.938 | 3.34 | ||
| Antibiotics | IAST Sips model | |||||
| R2 | AIC | |||||
| CIP | 0.61 | 1.04 | 15.90 | 0.982 | 26.09 | |
| TET | 0.63 | 0.98 | 18.65 | 0.999 | 8.83 | |
As can be seen in Table 3, the smallest sum of AIC is for EL models (−11.97). This confirms that the EL model best describes the experimental data. IAST-L and P-L models exhibit the same AIC sum (−4.38), in which the data of TET adsorption are better described than due to a negative AIC (−10.52), while the positive one is inferred from CIP adsorption data. The next order is the IAST-F model (17.93), and the highest AIC sum is for the IAST-S model (34.92). These results confirm the decrease of compatibility degree between the model and experimental data when using the IAST-L or P-L, IAST-F, and IAST-S models, respectively.
For the single-component adsorption of CIP or TET onto the AC/Fe3O4 composite, the maximum adsorption capacity calculated according to the Langmuir isotherm model was 63.57 mg/g for CIP and 74.98 mg/g for TET. Several other studies have also demonstrated an equivalent maximum adsorption capacity, lower or higher as shown in Table 4. In comparison with single-component adsorption, (i) the maximum adsorption capacity of CIP and TET in a binary system according to all the models is much lower and in descending order as follows: the EL model (53.43 mg/g for CIP and 57.85 mg/g for TET), the P-L model (40.96 mg/g for CIP and 47.04 mg/g for TET), and the IAST-L model (26.39 mg/g for CIP and 29.51 mg/g for TET). This can be explained by the influence of competition between CIP and TET or CIP/TET and adsorption sites in a binary-component system, which can be inferred from p value calculated from the P-L model. Due to p value for both CIP and TET being greater than 1, the adsorption of each antibiotic is hindered by the presence of another in the binary-component solution.
| Material | qm (mg/g) | Reference | |
|---|---|---|---|
| CIP | TET | ||
| AC/75Fe3O4 | 63.57 | 74.98 | The present study |
| PVA/agar/maltodextrin | 36.04 | [79] | |
| Co-doped UiO-66 | 45.17 | [80] | |
| Bentonite | 147.06 | [81] | |
| Fe3O4/red mud nanoparticles | 110.15 | [82] | |
| Fe3O4 nanoparticles | 24.4 | [83] | |
| Activated carbon/Fe3O4 (Fe3O4 synthesized using ultrasonic) | 117.9 | [84] | |
| Magnetic carbon nanocomposite Fe3O4/C | 56.82 | [44] | |
| Fe3O4/C mesoporous | 868.6 | [85] | |
| Fe3O4 nanoparticles | 184.5 | [86] | |
| Fe3O4/activated carbon fiber | 58 | [87] | |
| Chlorella vulgaris carbon modified with Fe3O4 nanoparticles | 26.18 | [42] | |
| Magnetic sugarcane bagasse biochar modified by lanthanum | 122.5 | [88] | |
| AC | 25.28 | [89] | |
| AC-H3PO4 | 30.03 | ||
| AC/Fe3O4 | 45.45 | ||
| ZIF-8 | 51.2 | ||
| AC/Fe3O4/ZIF-8 | 57.47 | ||
| CoO@C | 769.43 | [90] | |
3.3.4. Adsorption Kinetic Study
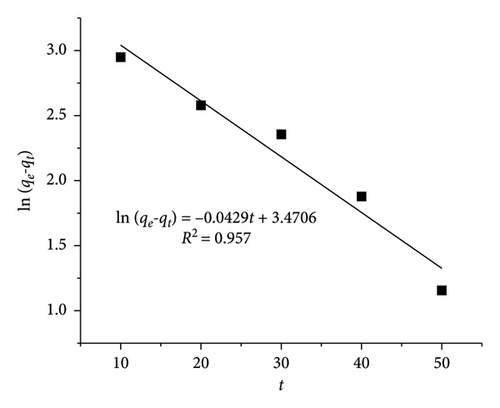
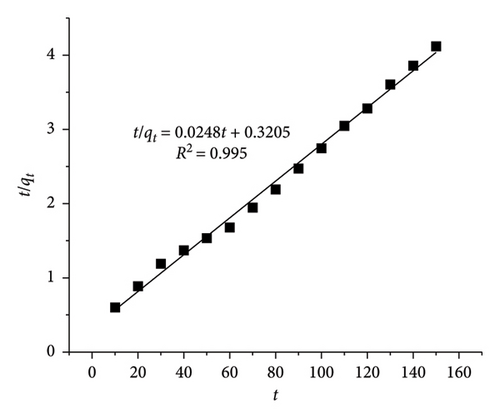
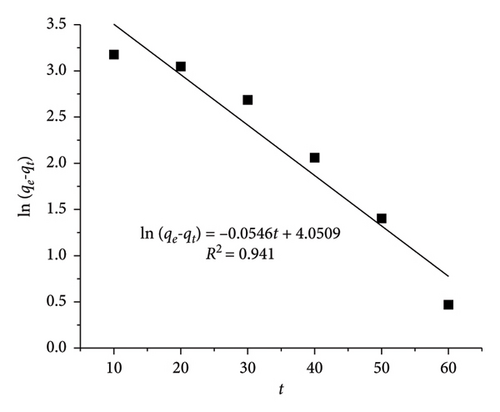
With CIP and TET concentrations of 20 mg/L and an adsorbent dosage of 0.4 g/L, the linear HSO kinetic equation exhibits higher R2 values (0.995 for CIP and 0.991 for TET) than those of the linear LFO kinetic equation (0.957 for CIP and 0.941 for TET). The adsorption capacity calculated from LFO and HSO equations is 32.16 mg·g−1 and 40.32 mg/g for CIP and 57.45 and 47.39 mg/g for TET, respectively, while the experimental adsorption capacity is 35.73 mg/g for CIP and 42.15 mg/g for TET. These results indicate the compatibility between the HSO model with experimental data more than the LFO model. The rate of the adsorption which is the chemisorption process is a function of both adsorbent and adsorbate concentrations.
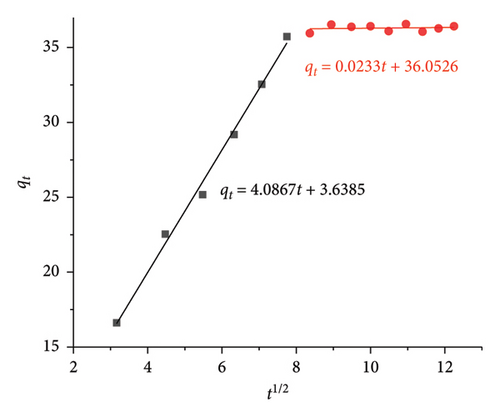
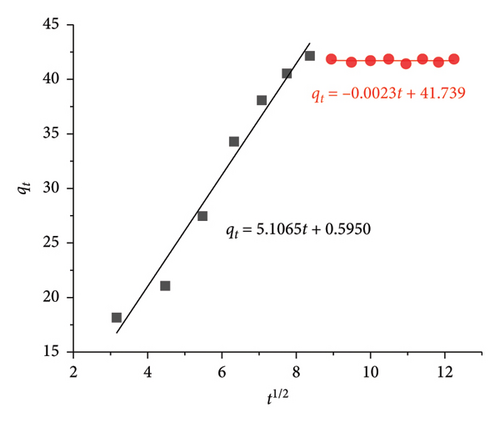
Weber–Morris IPD study depicts the diffusion of CIP/TET through two stages as follows: (i) the first is from the solution to the surface of AC/Fe3O4 particle causing a solution layer (L) which surrounds the particle (kdif 1) and (ii) the second is from the particle surface to its intraparticle capillary (kdif 2). C value in equation (7) is a constant relating to diffusion resistance and characteristic for the thickness of the L layer. A higher value of C means a thicker L layer which will hinder the diffusion of the CIP/TET into the intraparticle capillary of AC/Fe3O4 particle [48].
Figure 10 indicates the C value is very close to zero during the first 60 min of the adsorption process for both CIP (3.639) and TET (0.595), which means a thin layer of CIP and TET surrounding the composite results in the fast movement of CIP/TET molecules passing through this layer. Therefore, a strong uptrend of the adsorption capacity of CIP/TET is observed, while after 60 min, the strong increase in C value (36.053 for CIP and 41.739 for TET) demonstrates the enhancement of the thickness of the L layer, hindering the diffusion of CIP/TET inside the composite capillary. This stage is predicted as a step determining the rate of CIP/TET adsorption. The fact that kdif1 is greater than kdif2 refers to a quick external mass transfer for the first 60 min, after that, a slower internal diffusion takes place.

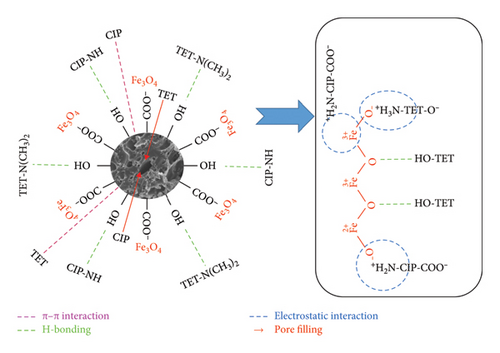
The mechanism of CIP and TET adsorption onto AC/Fe3O4 material can be proposed as shown in Figure 11 [57, 70]. Possible interactions between CIP/TET and the surface of the composite are (i) electrostatic interactions between the amine groups of CIP/TET and negatively charged oxygen atoms of Fe3O4, COO− groups of CIP, and the metal ion of Fe3O4; (ii) H-bonding between OH groups of CIP/TET and O atoms of Fe3O4, OH groups on the surface of AC and N, F atoms of CIP/TET; (iii) π–π interactions between aromatic rings of CIP/TET and the C=C group of AC; and (iv) pore filling of AC with CIP/TET molecules.
4. Conclusions
The composite of AC/magnetic iron oxide was synthesized in an alkaline medium and exhibited effective adsorption for CIP and TET from a binary-component solution. The weight percent of Fe3O4 in the composite was determined at 75%, which exhibits a saturation magnetization of 41.52 emu. A fast and effective separation of the composite from a solution was observed. The EL isotherm model shows a best fit with adsorption data in comparison with the Langmuir model using the P-factor and the Langmuir, Freundlich, and Sips isotherm models according to the IAST. The HSO kinetic model well describes kinetic data of the simultaneous adsorption of CIP and TET. The diffusion of CIP and TET inside the composite capillary is recognized as the rate-determining step based on the Weber–Morris intraparticle model.
Conflicts of Interest
The authors declare no conflicts of interest.
Author Contributions
All the authors equally contributed to the manuscript.
Funding
We are grateful to the Vietnam Ministry of Education and Training for support (Grant No. B2023-DHH-13).
Acknowledgments
We are grateful to the Vietnam Ministry of Education and Training for support (Grant No. B2023-DHH-13).
Open Research
Data Availability Statement
The data that support the findings of this study are available from the corresponding author upon reasonable request.


