Simple Detection of Di-Butyl Phthalate in Aqueous Samples Using UV–Visible Spectroscopy Based on Functionalized Gold Nanoparticles
Abstract
Phthalates are extensively used in water bottles and children’s toys. Therefore, detecting phthalates and their common derivatives in different samples is crucial. Gold nanoparticles had unique photophysical and photochemical properties due to their surface plasmon resonance. Here, we present a facile plasmonic sensor based on surface-modified gold nanoparticles of different shapes, spherical and rods, and these gold nanoparticles are surface functionalized using PEG-COOH and PEG-NH2 ligands. Gold nanoparticles that detect di-butyl phthalate (DPB) concentrations start from 3 × 10⁻¹² to 3 × 10⁻⁵ mol/L in aqueous samples. Adding DPB to functionalized gold nanorods causes an instant shift in the longitudinal surface resonance from 655 to 690 nm. They also show a detection concentration limit of up to 3 × 10⁻¹² mol/L. A higher sensitivity of gold nanorods was noticed compared to the spherical nanoparticles, and the results show absorbance (Δ Abs = 0.57 ± 0 and 0.54 ± 0.007) and good linearity with correlation coefficient values (0.994 and 0.991) using gold nanorods functionalized by PEG-NH2 and PEG-COOH, respectively, upon adding different concentrations of DBP in aqueous samples. The presented plasmonic sensor offers a rapid, sensitive, low-cost, and simple detection method of DBP in laboratory aqueous samples.
1. Introduction
Different pollutants presented in water include toxins, heavy metals, and inorganic and organic compounds. These pollutants affect human health, the environment, and the ecosystem. Therefore, continued monitoring of water pollution is essential. Among organic pollutants, phthalates or phthalic acid esters were initially synthesized in the early nineties by the reaction of alcohol and phthalic anhydride [1–3]. It is commonly used as a plasticizer and additive in different products [4, 5]. Many reports indicated that phthalates esters’ health effects as endocrine-disrupting chemicals that mimic or block endogenous hormones cause reproductive system dysfunction and create toxicity. Phthalate causes endocrine disturbance, nervous system problems, liver malfunctions, and infertility in men and women. It also affects the marine ecosystem [6–9]. Therefore, phthalate esters are the primary concern pollutant in the United States of America, the European Union, and China [10, 11].
Phthalate esters, specifically di-butyl phthalate (DBP), are insensitively used in different industries such as body and face care products [12], industrial plastics [13], medical instruments [14], paints [15], and pharmaceuticals [16]. They are also present in different environmental samples [17] and drinking water [18]. Therefore, continued monitoring of water pollution is critical and necessary. Various methods detect phthalate esters in different samples, such as solid-phase extraction [19] and liquid chromatography [20, 21]. These methods are expensive, time-consuming, and complex and have high detection limits and need trained technicians.
On the other hand, sensors based on colorimetric and fluorometric methods are simple. Sensors have two main functional components: first, the recognition element, which binds explicitly to analytes, and second, the transducer, which gives the signal upon binding the analytes to the recognition element. The efficiency of the sensor depends on response time, detection time, selectivity, sensitivity, response linearity, and reproducibility. The development of a new sensor with a better recognition and transduction process to maximize efficiency is essential. Nanomaterials are used in the recognition elements to improve sensor efficiency due to their unique physical and chemical properties. Among nanomaterials, gold nanoparticles with their unique surface plasmon resonance were reported as sensors for deoxyribonucleic acid (DNA), proteins, amino acids, metals, and pharmaceutical compounds [22–26]. Using nanomaterials to fabricate different nanocomposites to sense different organic pollutants, especially phthalate esters, has increased recently. Nanomaterials have unique physical and chemical properties compared to their bulk material properties. Two main reasons make nanomaterials differ: first, high surface-to-volume ratios, hence the increase in the numbers of dangling bonds; second, the increase of quantum confinement and enhanced electronic band gap and band structures [27].
Metal nanoparticles have surface plasmon resonance properties, which depend on the size and shape of the nanoparticles; hence, they are used for the colorimetric detection of different pollutants [28–31]. Guo et al. used DNA-modified gold nanoparticles to detect diethyl phthalate (DEP), DBP, and di-(2-ethylhexyl) phthalate (DEHP) in aqueous samples, and the samples changed in color from red to blue and they reported a limit of detection of 0.026 ppm, 0.077 ppm, and 0.144 ppm, respectively [32].
Li et al. developed an electrochemical sensor to detect DBP. The electrochemical sensor was synthesized using DBP as a template for molecularly imprinted polymer, and a composite of magnetic graphene oxide and gold nanoparticles was used as the supporting material. The composite has sheets of magnetic graphene oxides and 25 nm spherical nanoparticles. The sensor detects DBP from 2.5 × 10⁻⁹ to 5.0 × 10⁻⁶ mol/L at a linear range. It also shows good reproducibility with a relative standard deviation (SD) of 2.5% for 13 repeated analyses [33].
Thionine-loaded gold nanoparticles composite with platinum is used as an electrochemical immunosensor based on differential pulse voltammetry (DPV) and square wave voltammetry (SWV) response modes for the quantitative determination of DBP. It showed linear ranges of the DPV and SWV modes ranging from 1 pg mL−1 to 1 μg mL−1. The detection limits were 0.486 pg mL−1 (DPV) and 0.711 pg mL−1 (SWV), respectively. Also, it displayed high selectivity, reproducibility, sensitivity, and stability [34].
Enzyme-linked immunosorbent assay (ELISA) was developed to detect DBP. The sensitivity of improved ELISA was enhanced with a low detection limit (L.O.D.) of 4.017 μg/L for DBP, which is about 16 times less than conventional ELISA. The improved sensor also showed high accuracy and reliability. The usage of gold nanoclusters functionalized with Bovine serum albumin as a peroxidase-like catalyst for ELISA was first reported by Zhang et al. [34]. However, in traditional ELISA, horseradish peroxidase (HRP) plays a vital role due to HRP’s low stability, which causes accuracy and limited sensitivity. The modified sensor showed higher sensitivity (L.O.D., 4.017 μg/L) than conventional ELISA and good accuracy and precision with recoveries (85.75%–117.73%) and short measurement time (within 2 h) [35].
Silicon-based molecular imprinted polymer coated a glass electrode for the specific detection of DBP. The glass carbon electrode was modified with multiwalled carbon nanotubes (MWCNTs) and gold nanoparticles (AuNPs) to improve electron transport capacity and detection sensitivity for this modified electrochemical sensor. The cyclic voltametric measurements showed a detection limit of 5.09 × 10⁻⁹ g L−1 [36].
Surface-enhanced Raman scattering of gold nanoparticles was used for sensitive detection of phthalate esters in spiked food samples and food packaging. The aptamer is single-stranded DNA and is used to identify phthalate esters. The detection limit for the sensor was 0.0087 ng/mL and 0.0108 ng/mL [37].
A molecularly imprinted polymer modified the surface of Mn-doped ZnS quantum dots to detect DBP. The fluorescence sensor showed a detection range of 5–50 μmol L−1 with a correlation coefficient of 0.997 [38].
Molecularly imprinted polymer is also used as an active layer in an extended gate field effect transistor (EGFET) to detect DEHP. A low concentration of DEHP was detected, that is, as low as 25 μg/L with high selectivity and sensitivity [39].
Three colored fluorescence sensors were synthesized based on the molecularly imprinted polymer with three blue, red, and green quantum dots. The microemulsion method was used to coat CdSe/ZnS quantum dots in the polymer. The fluorescence sensor showed a wide range of color variations for DBP detection. The fluorescence sensor’s detection shows linear changes at a concentration range of 2.0–20.0 × 10⁻³ μg/L DBP, with a detection limit of 1.0 μg/kg and 0.65 μg/L in fresh and seawater, respectively [40].
A colorimetric sensor was used to detect DBP based on an aggregation of arginine-functionalized gold nanoparticles in Baijiu samples. The color changed from red to blue due to the strong noncovalent interactions between DBP and arginine-functionalized gold nanoparticles. DBP was linearly detected at concentrations of 0.0–2.8 mg L−1, with a correlation coefficient 0.9914–0.9940 and a detection limit of 0.05 mgL−1. When the concentration of DBP is more than 1.0 mgL−1, it can be observed by the naked eye [41].
The multicolor immunosensor was used to detect DBP. The presence of HRP etches gold nanorods (GNRs) at different degrees within 90 s, hence changing color as the longitudinal surface plasmon resonance. The amount of HRP is inversely proportional to the concentration of DBP in the samples in the range of 0.54–9.72 μM, with a detection limit of 76 ngL−1. The change of color of the immunosensor presents a simple method to detect DBP in liquor [42].
Phthalate was detected in cheese powder by cyclodextrin-promoted fluorescence signal change. The signal change depends on the changes in the analyte affinity for the fluorophore and the cyclodextrin cavity. This method detected 15 phthalate esters at a low concentration of 0.12 μM, and the experimental results agreed with the computational model [43].
Stabilized gold nanoparticles with β-cyclodextrin were used to detect butyl benzyl phthalate (BBP). The hydrophobic cavities of β-CD units increase the sensitivity of BBP detection. The detection limit of this modified Raman receptor was 14.9 nM in liquor and rice wine samples. Due to its interaction with BBP, the gold nanoparticle aggregation provides large-volume hotspots and causes a shift in the electromagnetic spectrum [44].
For phthalate sensing using a fluorescence sensor, DEHP molecules enhanced the fluorescence signal through its diffusion through the cave of porous crystalline ribbons formed by the interaction of nitrophenyl groups to a trifluoride molecule. The results showed a limit of detection equal to 0.03 ppb [45].
The surface-enhanced Raman scattering was used to detect phthalates using polydopamine molecularly imprinted as a substrate and anchored gold nanoparticles, eventually forming a three-dimensional structure. The surface-enhanced Raman spectroscopy (SERS) causes enhancement signals up to 1.70 × 10⁷ for dimethyl phthalate (DMP) with a detection limit as low as 1.0 × 10⁻¹⁰ M with high sensitivity and selectivity [46].
Here, we introduce a simple and easy method to detect DBP in water samples using the UV–Vis spectroscopic technique. Two different shapes, spherical and rods, are functionalized using COOH and NH2-thiolated PEG ligands. The functionalized gold nanoparticles effectively sense DBP in aqueous samples at a low detection limit of up to pico mol/L with good linearity.
2. Results
2.1. Characterization of Synthesized Gold Nanoparticles
Figure 1 shows TEM images of different nanoparticles used in this study, spherical nanoparticles (GP) with a surface plasmon resonance peak at 525 nm and a size of (27 ± 3) nm. The UV–Vis absorbance spectrum of GNRs showed a transverse plasmon resonance band at 522 nm and a longitudinal plasmon resonance band at 740 nm. TEM revealed GNRs to have dimensions of (34 × 12 nm ± 4).
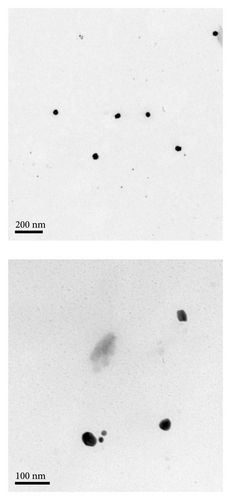
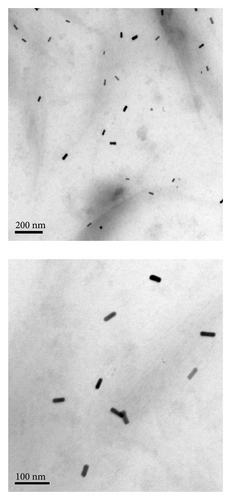
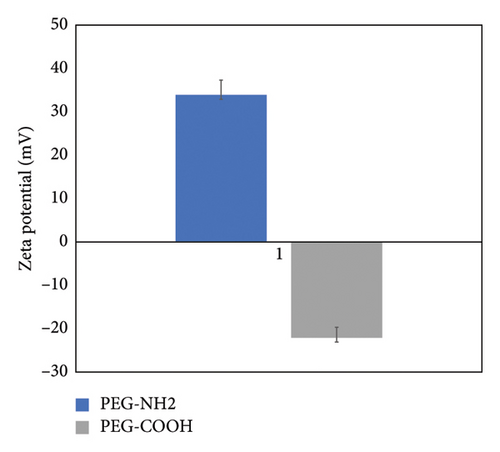
To determine the electrical potential of the gold nanoparticles, colloidal dispersion for the zeta potential was measured. The zeta potential for gold nanoparticles functionalized with thiolated PEG is presented in Figure 2. PEG-NH2 shows a positive charge of 35 mV, and PEG-COOH shows a negatively charged value of −25 mV.
Using gold nanoparticles without changing their surface chemistry did not cause any observed changes in the UV–Vis spectra. Therefore, the modification of the gold nanoparticles’ surface with thiolated PEG was performed to confirm the role of thiolated PEG functionalization in the detection of DBP. The spectra for nonfunctionalized gold nanoparticles (bare GNPs) after adding DBP are shown in Figure 3. No changes were observed in the spectra of bare gold nanoparticles without adding any thiolated PEG.
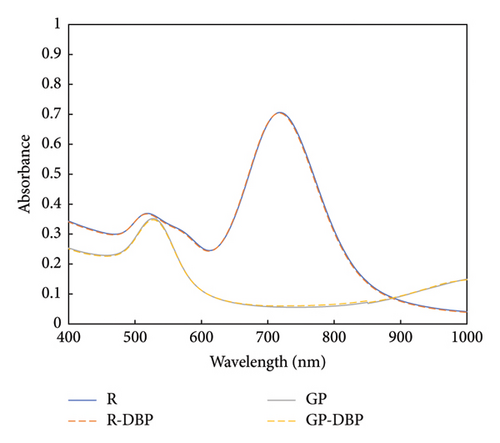
Hence, the specification of the functionalized gold nanoparticles to detect DBP was confirmed, as both gold nanoparticles and GNRs do not show any spectral changes in absorbance or in the position of the surface plasmon peaks upon adding 3 × 10⁻⁵ mol/L.
The change in absorbance upon adding three different concentrations of DBP to functionalized gold nanoparticles with PEG-COOH and PEG-NH2 was tested. Three initial concentrations of DBP were tested (3 × 10⁻⁵, 3 × 10⁻⁸, and 3 × 10⁻¹² mol/L), and the results are shown in Figures 4 and 5.
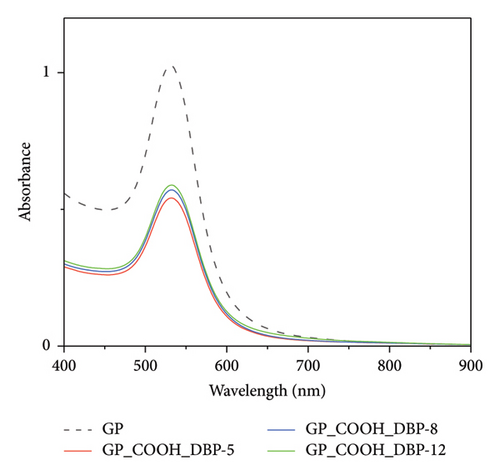
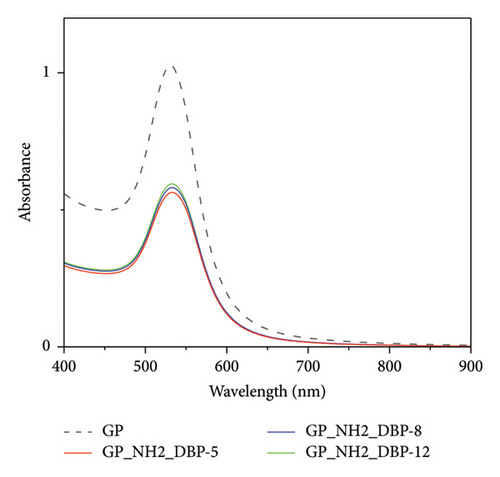
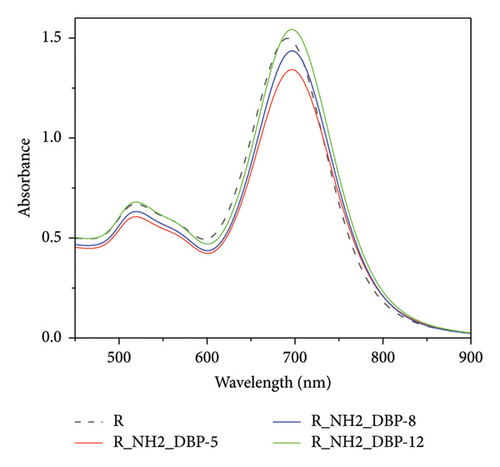
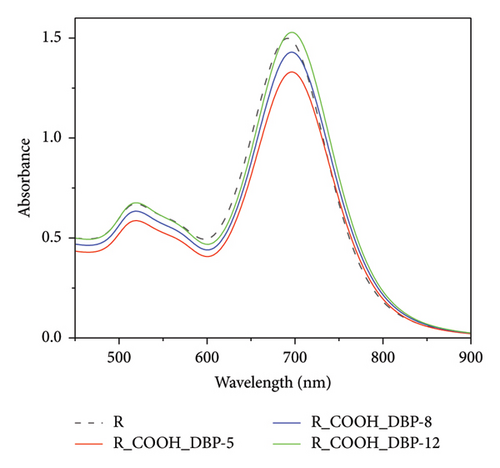
Adding three different concentrations of DBP (3 × 10⁻⁵, 3 × 10⁻⁸, and 3 × 10⁻¹² mol/L) to gold nanoparticles show (Δ Abs = 0.04). A change in absorbance when using GNRs with a value (Δ Abs = 0.2) was observed in the initial set of experiments. Therefore, GNRs were selected to perform further in-depth experiments due to their higher sensitivity (a higher change in the absorbance difference of the surface plasmon resonance peak upon adding different DBP concentrations [3 × 10⁻⁵, 3 × 10⁻⁸, and 3 × 10⁻¹² mol/L]).
From our initial results, we chose GNRs which showed higher sensitivity to any changes in DBP concentration. Therefore, a new series of DBP complete concentrations starting from 10−12 to 10−5 mol/L were performed for GNRs modified with PEG-COOH and PEG-NH2, as shown in Figures 6 and 7. Three sets of UV–Vis experiments were conducted.
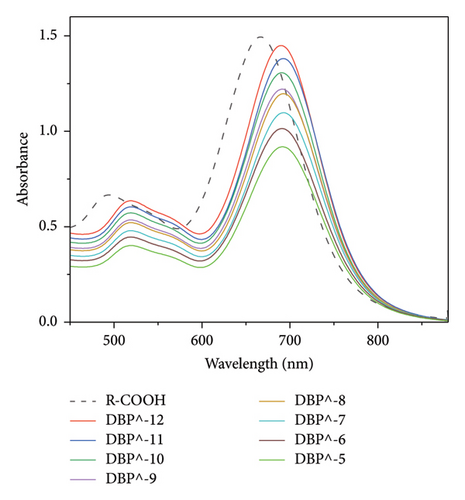
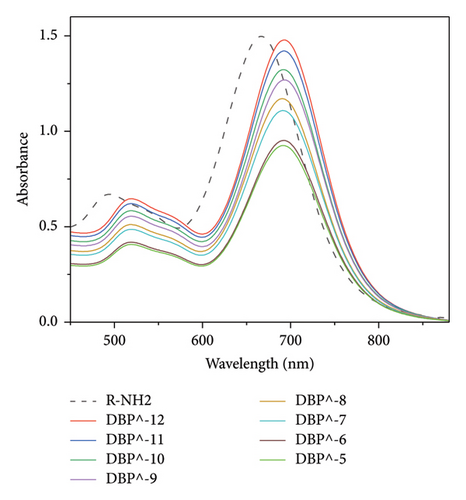
The Uv–Vis spectra show a shift in longitudinal surface plasmon resonance of R-PEG-COOH and R-PEG-NH2 from 665 nm to 690 nm upon the addition of different concentrations of DBP.
When different concentrations of DBP were added to R-PEG-NH2, a higher change in absorbance at 690 nm was observed, from 0.902 at DBP concentration of 10−5 mol/L to 1.475 at DBP concentration of 10−12 mol/L (Δ Abs = 0.573 ± 0). The same behavior was observed for R-PEG-COOH, with a change in absorbance values from 0.906 to 1.449 for DBP concentrations of 10−5 mol/L–10−12 mol/L, respectively (Δ Abs = 0.543 ± 0.007).
The electrical charge of DBP in water is generally neutral, but it can exhibit a slight negative charge due to phthalic acid ions. The zeta potential results shown in Figure 2 confirm that the gold nanoparticles modified with PEG-NH2 exhibit a positive charge and the one modified with PEG-COOH has a negative charge.
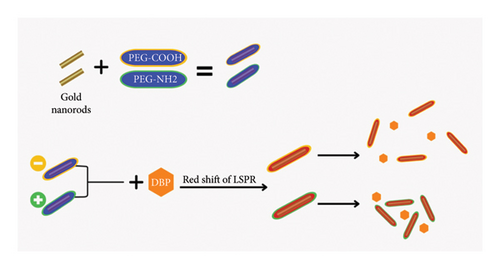
Therefore, the electrostatic forces of positively charged thiolated PEG-NH2 and negatively charged DBP resulted in higher variations in the absorbance of the longitudinal surface plasmon peak with a value of (Δ Abs = 0.573). We assume this electrostatic force decreases the interspace between GNRs and DBP and increases the aggregation to the GNRs as they stick closely together. On the other hand, the GNRs modified with thiolated PEG-COOH have a negative charge resulting in an increase of interspace between GNRs and negatively charged DBP. The suggested mechanism is schematically presented in Figure 8.
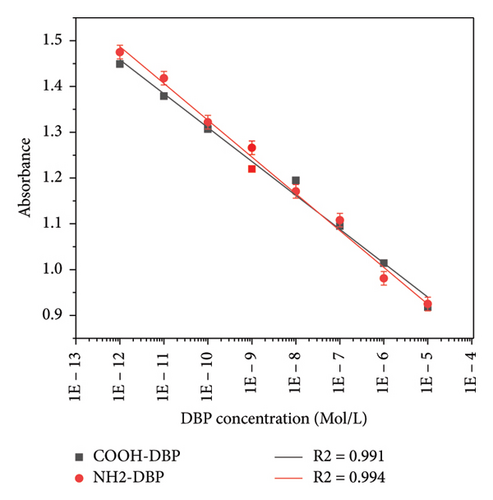
The calibration curve was performed by measuring the average absorbance of the three experiments set at 690 nm versus DBP concentrations, and the SD was calculated as (±0–0.007) for PEG-COOH and PEG-NH2, respectively, as shown in Figure 9. The curves show a good linearity with correlation coefficients (R2 = 0.991 and 0.994) for PEG-COOH and PEG-NH2 GNRs, respectively.
3. Discussion
The detection of phthalate ester plasticizers is very important as their impact on human health is significant, specifically the increase in obesity and reproduction health of males and females, as well as the development of behavioral disorders in children.
Herein, we focussed on one of the most common phthalate esters, DBP, using a simple UV–Vis spectrophotometer upon interacting with functionalized GNRs.
The colorimetric detection of phthalate esters was reported in previous studies by Guo et al., which detected DEP, DBP, and DEHP. When phthalate was attached to the DNA-modified gold nanoparticles (aptamer-E, aptamer-B ,and aptamer-H), it aggregated, and its color changed from red to blue; they reported detection limits for DEP, DBP, and DEHP as 0.026, 0.077, and 0.144 ppm, respectively [32].
Yang et al. used gold nanoparticles coated with the polydopamine molecularly imprinted substrate to selectively detect DMP and DEHP. The sensor was tested in surface water, commercial bottled water, and liquor water. The detection limit for the SERS sensor was 1.0 × 10⁻¹⁰ M, with adsorption equilibrium within 10 min [46].
Using the UV–Vis spectrophotometer to detect phthalate using spherical nanoparticles reported by Yan and coworkers in 2021 detected DBP in Baijiu samples, and they used arginine-functionalized gold nanoparticles as a colorimetric sensor. Upon interaction of DBP with functionalized gold nanoparticles, it aggregated, and the color of the sample changed from red to blue. The colorimetric sensor was characterized using Uv–Vis and FTIR spectroscopy, dynamic light scattering, and zeta potential studies and imaged using a transmission electron microscope (TEM). Their results showed a detection limit as low as 0.05 mgL−1 when Uv–Vis spectroscopy was used, and when the DBP was higher than 1 mgL−1, the color could easily be observed by the naked eye. The linear range for their studies was 0–2.8 mgL−1 [41].
Sensors used to detect phthalate esters are listed in Table 1. Different processing methods are used to detect phthalate esters’ derivatives in various samples such as electrochemical signals, electrochemical immunosensors, ELISA, and fluorescence sensors. These techniques need preparation processing, specific instrumentation, and qualified personnel to detect DBP and its derivatives compared to what we presented in our work. The active materials used to detect the phthalate ester derivatives listed in Table 1 need specific and scientific modifications. The detection limits in previous work are less than those presented in our work except for those using electrical methods for detection or fluorescence detection that is sophisticated, expensive, and need trained personnel to perform the measurements.
| Phthalate ester | Active material | Signal processing | Detection limit | References |
|---|---|---|---|---|
| DEP–DBP–DEHP | DNA-modified gold nanoparticles | Colorimetric | 1.2 × 10⁻⁷, 2.8 × 10⁻⁷, and 3.7 × 10⁻⁷ mol/L, respectively | Guo et al. [32] |
| DBP | Molecular imprinted polymer and a composite of magnetic graphene oxide and gold nanoparticles were used as supporting material | Electrochemical signal | 2.5 × 10⁻⁹ to 5.0 × 10⁻⁶ mol/L | Li et al. [33] |
| DBP | Thionine-loaded gold nanoparticles composite with platinum | Electrochemical immunosensor | 1.75 × 10⁻¹² mol/L (DPV) and 2.55 × 10⁻¹² mol/L (SWV) | Li et al. [35] |
| DBP | Gold nanoclusters functionalized with bovine serum albumin | ELISA | 1.44 × 10⁻⁸ mol/L | Li et al. [35] |
| DBP | The silicon-based molecular imprinted polymer glass carbon electrode was modified with multiwalled carbon nanotubes (MWCNTs) and gold nanoparticles (AuNPs) | Electrochemical sensor | 1.83 × 10⁻¹¹ mol/L | Wang et al. [36] |
| DBP | A molecularly imprinted polymer modified the surface of Mn-doped ZnS quantum dots | Fluorescence sensor | 5–50 × 10−6 mol/L | Zhou et al. [38] |
| DEHP | MIPs | Electrochemical sensor | 6.40 × 10⁻⁸ mol/L | Venkatesh et al. [39] |
| DBP | Molecularly imprinted polymer with three quantum dots: blue, red, and green | Fluorescence sensor | 7.19–71.86 × 10⁻¹² mol/L | You et al. [40] |
| DBP | Gold nanorods | UV–Vis spectroscopy | 10−5–10−12 mol/L | Current work |
In this study, we introduce simple detection of DBP using UV–Vis spectroscopy in aqueous samples even at low concentrations reach Pico mol/L. functionalization of the gold nanorods using a straightforward preparation method by adding thiolated PEG-NH2 and PEG-COOH ligands to the synthesized gold nanoparticles. The GNRs’ modifications cause an instant red shift of the longitudinal surface plasmon resonance on the GNRs from 655 nm to 690 nm that reports the instant existence of DBP in aqueous samples; also, the electrostatic forces between the negatively charged DPB and functionalized GNRs dramatically change the absorbance of the longitudinal surface plasmon peak with values (Δ Abs = 0.573) and (Δ Abs = 0.543) for PEG-NH2 and PEG-COOH, respectively. The functionalization of GNRs is a key to detecting DBP, and as shown in our results, the bare GNRs cannot detect the change of DBP even at higher concentrations.
Here, we present functionalized GNRs for simple detection of DBP. Using functionalized GNRs for DBP detection has several advantages such as enhancing the sensitivity to any changes in their environment and allowing for the detection of low concentrations of DBP (pico mol/L). The use of GNRs and a simple spectrophotometer makes the detection method accessible and affordable, reducing the need for complex and expensive equipment. As well as, the detection process is rapid, with results obtainable within a few seconds, making it suitable for real-time monitoring applications. The GNRs show high selectivity as their specific functionalization with PEG-COOH and PEG-NH2 that are selectively bound to DBP. The GNRs’ synthesis and functionalization preparation are simple, requiring minimal steps and no complex or specific chemical treatments, and no need for hazardous chemicals and complex instrumentation, making the detection method environmentally friendly.
4. Materials and Methods
4.1. Materials
Gold (III) chloride trihydrate (HAuCl4 3H2O, > 99.9%), cetyltrimethylammonium bromide (CTAB, > 99%), sodium borohydride (NaBH4), silver nitrate (AgNO3,> 99%), ascorbic acid, polyethylene glycol monomethyl ether thiol (PEG5000) (PEG-MeO), HS-PEG7500-COOH (PEG-COOH), HS-PEG5K-NH2 (PEG-NH2), and DBP.
4.1.1. Synthesis of Gold Nanoparticles
Citrate-stabilized spherical gold (G.P.s) with a 20 nm diameter was prepared according to Turkevich–Frens [47, 48]. In brief, 50 μM of gold (III) tetrachloroaurate trihydrate (HAuCl4.3 H2O) was dissolved in 150 mL of Milli-Q water and heated to boiling. Subsequently, 4.5 mL of 1% w/w aqueous trisodium citrate solution, previously warmed in a water bath, was added, and the mixture was refluxed for 30 min. The solution was then allowed to cool to room temperature under vigorous stirring overnight. GNRs were synthesized using the seeded-mediated growth method reported by Dickerson et al. [49] with slight modifications. This method is based on two steps: seed synthesis and growth. In the first step, a seed solution of tiny-sized spherical gold nanoparticles (less than 5 nm diameter) is produced by reducing gold (III) chloride trihydrate (HAuCl4), using a strong reducing agent (sodium borohydride [NaBH4]) in the presence of a cationic surfactant (CTAB); second, this seed solution is added to a growth solution which consists of a mixture of HAuCl4, CTAB, silver nitrate (AgNO3), and ascorbic acid (C6H8O6) as a mild reducing agent which reduces AuIII to AuI under the reaction conditions, which eventually is reduced to Au0 after adding the seed solution to the growth solution. NPs were characterized using UV–Vis spectroscopy (Shimadzu UV-1900 UV–Vis Spectrophotometer), zeta potential, and TEM (F.E.I. Tecnai Spirit microscope at 120 kV).
4.1.2. Functionalization With Thiolated PEG Ligands
The concentrations of synthesized gold nanoparticles (GP, R) were calculated to determine the GNR concentration. The Beer–Lambert law (A = ɛ L C, where A is the absorbance, L is the path length, ɛ is the extinction coefficient, and C is the concentration) was applied. The GNR UV–Vis spectra were taken and the absorbance and position of the longitudinal surface plasmon peak were determined. To find the extinction coefficient for NRs with a particular aspect ratio (i.e., the position of the LSPR band), the data reported by Orendorff and Murphy were used [50]. The UV–Vis spectra of the gold nanoparticles were used to determine their concentration following Haiss et al. [51]. 100,000 excess thiolated PEG were added to different gold samples and incubated overnight. The capping ligands used are PEG-NH2 and PEG-COOH. Change in the absorbance results obtained from UV–Vis spectra used to produce calibration curve. The calibration curve shows changes in the absorbance of DBP related to concentrations starting from 3 × 10⁻⁵ mol/L up to 3 × 10 −12 mol/L.
5. Conclusions
In this work, different shapes of gold nanoparticles were synthesized: spherical gold nanoparticles (GP) with a radius of 30 nm and GNRs (R) have dimensions of 34 × 12 nm. All the gold nanoparticles were functionalized using thiolated PEG (PEG-NH2 and PEG-COOH) and then used to detect different concentrations of DBP (3 × 10⁻¹³–3 × 10⁻⁵). The UV–Vis spectra show changes in absorbance (Δ Abs = 0.57 ± 0 and 0.54 ± 0.007) for the GNRs functionalized with PEG-NH2 and PEG-COOH, respectively. We have a plasmonic sensor for DPB with a detection limit of up to picomole/L concentration, with a linear range and correlation coefficient (R2 = 0.994 and 0.991) for the GNRs functionalized with PEG-NH2 and PEG-COOH, respectively. The plasmonic sensor is fast, sensitive, and simple to use without using a sophisticated protocol or several preparation steps to detect an environmental pollutant which dramatically affects human life and the environmental ecosystem. Table 1 compares our results with different results reported in the literature. Our sensor showed effective, simple, and accurate results in detecting phthalate esters in aqueous samples.
Using functionalized GNRs for DBP detection in the current study shows high sensitivity because GNRs have a high surface area-to-volume ratio, which enhances their sensitivity to changes in the surrounding environment. We confirm GNRs’ sensitivity to detect DBP; this functionalization allows for the detection of low concentrations (picomole/L) of DBP, and the use of functionalized GNRs and a simple spectrophotometer makes the detection method accessible and affordable, reducing the need for complex and expensive equipment. Also, the detection process is rapid, with results obtainable within a few seconds, making it suitable for real-time monitoring applications.
GNRs can be functionalized with specific ligands PEG-COOH and PEG-NH2. The functionalization used with PEG-NH2 and PEG-COOH selectively detects DBP as the bare GNRs do not show any response upon adding DBP to the aqueous solution. We emphasize that the preparation process of functionalization of GNRs is simple, requiring minimal steps and no complex chemical treatments, Therefore, there is a minimum need for hazardous chemicals and complex instrumentation, making the detection method more environmentally friendly.
Conflicts of Interest
The authors declare no conflicts of interest.
Author Contributions
D.S. and A.H. performed experimental work and wrote and reviewed the manuscript. A.M.A. and D.S. contributed to conceptualization, review, and discussions of the manuscript. All authors revised the manuscript and agreed to the contents.
Funding
The authors extend their appreciation to the Deputyship for Research & Innovation, Ministry of Education in Saudi Arabia for funding this research work through the project number: IF-PSAU-2021/01/18194.
Acknowledgments
The authors would like to thank central laboratory and the laboratory of ultrafast dynamics (LUDS)-faculty of Science Ain Shams University for using their facilities. The authors extend their appreciation to the Deputyship for Research & Innovation, Ministry of Education in Saudi Arabia, for funding this research work through the project number: IF-PSAU-2021/01/18194.
Open Research
Data Availability Statement
The data that support the findings of this study are available from the corresponding author upon reasonable request.


