Wind Turbine Optimization by Blade Element Momentum Method and Particle Swarm Optimization Technique
Abstract
The aerodynamic efficiency of wind turbines is greatly influenced by the shape of their airfoils. In this study, four airfoils were optimized to enhance the performance of a small horizontal axis wind turbine. The optimization process involved adjusting the thickness and camber of the airfoils using the blade element momentum method and particle swarm optimization technique. The goal was to find the most aerodynamically efficient airfoil based on the thickness-to-camber ratio. The optimized airfoils were compared to select the best one for a three-blade, 6-m diameter turbine configuration. The results showed that the optimized microturbine achieved better efficiency than the baseline turbines and those optimized by other researchers. Notably, the study also rigorously validated the blade element momentum–particle swarm optimization methodology through experimental methods, providing robust support for our findings.
1. Introduction
By improving airfoil design, wind turbines (WTs) can operate more efficiently. Many researchers have modified the airfoil shapes in WT blades to improve performance and reduce energy costs [1]. Since airfoils have an important influence on WT aerodynamic efficiency, it is important to develop them to have already enhanced aerodynamic efficiency. For this purpose, it seems essential to develop a method of determining the aerodynamic performance of airfoils quickly, accurately, and cheaper than with long-time computing computational fluid dynamics (CFD) simulations. Several optimization procedures have been utilized to enhance the airfoils developed throughout the entire production process by using a variety of tools and approaches. Reducing the design variable space is crucial in multiobjective airfoil profile optimization to improve optimization efficiency and reduce computational costs. Jin et al. [2], using random forest and deep neural networks (DNNs), conducted a study whose results demonstrated that increasing the airfoil curvature and reducing the maximum thickness improved the lift coefficient (CL) by 386 counts. In the same year, the approach by Collazo Garcia and Ansell [3] involved creating a parameterized pressure distribution to achieve the desired boundary-layer properties for inverse design applications. The numerical analysis, conducted with a viscous-inviscid solver combining integral boundary layer and Euler equations, demonstrated that the optimized airfoils achieved profile drag reductions of 9.06% and 6.00% at angle of attack (AoA) of 0° and maximum lift-to-drag ratio (CL/CD) design points, respectively.
Seifi Davari et al. [4] optimized airfoils using maximum thickness and maximum camber at Reynolds number (Re) ranging from 50,000 to 500,000, employing the XFOIL software. Their research results indicated that the maximum CL/CD and the AoAstall of the airfoils increased across all the Re analyzed. Shen et al. [5] utilized a combination of CFD and the surrogate model method (SMM) to uncover the relationship between turbine performance and airfoil shape and flow characteristics at low flow rates. They designed a flow velocity tidal energy airfoil model using the Kriging model, resulting in an airfoil with a relative thickness of 12% and a relative curvature of 2.5%. Their findings demonstrated that airfoils with thinner profiles and increased curvature exhibited better hydrodynamic performance. Specifically, the location of the maximum thickness was moved forward by 4.58%, and the CL/CD was enhanced by 4.03%.
Belda and Hyhlík [6] utilized XFOIL, integrating the adjoint method with parsec parametrization and the panel method under certain assumptions. This approach proved highly efficient and robust for optimizing the CL of the national renewable energy laboratory (NREL) S809 airfoil. The improvements in CL/CD exceeded 94% at 0° AoA and over 16% at 6.2° AoA, as validated by XFOIL. Carreño Ruiz et al. [7] determined the positions of thickness and camber of airfoils using XFOIL software. Their findings revealed that incorporating sharp leading-edge variations in airfoil designs enhances peak efficiency by over 10% at low Re. A study developed an innovative approach for optimizing airfoil shapes by integrating a genetic algorithm (GA) optimizer with an aerodynamic coefficient prediction network (ACPN) model. The GA-ACPN model enhanced the CL/CD by 51.4% and 55.4% for the NACA0012 airfoil, with and without constraints, respectively. Additionally, the GA-CFD optimization method achieved improvements of 50.3% and 60.0% [8].
Airfoil optimization for a WT blade was conducted using the ANSYS Fluent Adjoint Solver. Boudis et al. [9] aimed to enhance WT power output through this optimization process, maximizing the airfoil CL/CD. The S809 airfoil served as the baseline profile. Subsequently, the optimized airfoils were applied in designing the NREL Phase VI blade, and the aerodynamic performance of the new WT was evaluated using the open-source code QBLADE (for more information on the features and functionalities of QBLADE, refer to the Appendix). Their findings indicated a 38% improvement in WT power output at a wind speed of 10 m/s compared to the original turbine. Shinde et al. [10] investigated the shape optimization of an asymmetric S2027 airfoil designed for low wind speed regions using the adjoint-based optimization technique. Their primary goals were to maximize the CL, minimize the CD, and maximize the CL/CD. The optimization process utilized the adjoint method across Re ranging from 200,000 to 500,000 and AoA variations from 0° to 12°. A two-dimensional Reynolds-Averaged Navier–Stokes CFD model was employed to simulate all operational parameters and facilitate optimization. Their findings indicated reductions in drag coefficient (CD) ranging from 2% to 30%.
Akbari et al. [11] conducted a study where they selected 10 low Re airfoils (BW-3, E387, FX 63-137, S822, S834, SD7062, SG6040, SG6043, SG6051, and USNPS4) and evaluated their performance in a 1-kW turbine. The evaluation focused on the power coefficient (Cp) and startup time through a multiobjective optimization approach. The blade element momentum (BEM) technique was employed for calculating Cp and startup time and the differential evolution algorithm were used for optimization. Their findings indicated that the SG6043 airfoil exhibited the highest Cp.
Compared with relevant literature, this study contributes by focusing on two simultaneous research directions. Initially, it integrates the BEM and particle swarm optimization (PSO) methods, optimizing airfoil designs based on thickness, camber, and thickness-to-camber ratio at a Re of 300,000. Subsequently, each optimized airfoil undergoes evaluation to select the design with the highest aerodynamic performance, particularly emphasizing the thickness-to-camber ratio. This optimized airfoil is then utilized in designing a horizontal axis wind turbine (HAWT), which is further compared against the baseline and another turbine to determine optimal WT design strategies. Finally, in this study, a comparative analysis was conducted with recent advancements in WT design.
The literature review identifies several gaps, particularly in integrating multimethod optimization approaches like BEM and PSO for airfoil design in low Re regimes. These studies often lack a comprehensive exploration of parameters such as airfoil thickness-to-camber ratio, significantly influencing aerodynamic performance and efficiency. Previous studies often focus on single optimization techniques or do not extensively explore the influence of specific airfoil parameters on overall turbine efficiency. Moreover, while some studies evaluate aerodynamic performance theoretically, they may lack experimental validation to support their findings robustly.
This study is innovative because it takes a comprehensive approach, combining advanced optimization methods with rigorous experimental validation to ensure the effectiveness of the designed airfoil for practical applications in WT technology. By addressing these gaps in the literature, this research provides insights into optimizing turbine efficiency through tailored airfoil design, ultimately contributing to advancements in renewable energy technology.
2. Methodology
2.1. BEM Theory
BEM theory is a method for analyzing and designing the performance of WTs, particularly HAWTs. It combines two separate theories: the blade element theory and the momentum theory. The blade element theory breaks down the blade of a WT into a series of small, discrete elements along its length. By analyzing the forces (lift and drag) acting on each of these elements, one can determine the performance of the entire blade. On the other hand, the momentum theory, also known as the actuator disk theory, examines the change in momentum of the airflow as it passes through the plane of the rotor. It provides a relationship between the induced velocity (both axial and tangential) and the forces generated by the rotor.
The BEM theory was developed to provide a more accurate and practical method for predicting the performance of WT blades compared to earlier methods. The primary motivations for its development were increased accuracy, computational efficiency, and adaptability. By combining the detailed analysis of blade element theory with the overall flow dynamics captured by momentum theory, BEM provides a comprehensive and accurate prediction of the aerodynamic performance of WT blades. Additionally, the BEM method is less computationally intensive compared to full CFD simulations, making it suitable for iterative design and optimization processes. The method can also be easily adapted to various blade geometries and operational conditions, allowing for versatile application in WT design.
The BEM method works by first discretizing the blade into several small elements along its span. Each element is analyzed separately to determine the local aerodynamic forces. For each blade element, the lift and drag forces are calculated based on the local AoA, airfoil characteristics (CL and CD), and relative wind speed. The momentum theory is then applied to determine the induced velocities (both axial and tangential) at each blade element. These velocities are influenced by the forces generated by the blade and the overall flow field. The method involves iterative calculations to converge on the induced velocities and corresponding aerodynamic forces. This iterative process ensures that the interaction between the blade and the flow field is accurately captured. Once the iterative process converges, the overall performance of the WT, including power output, thrust, and efficiency, can be predicted by integrating the contributions of all blade elements.
The advantages of the BEM method include its simplicity, speed, and flexibility. The BEM method simplifies the complex interactions between the blade and the airflow into manageable calculations. It provides quick estimations of WT performance, which is valuable during the design and optimization stages. The method can accommodate different blade shapes, pitch angles, and operating conditions, making it versatile for various WT designs.
2.2. PSO
PSO is a computational method used to optimize a wide range of problems by iteratively trying to improve a candidate solution with regard to a given measure of quality. PSO originated from the observation of social behaviors in animals. Researchers aimed to simulate the natural process of social interaction and movement within a group to find optimal solutions to complex problems. The primary purposes of PSO include providing a robust and efficient method for finding optimal or near-optimal solutions in high-dimensional search spaces, offering a simple yet powerful algorithm that can be easily implemented and adapted to various optimization problems, and applying it to a wide range of optimization problems, from engineering design to machine learning and beyond. PSO operates by initializing a swarm of particles (potential solutions) that move through the search space. Each particle adjusts its position based on its own experience and the experience of its neighbors. The process begins with the initialization of a swarm of particles randomly within the search space. Each particle has a position representing a potential solution and a velocity that dictates its movement. The fitness of each particle is evaluated based on a predefined objective function, which measures the quality or performance of the solution represented by the particle’s position.
Each particle keeps track of its personal best position, which is the position that has yielded the highest fitness value for that particle so far. The global best position is identified as the best position found by any particle in the entire swarm. The velocity of each particle is updated based on three components: inertia, the particle’s previous velocity, which adds momentum and prevents abrupt changes in direction; the cognitive component, the attraction towards the particle’s personal best position, encouraging exploration of known good areas; and the social component, the attraction towards the global best position, promoting convergence towards the best overall solution. The advantages of PSO include its simplicity, efficiency, and flexibility. PSO is easy to understand and implement, with fewer parameters to adjust compared to other optimization algorithms. It converges quickly to good solutions, making it suitable for real-time and large-scale optimization problems. PSO can handle nonlinear, multimodal, and high-dimensional optimization problems effectively and can be applied to various optimization problems, including continuous, discrete, and combinatorial problems.
In conclusion, PSO is a powerful and versatile optimization technique inspired by animal social behavior. Its simplicity, efficiency, and adaptability make it a popular choice for solving complex optimization problems across different domains. By leveraging the collective behavior of particles, PSO effectively explores and exploits the search space to find optimal or near-optimal solutions [13, 14].
2.3. Coupling BEM and PSO for Optimization
To optimize four different airfoil designs based on thickness, camber, and thickness-to-camber ratio adjustments for superior aerodynamic performance, the BEM method was integrated with PSO. This approach is aimed at identifying the optimal airfoil configuration that maximizes efficiency and performance characteristics relevant to WT applications [13, 14].
The BEM method dissects the airfoil into small segments to analyze local aerodynamic forces. It combines blade element theory to calculate lift and drag at each segment with momentum theory to account for overall rotor effects on airflow. This method provides detailed insights into the airfoil’s aerodynamic performance, crucial for optimization. PSO adjusts airfoil parameters (thickness, camber, and thickness-to-camber ratio) to maximize predefined objectives such as aerodynamic efficiency or CL/CD. It efficiently explores and exploits the design space, converging towards optimal solutions.
In this paper, aerodynamic efficiency parameters such as CL, CD, CL/CD, AoAstall, and CL versus CD were evaluated for both baseline and modified airfoils at a Re of 300,000. The primary objective was to enhance the efficiency of a WT by modifying the shape of baseline airfoils to suit wind conditions ranging from 5 to 6.1 m/s at a height of 12 m [12]. Investigations were conducted for viscous airflow at a Re of 300,000 and for AoA varying between 0° and 20°. The developed BEM-PSO theory was used to develop 3-blade and 3-m-radius WT rotor modified airfoils, and the main evaluations of their CP were investigated. Based on Ghana’s (as a pilot) usual average wind speed, the CP result was utilized to assess the power output of each WT rotor. In the following, the WT blades are designed using airfoil parameters calculated using the developed BEM-PSO method.
2.4. Optimization Process
Problem formulation: Define optimization objectives and constraints (e.g., maximize CL, minimize CD) relevant to WT performance.
Initialization: Initialize a swarm of particles, each representing a unique set of airfoil parameters (thickness distribution, camber profile, thickness-to-camber ratio).
Performance evaluation (BEM): Utilize BEM to evaluate each particle’s airfoil design. Calculate CL, CD, and other aerodynamic parameters based on local flow conditions and geometric properties [15].
Fitness calculation: Assess each particle’s fitness based on optimization goals. This fitness metric guides the PSO algorithm in updating particle positions.
PSO update: Update particle velocities and positions using PSO equations. Adjust velocities based on cognitive (personal best) and social (global best) components to explore and exploit the design space effectively.
Iterative refinement: Iterate the evaluation, fitness assessment, and PSO update steps until convergence criteria are met. This ensures that the optimized airfoil designs are refined continuously.
Selection of optimal airfoil: Evaluate the performance of each optimized airfoil design based on the aerodynamic parameters obtained from BEM analysis.
Compare and select the airfoil design that exhibits superior aerodynamic performance, such as higher CL/CD or improved efficiency.
Validation and comparison: Validate the final optimized airfoil designs through wind tunnel testing to ensure real-world applicability and performance.
Compare the performance of the optimized airfoils with baseline designs or other optimizations to demonstrate the effectiveness of the BEM-PSO coupling approach.
Implementation: Implement the selected optimized airfoil design into the blade profile of WTs. Validate the overall turbine performance using BEM to confirm improvements in aerodynamic efficiency and power output.
Conclusion: Integrating BEM with PSO provides a robust framework for optimizing airfoil designs tailored for WT applications. By leveraging BEM’s detailed aerodynamic analysis and PSO’s global optimization capabilities, this approach facilitates the development of high-performance airfoils that enhance turbine efficiency and energy capture in diverse wind conditions. Moreover, this approach ensures the design process is systematic, leveraging computational tools to achieve optimized results that meet or exceed predefined performance objectives.
Fortran software has been added due to its suitability for optimizing airfoil and HAWT designs using BEM and PSO. Fortran offers significant advantages for computational tasks like aerodynamic optimization using BEM and PSO. Its primary strengths lie in its speed and efficiency in numerical computations, which is especially crucial for large-scale simulations. Fortran’s legacy in scientific computing ensures robust performance, efficient memory management, and optimized code execution tailored for complex algorithms like those required in BEM and PSO optimizations. The BEM-PSO code that was developed optimizes the performance of a rotor under steady and uniform flow conditions. Thus, this study assumes steady and uniform flow throughout [16]. In the present research, a single run of the developed code coupled with optimization takes approximately 8 h if convergence is achieved. With a setup involving 160 panels, a PSO swarm size of 50, and 1000 iterations, a standard processor suffices for the computational requirements. The BEM calculates airflow around the airfoil in each iteration.
2.5. BEM-PSO Flowchart
The process begins with selecting four baseline airfoils (SG6043, PSU94-097, SD6060, and S2055) for optimization to enhance their aerodynamic efficiency. The optimization involves varying the thickness-to-camber ratio of these airfoils through iterative modifications. This aims to develop new airfoil designs with improved aerodynamic performance. The optimization is carried out using the BEM method and PSO. This approach helps refine airfoil parameters such as thickness-to-camber ratio and camber to maximize key performance metrics like lift and drag characteristics. A comparative analysis is conducted to evaluate the aerodynamic efficiency of the optimized airfoils against the baseline models. Airfoils showing superior performance are selected for further refinement. The process involves iterative refinement cycles focusing on optimizing the thickness-to-camber ratio and camber until the desired aerodynamic performance is achieved. Assessments continue with varying thickness-to-camber ratios and Re to identify the best airfoil configurations for different operating conditions. This method effectively leverages the BEM-PSO coupling to optimize airfoil designs, ensuring significant performance improvements tailored to specific aerodynamic requirements. The subsequent words outline the step-by-step process of the BEM and PSO coupling. Moreover, a detailed explanation of the flowchart depicted in Figure 1 follows.
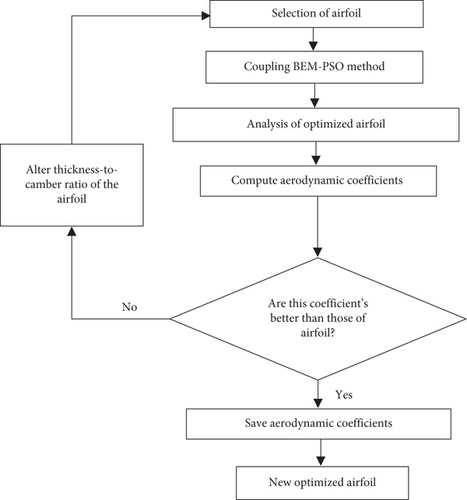
Step 1. Baseline airfoil selection
Initially, four baseline airfoils (SG6043, PSU94-097, SD6060, and S2055) were chosen for optimization to enhance their aerodynamic efficiency.
Step 2. Airfoil optimization with thickness-to-camber ratio variation
The selected baseline airfoils underwent iterative modifications and optimizations using variations in the thickness-to-camber ratio. Different thickness-to-camber ratio values were explored to develop novel airfoil designs, each aimed at improving specific aerodynamic performance criteria such as CL, CL/CD, and AoAstall.
Step 3. Development of optimized airfoils
Optimization of the airfoils was achieved by integrating the BEM method and PSO. This coupled approach facilitated systematic exploration and refinement of airfoil parameters, including thickness-to-camber ratio and camber, to maximize key performance metrics such as CL/CD and AoAstall characteristics.
Step 4. Comparative analysis
A comprehensive comparative analysis was conducted to assess the aerodynamic efficiency of the optimized airfoils compared to the baseline models. Critical aerodynamic parameters including CL, AoAstall, CL/CD, and Cp were rigorously evaluated.
Step 5. Selection of optimized airfoils based on aerodynamic performance
Optimized airfoils demonstrating superior aerodynamic performance metrics such as maximum CL, AoAstall, maximum CL/CD, and maximum Cp were selected for further refinement and evaluation.
Step 6. Iterative refinement
Airfoils that did not meet efficiency targets underwent further iterative refinement cycles. Focus was placed on optimizing the thickness-to-camber ratio and camber to achieve enhanced aerodynamic performance.
Step 7. Iterative assessment
The iterative optimization process continued with assessments conducted at varying thickness-to-camber ratios and Re. This ongoing refinement is aimed at determining the optimal airfoil configurations that deliver superior aerodynamic performance under diverse operating conditions. This approach leverages the BEM-PSO coupling to optimize airfoil designs effectively, ensuring robust performance enhancements tailored to specific aerodynamic requirements and operational scenarios.
3. Airfoil Optimization
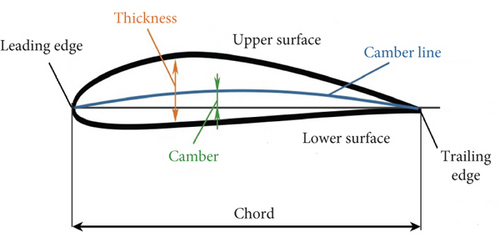
Figure 2 illustrates a schematic of an airfoil. Before delving into the optimization process, it is necessary to identify and indicate the various parts of the airfoil shown in Figure 2, including the thickness, camber, and chord. This is crucial because the methodology of this research utilizes the thickness, camber, and thickness-to-camber ratio of the airfoil.
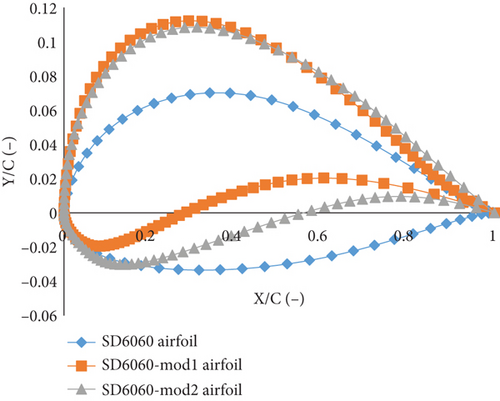
Initially, using the thickness and camber of the SD6060 airfoil, 15 new airfoils were examined within the thickness range of 1.95%–14.25% and the camber range of 1.03%–5.74%. The developed BEM-PSO model was utilized to analyze the thickness-to-camber ratio. Finally, at thickness-to-camber ratios of 1.97% and 2.86%, the proposed airfoils exhibited better maximum CL, maximum CL/CD, and AoAstall compared to the SD6060 airfoil. For an optimized airfoil with a thickness-to-camber ratio of 1.97, the thickness is 0.1175 or 11.75% of the chord exists at 20.30% chord length. The camber is 0.0596 or 5.96% of the chord, and the maximum camber is 0.3870 or 38.70%. Also, for an optimized airfoil with a thickness-to-camber ratio of 2.86, the thickness is 0.1322 or 13.22% of the chord, which exists at 23% chord length. The camber is 0.0461 or 4.61% of the chord, and the maximum camber is 0.4330 or 43.30%. Hence, outside this thickness-to-camber ratio range, the aerodynamic performance is reduced.
The airfoil with a thickness-to-camber ratio of 1.97 is called the SD6060-mod1 airfoil, and the SD6060 airfoil with a thickness-to-camber ratio of 2.86 is called the SD6060-mod2 airfoil. These airfoils were selected for further examination and comparison with other airfoils, as shown in Figure 3a. Detailed descriptions of the selected airfoils are in Table A1 in the appendix.
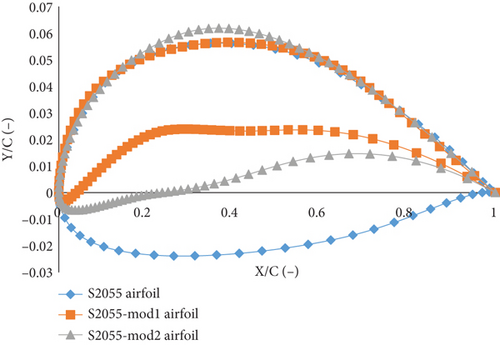
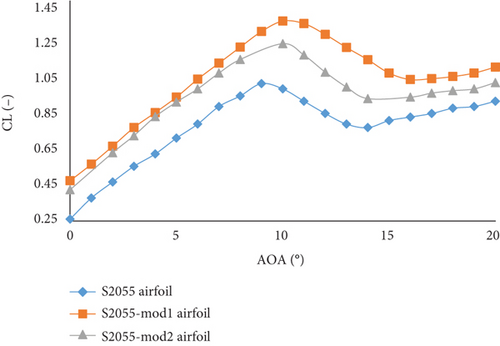
The thickness and camber of the S2055 airfoil were used to develop 11 new airfoils. These airfoils were analyzed within a thickness range of 3.33%–13.98% and a camber range of 0.83%–4.41%. The BEM-PSO model was employed to investigate the thickness-to-camber ratio. The results showed that at thickness-to-camber ratios of 0.83% and 1.74%, the new airfoils had better maximum CL, CL/CD, and AoAstall compared to the S2055 airfoil. For the airfoil optimized at a thickness-to-camber ratio of 0.83, the thickness is 3.33% of the chord length, located at 41.30% of the chord. The camber is 4.00% of the chord, with the maximum camber at 36.10% of the chord. For the airfoil optimized at a thickness-to-camber ratio of 1.74, the thickness is 5.93% of the chord length, located at 32.00% of the chord. The camber is 3.40% of the chord, with the maximum camber at 48.20% of the chord. Outside these thickness-to-camber ratios, the aerodynamic performance declines. The airfoil with a thickness-to-camber ratio of 0.83 is designated as S2055-mod1, and the one with a thickness-to-camber ratio of 1.74 is designated as S2055-mod2. These optimized airfoils were selected for further analysis and comparison with other airfoils, as illustrated in Figure 3b. Detailed descriptions of these airfoils can be found in Table A2 in the appendix.
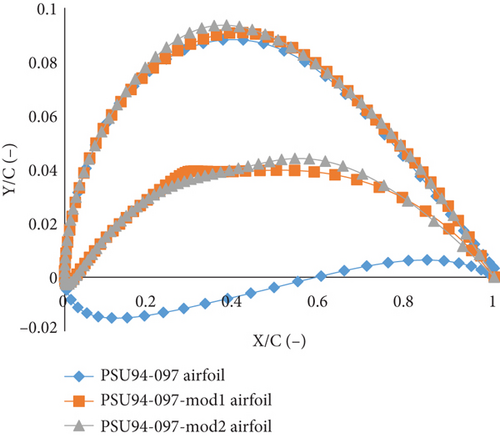
In the following, the thickness and camber of the PSU94-097 airfoil were used to develop 15 new airfoils. These airfoils were analyzed within a thickness range of 4.08%–28.65% and a camber range of 1.65%–7.55%. The developed BEM-PSO model was employed to investigate the thickness-to-camber ratio. The results showed that at thickness-to-camber ratios of 0.79% and 0.82%, the new airfoils had better maximum CL, CL/CD, and AoAstall compared to the PSU94-097 airfoil. For an optimized airfoil with a thickness-to-camber ratio of 0.79, the thickness is 0.0516 or 5.16% of the chord exists at 39.30% chord length. The camber is 0.0652 or 6.52% of the chord and the maximum camber is 0.4150 or 41.50% of the chord. Also, for an optimized airfoil with a thickness-to-camber ratio of 0.82, the thickness is 0.0551 or 5.51% of the chord exists at 32.00% chord length. The camber is 0.0668 or 6.68% of the chord and the maximum camber is 0.4070 or 40.70% of the chord. Therefore, the thickness-to-camber ratio considered when developing the airfoils in the present research was between 0.79 and 0.82. Two PSU94-097 airfoils with thickness-to-camber ratio of 0.79 to 0.82 are therefore selected for further investigations, an unmodified PSU94-097, a baseline with a thickness-to-camber ratio of 0.79 called the PSU94-097-mod1 airfoil, and an airfoil with a thickness-to-camber ratio of 0.82 called the PSU94-097-mod2 airfoil. Figure 3c shows the PSU94-097, PSU94-097-mod1, and PSU94-097-mod2 airfoils. Detailed descriptions of these airfoils can be found in Table A3 in the appendix.
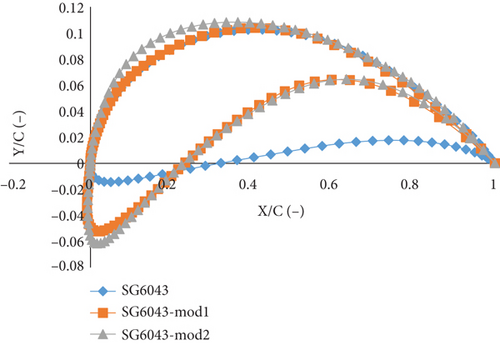
Finally, the SG6043 airfoil served as the basis for developing 16 new airfoils, analyzed within a thickness range of 3.74%–18.21% and a camber range of 1.32%–8.02%. The developed BEM-PSO model was employed to explore the thickness-to-camber ratios. The findings indicated that at thickness-to-camber ratios of 1.32% and 1.52%, the new airfoils outperformed the original SG6043 airfoil in terms of maximum CL, CL/CD, and AoAstall. For the airfoil optimized at a thickness-to-camber ratio of 1.32, the thickness is 10.58% of the chord, located at 11.46% of the chord length. The camber is 7.98% of the chord, with the maximum camber at 52.10% of the chord. For the airfoil optimized at a thickness-to-camber ratio of 1.52, the thickness is 12.20% of the chord, also at 10.64% of the chord length. The camber is 7.98% of the chord, with the maximum camber at 55.32% of the chord. Therefore, the study focused on airfoils with thickness-to-camber ratios between 1.32 and 1.52. The airfoil with a thickness-to-camber ratio of 1.32 is designated as SG6043-mod1, while the airfoil with a thickness-to-camber ratio of 1.52 is designated as SG6043-mod2. Figure 3d presents the SG6043, SG6043-mod1, and SG6043-mod2 airfoils at a Re of 300,000. Detailed descriptions of these airfoils can be found in Table A4 in the appendix. Compared to the SG6043 airfoil, the SG6043-mod airfoils have thinner thicknesses and are more cambered.
4. Results and Discussion
4.1. Validation Data
To validate the precision of the flow solver in this study, multiple airfoils were examined using the developed BEM-PSO code. At first, these results were then compared to the experimental data obtained by Selig et al. [17] and results from XFOIL (present study) for the RG15 airfoil at a Re of 300,000 under various conditions.
The experimental setup described by Selig et al. [17] was as follows: The experiments were performed at the University of Illinois Urbana-Champaign (UIUC) within the Subsonic Aerodynamics Laboratory of the Department of Aeronautical and Astronautical Engineering. The wind tunnel used was an open-return type with a 7.5:1 contraction ratio. The rectangular test section had dimensions of 2.8 by 4.0 ft in cross section and a length of 8 ft. To account for boundary-layer growth along the tunnel walls, the width of the test section increased by approximately 0.5 in. along its length. The wind speeds in the test section could vary up to 160 mph, driven by a 125-horsepower alternating current (AC) electric motor connected to a five-blade fan.
Since low Re airfoil performance was highly dependent on the behavior of the laminar boundary layer, it was crucial to maintain low turbulence levels in the wind tunnel to prevent premature transition to turbulent flow over the airfoil. To ensure high-quality flow in the test section, the wind tunnel settling chamber included a 4-in. thick honeycomb and four antiturbulence screens, which could be partially removed for cleaning. The turbulence intensity was measured below 0.1%, which is adequate for low Re airfoil measurements in their study.
The airfoil model was mounted horizontally between two 3/8-in. thick, 6-ft long Plexiglas endplates, which isolated the model’s ends from the tunnel side wall boundary layers and support hardware. The gaps between the model and Plexiglas were approximately 0.05 in. One side of the airfoil was free to pivot, with the AoA measured using a linear transformer. On the other side, the airfoil model was connected to the lift carriage through two steel wing rods that passed through the wing-rod fixture and were anchored to the model with set screws. This side allowed vertical movement on a precision-ground shaft but restricted rotation. A feedback-controlled force balance restrained the model’s motion, and linear and spherical ball bearings within the lift carriage minimized frictional effects.
Two side-by-side pitot probes, spaced 3.96 in. apart in the spanwise direction, were connected to the main center post that extended vertically through the tunnel test section floor. The entire traversing system was housed within a pressure-sealed box beneath the tunnel test section. The traverser’s resolution and stability were less than 0.001 and 0.005 in., respectively, in both the spanwise and vertical directions. The readout accuracy in these directions was 0.020 and 0.002 in., respectively. Their wind tunnel model had a nominal chord of 12 in. with ±1/64-in. tolerances and featured two brass tubes on each end for mounting.
The variations of CL and CD with the AoA are shown in Figure 4a,b, respectively. Initially, the XFOIL results were compared with the wind tunnel test data [17]. XFOIL accurately predicted the CL variation with AoA up to stall at approximately 2°. For CD, XFOIL accurately predicted values for AoAs between −5° and 10° and matched well before stall. However, discrepancies were observed between the wind tunnel data and XFOIL results, particularly for CD at AoAs above 10°. These differences indicate that while XFOIL could capture the general trend and major characteristics of the CL and CD graphics, it fell short of precisely matching the experimental data in poststall regions.
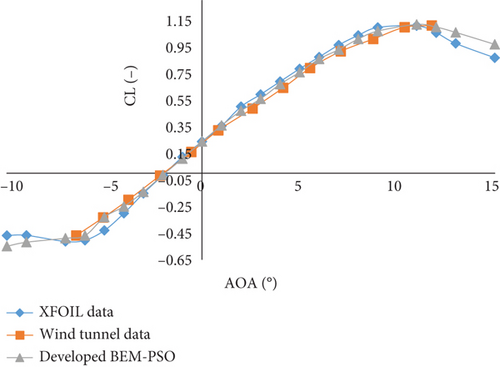
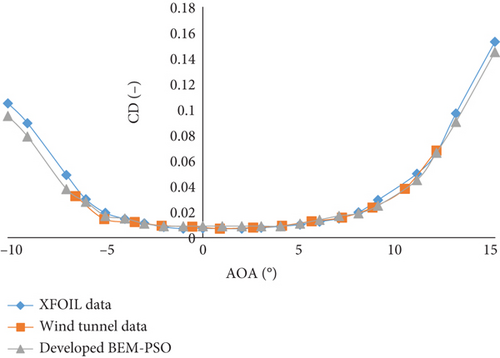
The reasons for XFOIL’s limitations in predicting the experimental data accurately for the CL and CD, especially in the poststall region, can be attributed to its inherent assumptions and the simplified aerodynamic models it employs. XFOIL relies on potential flow theory coupled with boundary layer corrections, which may not fully capture complex flow phenomena like separation and transition accurately, especially at higher AoA.
In contrast, the developed BEM-PSO code demonstrated a good agreement with the experimental data for both CL and CD values. The BEM-PSO code’s improved accuracy can be attributed to its enhanced modeling capabilities, which include a better representation of flow separation and transition effects. This comprehensive modeling allows the developed BEM-PSO code to predict the aerodynamic performance of the RG15 airfoil more accurately across a broader range of AoAs compared to XFOIL.
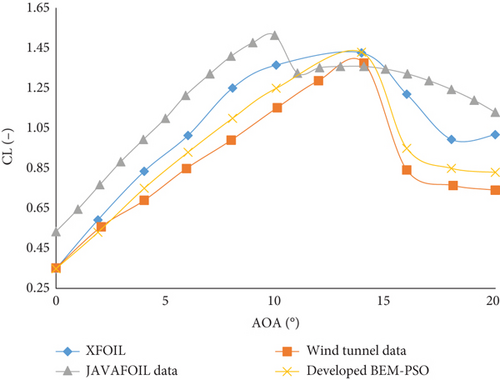
In the following, Figure 5 compares the variation in CL with AoA at a Re of 75,000 using XFOIL, JAVAFOIL software, and the developed BEM-PSO code, alongside wind tunnel results [18]. The CL variations for the NACA4412 airfoil at a Re 75,000 are depicted. These data are compared with experimental results conducted by Koca et al. [18].
The research by Koca et al. [18] was conducted in a low-speed wind tunnel at the Department of Energy Systems Engineering at Erciyes University. The wind tunnel featured a square test section measuring 500 by 500 mm. The maximum achievable speed within the tunnel was 40 m/s. The turbulence intensity was approximately 0.3% at the highest velocity and around 0.7% at the lowest. Throughout the experiments, the pressure in the test chamber was monitored using a Pitot tube and consistently controlled by an external manometer. The airfoil model for their study was created using a 3D printer. To achieve a smoother surface, the model was sanded with sandpaper, ensuring a more uniform surface roughness. Two Plexiglas plates were placed at each end of the airfoil to create a 2D model. Their study did not consider the effects of tip vortices; instead, it focused on the vortices at the leading and trailing edges of the airfoil.
In the following, XFOIL relatively accurately predicts the CL, matching experimental results at 14°. In contrast, JAVAFOIL predicts CL earlier, at 10°. Additionally, XFOIL effectively models the poststall behavior in line with experimental findings. The CL values from XFOIL demonstrate superior accuracy to those from JAVAFOIL, exhibiting significantly less error. The developed BEM-PSO code, however, was able to predict the CL values with greater accuracy than both XFOIL and JAVAFOIL, especially after the CL, and showed fewer errors than the other results.
The discrepancies in results between XFOIL and JAVAFOIL can be attributed to the different methods they use. XFOIL utilizes a potential flow theory combined with boundary layer corrections, which may not fully capture complex aerodynamic phenomena. JAVAFOIL, on the other hand, uses a simpler panel method for potential flow analysis, leading to more significant errors, particularly in predicting stall characteristics and post-stall behavior.
The CD variation with AoA, calculated at a Re of 23,000 using results from XFOIL and JAVAFOIL software, compared to wind tunnel [19] and CFD results by Mamouri et al. [19] to validate the current research. The results from the developed BEM-PSO code were also included for comparison at this Re. In the research conducted by Mamouri et al. [19], the selection of WT blades was influenced by the fluctuating motion caused by the unsteady flow around the turbine. The experiments took place in the Aerodynamics Laboratory at Hakim Sabzevari University using a low-speed wind tunnel. This wind tunnel had an open design, a square test section measuring 40 × 40 cm, and a length of 180 cm, with a contraction ratio of 3:1. Freestream turbulence was measured to be less than 0.1% using a hot-wire anemometer probe in a blade-free test section at the maximum velocity. The highest airspeed achievable in the test section was 30 m/s. To evaluate the uniformity of the velocity profile within the wind tunnel, average velocity profiles were measured across the width of the test section, with the sensor positioned away from wall effects. The blockage ratio in this experiment was maintained below 10%. Moreover, in the study by Mamouri et al. [19] involving CFD, they examined the key factors influencing the unsteady performance of a WT airfoil under harmonic oscillation. Their research aimed to gain a deeper insight into how specific critical parameters impact the instantaneous CL and CD in an unsteady flow subjected to harmonic pitching movements.
In the following, Figure 6 displays the CD variation with AoA for the NACA0012 airfoil at a Re of 23,000, spanning AoAs from −10° to 10°. Overall, Figure 6 demonstrates that XFOIL software effectively predicts experimental CD values compared to JAVAFOIL and CFD results. The developed BEM-PSO code, however, provided results that were closer to the experimental data compared to XFOIL, JAVAFOIL, and CFD, in predicting the CD. This superior performance can be attributed to the developed BEM-PSO code’s enhanced modeling capabilities, including a more accurate representation of flow separation impact.
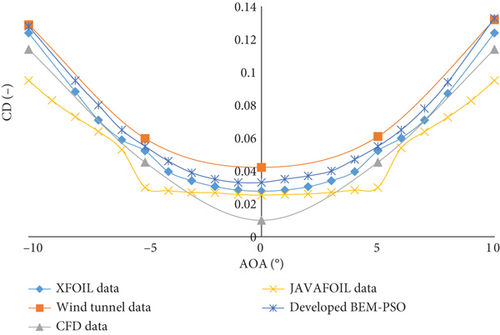
XFOIL cannot predict CD as accurately due to its reliance on simplified aerodynamic models and potential flow theory, which do not fully capture complex flow phenomena like separation and transition. Similarly, JAVAFOIL’s simpler panel method results in more significant errors, particularly in the poststall region. CFD methods, while more sophisticated, often suffer from high computational costs and may still struggle with accurately modeling turbulent and transitional flows, leading to discrepancies with experimental data.
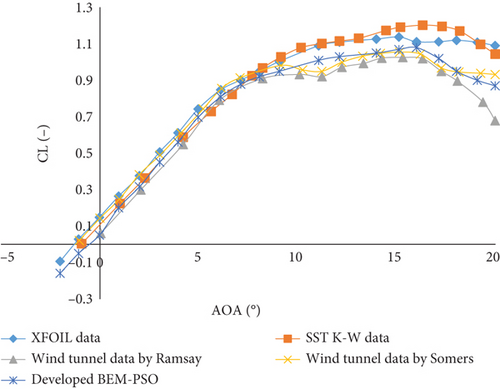
To evaluate the accuracy of the developed BEM-PSO code, we conducted computations for the airflow field around the S809 airfoil across different AoAs ranging from 0° to 20°. The CL obtained is depicted in Figure 7 and compared to experimental findings [20, 21]. Additionally, our results were compared to the numerical findings of Johansen [22] for the same flow configuration.
Ramsy et al. [20] tested an S809 airfoil model in the 3 × 5 subsonic wind tunnel at Ohio State University’s Aeronautical and Astronautical Research Laboratory under steady flow conditions. Also, Somers [21] employed the following wind tunnel for their research. The low-turbulence wind tunnel at Delft University of Technology’s Low Speed Laboratory in the Netherlands is a closed-circuit, single-return atmospheric tunnel. Turbulence levels in the test section range from 0.02% at 10 m/s to 0.04% at 60 m/s. The test section has an octagonal shape, with dimensions of 180 cm in width and 125 cm in height. The tunnel features electrically actuated turntables that enable precise positioning and secure attachment of the two-dimensional model. These turntables are integrated seamlessly with the top and bottom walls of the tunnel and rotate in unison with the model. The rotation axis corresponds to the model’s quarter chord, which is mounted vertically between the turntables, with all gaps between the model and the turntables being sealed.
The XFOIL and SST K-Omega model [22] were also used to compare the CL values of the S809 airfoil. The present XFOIL data align well with experiments up to an AoA of approximately 9° and the SST K-Omega model [22]. However, at larger AoAs (> 9°), a noticeable deviation from experimental data becomes apparent. The XFOIL software accurately predicts the AoAstall at 15°, whereas the numerical model predicts AoAstall at 16°. This discrepancy, also observed in various numerical model studies [23–25], could be attributed to the limitations of turbulence models, particularly their reduced accuracy in predicting CL beyond the AoAstall. Furthermore, as depicted in Figure 7, experimental data from Ramsay et al. [20] and Somers [21] differ significantly, particularly in the region of large AoAs (> 18°). This disparity arises from various experimental conditions, including inflow turbulence intensity, airfoil surface characteristics, and the precision of measuring tools. Nevertheless, at all AoAs, the XFOIL software data exhibit good agreement with computational data [26].
The developed BEM-PSO code, however, provided better predictions of the CL compared to other methods studied. This superior prediction is particularly noticeable after the AoAstall of 16°, showing less error than the results from XFOIL and the SST K-Omega model. The reduced error of the developed BEM-PSO code can be attributed to its enhanced modeling capabilities, which include a more accurate representation of flow separation and transition effects, offering improved predictive performance over other methods, especially the SST K-Omega model.
Finally, the performance of a 0.9-m diameter model HAWT using the National Renewable Energy Laboratory S826 airfoil profile has been investigated both experimentally [27] and numerically [27] at a Re value of 2,000,000 with the developed BEM-PSO code and BEM models. To validate the developed BEM-PSO code, simulations were conducted using the S826 airfoil profile, comparing experimental and numerical results. The BEM predictions were analyzed against experimental data and BEM results in Figure 8. After numerical calculations were investigated using fully three-dimensional CFD simulations using a k-w turbulence model, it was found that the BEM correctly predicts the shape of the Cp curve, with the efficiency coefficient virtually identical to the measurements at the design conditions. Furthermore, the BEM-PSO results exhibited good agreement with experimental data, particularly beyond TSR of 6. This suggests that the developed BEM-PSO code can accurately predict turbine performance under various operational conditions.
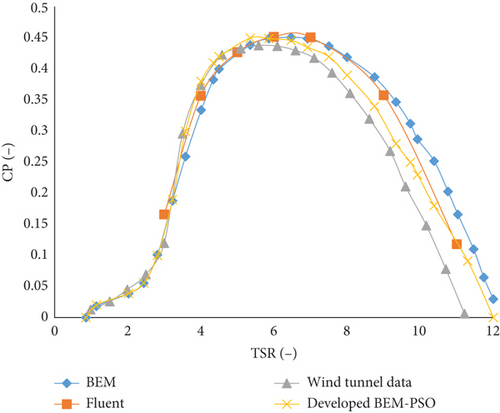
The capability of the BEM-PSO code to outperform three-dimensional CFD models, including the k-w turbulence model, can be attributed to its simplified yet effective modeling approach. BEM focuses on aerodynamic forces and structural dynamics, providing a balance between computational efficiency and accuracy compared to the computationally intensive CFD models. Additionally, BEM captures the overall aerodynamic performance of the HAWT with reasonable accuracy, especially in predicting Cp and efficiency across a range of operating conditions.
4.2. Variation of the Base and Modified Airfoil Performance
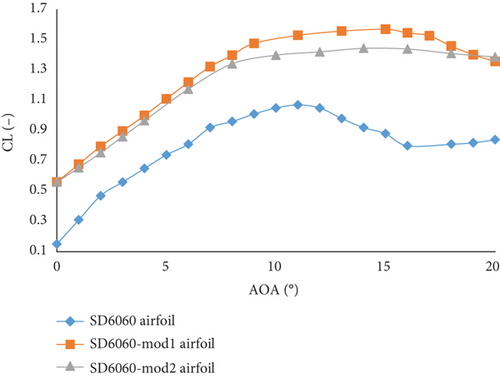
Figure 9 shows the comparison of maximum CL variations for all modified and reference airfoils at a Re of 300,000. Additionally, Figures A2 and A3 in the appendix compares the CL and the CL/CD of the original airfoils with their respective modified versions. The reference airfoil S2055 achieves a maximum CL of 1.03 at an AoAstall of 9°. After modifications, the maximum CL of S2055-mod1 airfoil increases to 1.377 at an AoAstall of 10°, and S2055-mod2 airfoil achieves 1.258 at an AoAstall of 10°. For the SD6060 airfoil, the maximum CL is 1.07 at an AoAstall of 11°. When modified, the SD6060-mod1 airfoil reaches a maximum CL of 1.561 at an AoAstall of 15°, and SD6060-mod2 airfoil achieves 1.439 at an AoAstall of 14°.
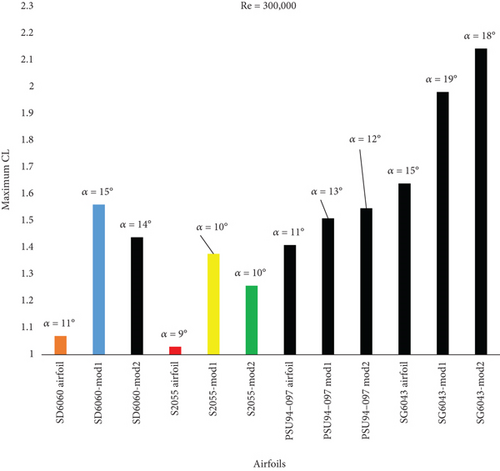
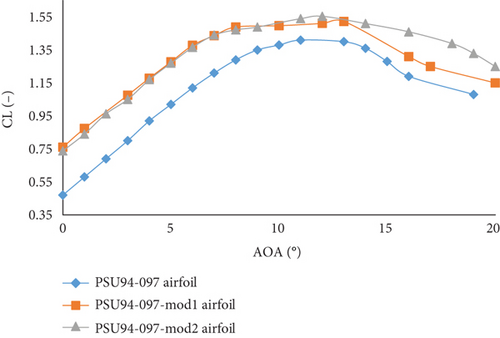
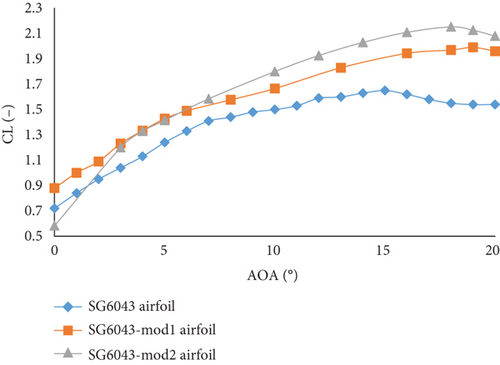
The PSU94-097 airfoil reaches a maximum CL of 1.43 at an AoAstall of 11°. The modified version PSU94-097-mod1 airfoil achieves a maximum CL of 1.51 at an AoAstall of 13°, while PSU94-097-mod2 airfoil achieves 1.547 at an AoAstall of 12°. The SG6043 airfoil has a maximum CL of 1.64 at an AoAstall of 15°. After modification, SG6043-mod1 airfoil reaches a maximum CL of 1.982 at an AoAstall of 19°, and SG6043-mod2 airfoil achieves the highest maximum CL of 2.144 at an AoAstall of 18°.
Comparing the airfoils, the percentage increase in maximum CL is notable. For the S2055 airfoil, the S2055-mod1 airfoil shows a 33.79% increase, and the S2055-mod2 airfoil shows a 22.14% increase. For the SD6060 airfoil, the SD6060-mod1 airfoil shows a 45.98% increase, and the SD6060-mod2 airfoil shows a 34.58% increase. For the PSU94-097 airfoil, the PSU94-097-mod1 airfoil shows a 7.09% increase, and the PSU94-097-mod2 airfoil shows a 9.72% increase. Finally, for the SG6043 airfoil, the SG6043-mod1 airfoil shows a 20.18% increase, and the SG6043-mod2 airfoil shows a 29.94% increase.
The AoAstall for the airfoils also change after modification. The AoAstall for the S2055 airfoil increases from 9° to 10°. For the SD6060 airfoil, the AoAstall increases from 11° to 15° for SD6060-mod1 airfoil and to 14° for SD6060-mod2 airfoil. For the PSU94-097 airfoil, the AoAstall increases from 11° to 13° for the PSU94-097-mod1 airfoil and to 12° for PSU94-097-mod2 airfoil. For the SG6043 airfoil, the AoAstall increases from 15 to 19° for SG6043-mod1 airfoil and to 18° for SG6043-mod2 airfoil.
These modifications lead to several key observations. The SG6043-mod2 airfoil exhibits the highest maximum CL of 2.144, representing a significant increase over the original. Conversely, the S2055 airfoil has the lowest increase in maximum CL after modification, with S2055-mod2 achieving the lowest increase among the modified airfoils. An increase in the AoAstall generally indicates improved performance at higher AoAs, delaying the onset of stall and thus enhancing the airfoil’s operational envelope. The implications of increased AoAstall and CL are substantial. An increased AoAstall allows the airfoil to operate effectively at higher AoA before stalling, providing better maneuverability and lift in critical situations such as takeoff and landing. An increased CL enhances the lifting capability of the airfoil, potentially improving the overall aerodynamic efficiency and performance of the turbine.
In conclusion, modifying the airfoils has led to substantial improvements in their aerodynamic performance, particularly in terms of maximum CL and AoAstall, with SG6043-mod2 showing the most significant enhancements.
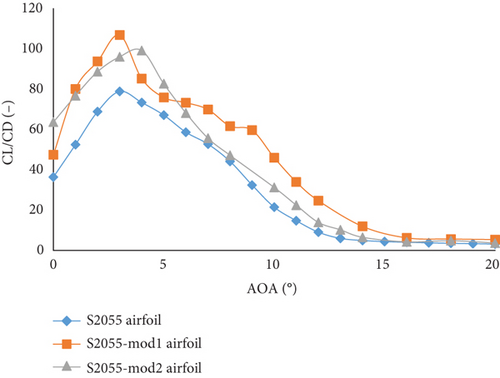
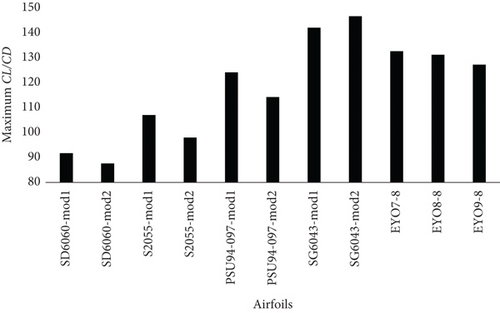
Figure 10 shows the comparison of maximum CL/CD variations for all modified and reference airfoils at a Re of 300,000. Additionally, Figure A4 in the appendix compares the CL/CD of the original airfoils with their respective modified versions.
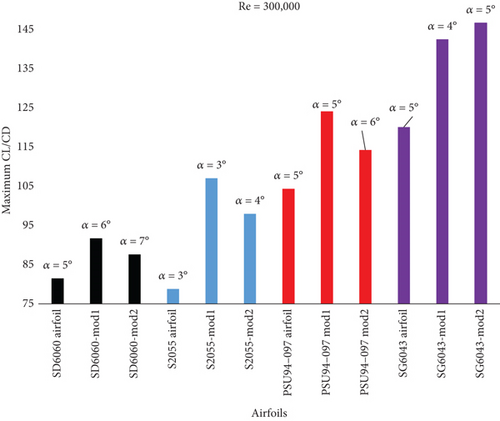
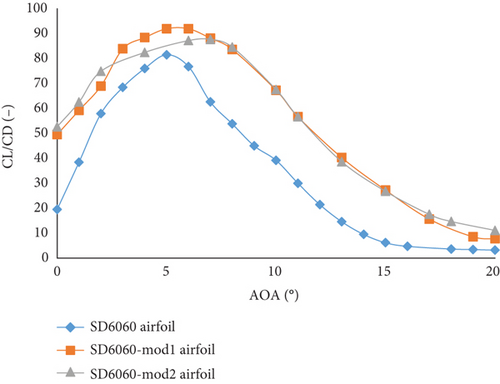
The reference airfoil S2055 achieves a maximum CL/CD of 78.80 at an AoA of 3°. After modifications, the maximum CL/CD of S2055-mod1 airfoil increases to 107.05 at an AoA of 3°, and S2055-mod2 airfoil achieves 97.99 at an AoA of 4°. For the SD6060 airfoil, the maximum CL/CD is 81.5 at an AoA of 5°. When modified, the SD6060-mod1 airfoil reaches a maximum CL/CD of 91.75 at an AoA of 6°, and SD6060-mod2 airfoil achieves 87.63 at an AoA of 7°.
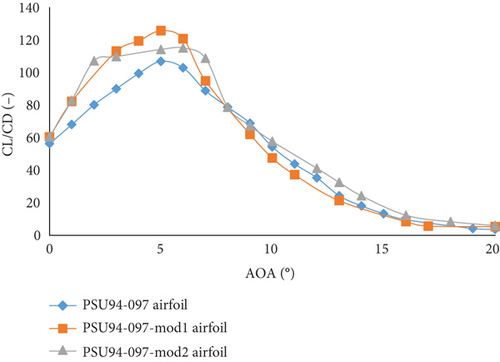
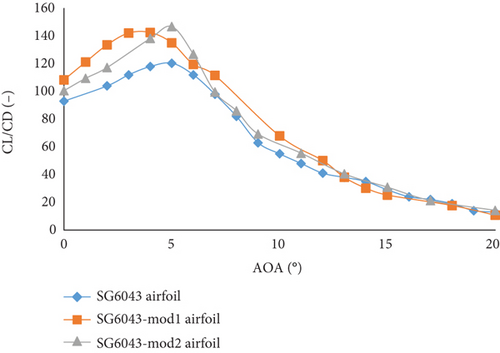
The PSU94-097 airfoil reaches a maximum CL/CD of 104.37 at an AoA of 5°. The modified version PSU94-097-mod1 airfoil achieves a maximum CL/CD of 124.13 at an AoA of 5°, while PSU94-097-mod2 airfoil achieves 114.28 at an AoA of 6°. The SG6043 airfoil has a maximum CL/CD of 120.14 at an AoA of 5°. After modification, SG6043-mod1 airfoil reaches a maximum CL/CD of 142.52 at an AoA of 4°, and SG6043-mod2 airfoil achieves the highest maximum CL/CD of 146.68 at an AoA of 5°.
Comparing the airfoils, the percentage increase in maximum CL/CD is notable. For the S2055 airfoil, the S2055-mod1 airfoil shows a 35.73% increase, and the S2055-mod2 airfoil shows a 24.16% increase. For the SD6060 airfoil, SD6060-mod1 shows a 12.57% increase, and SD6060-mod2 airfoil shows a 7.52% increase. For the PSU94-097 airfoil, the PSU94-097-mod1 airfoil shows an 18.92% increase, and the PSU94-097-mod2 airfoil shows a 9.48% increase. Finally, for the SG6043 airfoil, the SG6043-mod1 airfoil shows an 18.63% increase, and the SG6043-mod2 airfoil shows a 22.11% increase.
The SG6043-mod2 airfoil exhibits the highest maximum CL/CD of 146.68, representing a significant increase over the original. Conversely, the S2055 airfoil has the lowest increase in maximum CL/CD after modification, with S2055-mod2 achieving the lowest increase among the modified airfoils. An increased CL/CD enhances the lifting capability of the airfoil, potentially improving the overall aerodynamic efficiency and performance of the HAWT.
Consequently, modifying the airfoils has led to substantial improvements in their aerodynamic performance, particularly in terms of maximum CL/CD and AoA, with SG6043-mod2 showing the most significant enhancements.
Moreover, the optimized airfoils in this study were compared with those optimized by other researchers [28–35] at a Re of 300,000, as shown in Table A5 and Figure A4. As Table A5 and Figure A4 indicate, the optimized airfoils SG6043-mod1 and SG6043-mod2 exhibit higher maximum CL/CD compared to other optimized airfoils by other researchers.
4.3. Possibility for Electricity Production
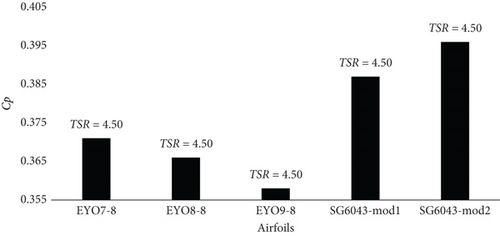
As previously mentioned, the efficiency parameters of the designed airfoils and the baseline SG6043 airfoil were calculated at a Re of 300,000, with wind tunnel speeds ranging from 5 to 6.1 m/s at a height of 12 m. The Cp graphs were generated for three-blade rotors with a radius of 3 m using SG6043-mod airfoils, and their values are displayed in Figure 11a. At a TSR of 4.50, both SG6043-mod1 and SG6043-mod2 airfoil rotors achieved their maximum CP values. The highest Cp value was recorded as 0.396 for the SG6043-mod2 rotor. Additionally, the Cp values of these modified rotors were compared with WT rotors designed by other researchers [12] to meet the electricity demands of residential facilities in developing countries, as referenced in [12, 28]. The Cp values of the EYO-Series airfoils were found to be lower than those of the SG6043-mod airfoils (Figure 11a).
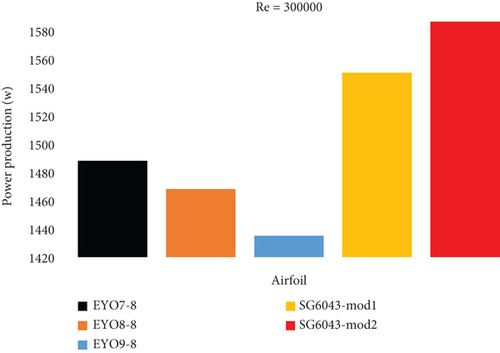
The power generated by the SG6043-mod1 and SG6043-mod2 rotor airfoils was calculated using Equation (7) for a wind speed of 6.1 m/s in the Ghana wind tunnel. Figure 11b shows that the power values calculated in this study for the SG6043-mod airfoils were higher than those generated by the EYO-Series airfoil rotors, as reported by Osei et al. [12]. Despite the lower power output of the EYO-Series airfoils, they were capable of supplying the electricity needs of Ghana [12, 28].
The power generated by the SG6043-mod rotors in this study exceeded that of the EYO-Series rotors. Moreover, considering the electricity requirements of developing countries as detailed in [12, 28], the power output from the SG6043-mod rotors could potentially meet the residential electricity demands of such countries, including Ghana [12].
4.4. The Confidence Level of the Presented Results
To assess the confidence level of the presented results in this paper, data from the developed BEM-PSO software and XFOIL were compared with experimental results from Selig et al. [17] for the SG6043 airfoil at the Re of the current study. Figure 12 shows the CL versus AoA and CL versus CD of the SG6043 airfoil at a Re of 300,000. The variations of CL and CL versus CD with the AoA are shown in Figure 12a,b, respectively.
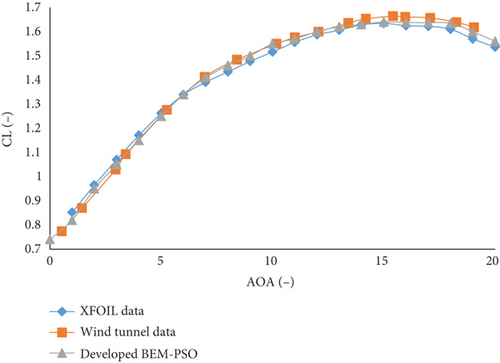
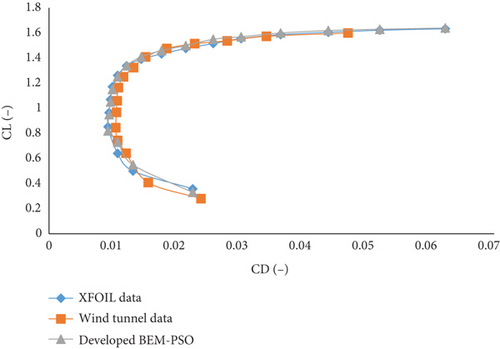
As shown in Figure 12a,b, both the XFOIL software and the developed code can predict the overall trend of the experimental results by Selig et al. [17] well. The two mentioned tools accurately predict the stall angle and the CL, and they also demonstrated acceptable performance for the SG6043 airfoil after stall at a Re of 300,000. Additionally, in Figure 12b, the developed BEM-PSO code predicts the CL versus the CD more accurately than the XFOIL software, thus increasing the reliability of the results.
Overall, when the present results (SG6043 airfoil) were compared with a reference experiment (CL and CD), the baseline results were able to predict the experimental results well and provided an acceptable confidence level for the results presented at a Re of 300,000 for the SG6043 airfoil. The design of the airfoil justifies its potential as an effective way to improve the efficiency of WTs, aircraft, and unmanned aerial vehicles, which aligns with previous studies [36–41].
5. Conclusions
In this study, using airfoil thickness, camber, and the thickness-to-camber ratio—which have been less frequently studied—four airfoils (S2055, SG6043, PSU94-09U, and SD6060) were selected and optimized for increased aerodynamic efficiency using the developed BEM-PSO coupling code. The results showed that the optimized airfoils increased the maximum CL, AoAstall, and maximum CL/CD compared to the reference airfoils.
Additionally, a three-blade HAWT optimized with modified SG6043 airfoils was examined for use in less developed regions (Ghana as a pilot). The research findings demonstrated that the WT designed with SG6043 airfoils recorded a higher maximum Cp and power outputs compared to previous models. The power output of the WT designed with SG6043-mod1 and SG6043-mod2 airfoils increased from 1488 W (in previous studies) to 1550.322 and 1586.38 W, respectively, providing more electricity for these regions.
Furthermore, the developed BEM-PSO code was compared with other common software and was found to predict experimental results with a minor error margin.
The limitations of the current work include several key points. First, the study relies on certain simplifications in the BEM and PSO models, which may not fully capture all complex aerodynamic interactions. Additionally, the results are based on simulations and have not been extensively validated against experimental data, potentially affecting their accuracy.
For future research directions, constructing and installing a HAWT by the company Solar Turbine Arta Energy (STAE) will be a practical next step. The experimental results of this implementation will be detailed in upcoming publications.
Conflicts of Interest
The authors declare no conflicts of interest.
Author Contributions
All authors contributed to the development of the study. All authors read and approved the final manuscript.
Funding
No funding was received.
Appendix A
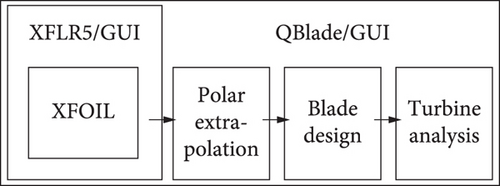
QBLADE is an open-source software package for the design and simulation of WT blades and hydrofoils. It integrates BEM theory with a graphical user interface (GUI) to streamline the design process. The software allows for the modeling of airfoil aerodynamics, structural analysis, and performance prediction. QBlade is frequently used in research and industry for optimizing WT performance and testing new designs. Figure A1 illustrates the schematic representation of the entire QBlade software, showing its component parts and modeling interface.
| SD6060 airfoil | |||||||
|---|---|---|---|---|---|---|---|
| Thickness-to-camber ratio | Thickness (%chord) | At (%chord) | Camber (%chord) | At (%chord) | Maximum CL | AoAstall | Maximum CL/CD |
| Thickness-to-camber ratio = 0.46 | 2.45 | 6.32 | 5.32 | 38 | 1.36 | 10 | 112.25 |
| Thickness-to-camber ratio = 0.56 | 3.14 | 9.28 | 5.60 | 35.14 | 1.38 | 11 | 108.5 |
| Thickness-to-camber ratio = 0.76 | 3.74 | 13.90 | 4.92 | 33.67 | 1.29 | 11 | 106.74 |
| Thickness-to-camber ratio = 1.10 | 1.95 | 19.20 | 1.77 | 28.65 | 1.26 | 12 | 101.08 |
| Thickness-to-camber ratio = 1.75 | 5.74 | 48 | 3.28 | 36.58 | 1.35 | 13 | 94.58 |
| Thickness-to-camber ratio = 1.97 | 11.48 | 20.60 | 5.74 | 40.80 | 1.561 | 15 | 91.75 |
| Thickness-to-camber ratio = 2.86 | 13.22 | 23.00 | 4.61 | 43.30 | 1.439 | 14 | 87.63 |
| Thickness-to-camber ratio = 3.57 | 10.24 | 37.40 | 2.86 | 43.41 | 1.35 | 13 | 86.78 |
| Thickness-to-camber ratio = 4.20 | 9.71 | 31.20 | 2.31 | 39.40 | 1.24 | 13 | 85.16 |
| Thickness-to-camber ratio = 5.08 | 7.20 | 24.52 | 1.41 | 33.47 | 1.12 | 12 | 83.10 |
| Thickness-to-camber ratio = 5.60 (SD6060 airfoil) | 10.37 | 33.92 | 1.85 | 38.52 | 1.07 | 11 | 81.50 |
| Thickness-to-camber ratio = 6.46 | 14.25 | 30.65 | 2.20 | 43.70 | 1.04 | 11 | 78.84 |
| Thickness-to-camber ratio = 7.85 | 11.98 | 35.41 | 1.52 | 31.90 | 1.02 | 10 | 78.44 |
| Thickness-to-camber ratio = 9.60 | 12.74 | 34.10 | 1.32 | 31.85 | 0.96 | 9 | 74.14 |
| Thickness-to-camber ratio = 12.95 | 13.34 | 33.24 | 1.03 | 35.79 | 0.95 | 9 | 71.51 |
| Thickness-to-camber ratio = 14.93 | 13.47 | 34.17 | 1.10 | 35.71 | 0.94 | 8 | 67.41 |
| S2055 airfoil | |||||||
|---|---|---|---|---|---|---|---|
| Thickness-to-camber ratio | Thickness (%chord) | At (%chord) | Camber (%chord) | At (%chord) | Maximum CL | AoAstall | Maximum CL/CD |
| Thickness-to-camber ratio = 0.78 | 3.44 | 12.85 | 4.41 | 43.12 | 1.22 | 8 | 111.74 |
| Thickness-to-camber ratio = 0.83 | 3.33 | 41.30 | 4.00 | 36.10 | 1.377 | 10 | 107.05 |
| Thickness-to-camber ratio = 1.74 | 5.93 | 32.00 | 3.40 | 48.20 | 1.258 | 10 | 97.99 |
| Thickness-to-camber ratio = 2.85 | 6.97 | 37.84 | 2.44 | 36.71 | 1.17 | 10 | 95.14 |
| Thickness-to-camber ratio = 3.41 | 7.33 | 24.57 | 2.14 | 47.65 | 1.12 | 10 | 79.54 |
| Thickness-to-camber ratio = 4.54 (S2055 airfoil) | 7.99 | 34.81 | 1.66 | 44.61 | 1.03 | 9 | 78.80 |
| Thickness-to-camber ratio = 5.12 | 9.45 | 30.12 | 1.84 | 32.47 | 1.03 | 10 | 76.47 |
| Thickness-to-camber ratio = 6.07 | 9.74 | 34.15 | 1.60 | 35.74 | 1 | 10 | 76.14 |
| Thickness-to-camber ratio = 7.82 | 9.94 | 36.12 | 1.27 | 35.74 | 0.98 | 10 | 73.65 |
| Thickness-to-camber ratio = 10.74 | 10.38 | 34.71 | 0.96 | 35.50 | 0.92 | 10 | 69.45 |
| Thickness-to-camber ratio = 13.41 | 11.54 | 33.71 | 0.86 | 36.39 | 0.90 | 10 | 66.74 |
| Thickness-to-camber ratio = 16.67 | 13.98 | 35.65 | 0.83 | 65.74 | 0.87 | 10 | 63.81 |
| PSU94-097 airfoil | |||||||
|---|---|---|---|---|---|---|---|
| Thickness-to-camber ratio | Thickness (%chord) | At (%chord) | Camber (%chord) | At (%chord) | Maximum CL | AoAstall | Maximum CL/CD |
| Thickness-to-camber ratio = 0.54 | 4.08 | 12.62 | 7.55 | 43.79 | 1.55 | 11 | 129.41 |
| Thickness-to-camber ratio = 0.79 | 5.16 | 39.30 | 6.52 | 41.50 | 1.51 | 13 | 124.13 |
| Thickness-to-camber ratio = 0.82 | 5.51 | 32.00 | 6.68 | 40.70 | 1.547 | 12 | 114.28 |
| Thickness-to-camber ratio = 1.25 | 6.80 | 48.01 | 5.44 | 33.97 | 1.45 | 12 | 117.20 |
| Thickness-to-camber ratio = 1.36 | 7.04 | 45.06 | 5.17 | 33.12 | 1.41 | 12 | 116.02 |
| Thickness-to-camber ratio = 1.49 | 7.48 | 43.84 | 5.02 | 35.12 | 1.43 | 12 | 113.98 |
| Thickness-to-camber ratio = 1.65 | 7.67 | 35.64 | 4.64 | 39.41 | 1.41 | 12 | 111.32 |
| Thickness-to-camber ratio = 1.87 | 8.14 | 30.01 | 4.35 | 33.78 | 1.35 | 12 | 107.22 |
| Thickness-to-camber ratio = 2.36 (Psu94-097 airfoil) | 9.70 | 32.30 | 4.10 | 46.30 | 1.43 | 11 | 104.37 |
| Thickness-to-camber ratio = 3.15 | 11.05 | 29.15 | 3.50 | 45.40 | 1.15 | 13 | 100.02 |
| Thickness-to-camber ratio = 4.20 | 12.50 | 26.30 | 2.97 | 38.84 | 1.07 | 13 | 96.72 |
| Thickness-to-camber ratio = 4.87 | 28.65 | 38.64 | 5.88 | 52.14 | 1.05 | 12 | 86.41 |
| Thickness-to-camber ratio = 5.12 | 12.65 | 35.21 | 2.47 | 36.47 | 1.02 | 12 | 84.10 |
| Thickness-to-camber ratio = 5.98 | 14.68 | 41.20 | 2.45 | 49.64 | 0.95 | 13 | 74.12 |
| Thickness-to-camber ratio = 9.65 | 15.94 | 39.84 | 1.65 | 32.15 | 0.92 | 13 | 63.48 |
| SG6043 airfoil | |||||||
|---|---|---|---|---|---|---|---|
| Thickness-to-camber ratio (-) | Thickness (%chord) | At (%chord) | Camber (%chord) | At (%chord) | Maximum CL | AoAstall | Maximum CL/CD |
| Thickness-to-camber ratio = 0.48 | 3.74 | 33.15 | 7.79 | 35.12 | 1.66 | 14 | 154.74 |
| Thickness-to-camber ratio = 0.84 | 6.74 | 14.85 | 8.02 | 48.41 | 1.75 | 14 | 150.44 |
| Thickness-to-camber ratio = 1.32 | 10.58 | 11.46 | 8.01 | 52.10 | 1.982 | 19 | 142.52 |
| Thickness-to-camber ratio = 1.52 | 12.20 | 10.64 | 8.02 | 55.32 | 2.14 | 18 | 146.68 |
| Thickness-to-camber ratio = 1.82 (SG6043 airfoil) | 10.02 | 32.10 | 5.50 | 49.70 | 1.64 | 15 | 120.14 |
| Thickness-to-camber ratio = 1.86 | 11.74 | 25.14 | 6.31 | 60.50 | 1.64 | 15 | 104.05 |
| Thickness-to-camber ratio = 2.05 | 11.92 | 20.04 | 5.81 | 54.19 | 1.56 | 15 | 103.74 |
| Thickness-to-camber ratio = 2.17 | 11.98 | 22.14 | 5.52 | 55.74 | 1.51 | 16 | 103.01 |
| Thickness-to-camber ratio = 2.35 | 12.07 | 25.14 | 5.13 | 57.65 | 1.49 | 16 | 102.74 |
| Thickness-to-camber ratio = 2.75 | 12.30 | 26.97 | 4.47 | 55.14 | 1.39 | 16 | 98.42 |
| Thickness-to-camber ratio = 3.04 | 12.81 | 30.14 | 4.21 | 52.76 | 1.35 | 16 | 93.02 |
| Thickness-to-camber ratio = 3.51 | 13.15 | 33.74 | 3.74 | 51.97 | 1.32 | 16 | 88.65 |
| Thickness-to-camber ratio = 3.96 | 13.84 | 36.71 | 3.49 | 52.08 | 1.30 | 17 | 86.74 |
| Thickness-to-camber ratio = 5.12 | 14.67 | 36.41 | 2.85 | 49.64 | 1.23 | 17 | 73.08 |
| Thickness-to-camber ratio = 7.64 | 16.05 | 39.44 | 2.10 | 46.74 | 1.19 | 17 | 63.74 |
| Thickness-to-camber ratio = 11.05 | 16.82 | 41.74 | 1.52 | 42.32 | 1.14 | 17 | 55.74 |
| Thickness-to-camber ratio = 13.74 | 18.21 | 44.74 | 1.32 | 36.83 | 1.10 | 17 | 50.71 |
| Airfoils | |||
|---|---|---|---|
| FX63-137 (thickness-to-camber ratio = 13.6) [29] | 1.49 | 97.10 | |
| SG6041 (thickness-to-camber ratio = 10) [29] | 0.65 | 72.30 | |
| S6062 (thickness-to-camber ratio = 8) [29] | 0.65 | 73.10 | |
| S7012 (thickness-to-camber ratio = 8.8) [29] | 0.71 | 72.10 | |
| SD6060 (thickness-to-camber ratio = 10.4) [29] | 0.72 | 73.5 | |
| NACA2414 (thickness-to-camber ratio = 14) [29] | 0.90 | 66.6 | |
| S822 (thickness-to-camber ratio = 16) [29] | 0.88 | 69.4 | |
| SD7037 (thickness-to-camber ratio = 9.2) [29] | 0.84 | 76.3 | |
| Clark-Y (thickness-to-camber ratio = 11.7) [29] | 0.85 | 77.2 | |
| A18 (thickness-to-camber ratio = 7.3) [29] | 0.8 | 79.6 | |
| E387 (thickness-to-camber ratio = 9) [29] | 0.93 | 81.70 | |
| SG6042 (thickness-to-camber ratio = 10) [29] | 0.92 | 104 | |
| S823 (thickness-to-camber ratio = 21) [29] | 1.05 | 62.7 | |
| BW-3 (thickness-to-camber ratio = 5) [29] | 1.05 | 69.6 | |
| SG6040 (thickness-to-camber ratio = 16) [29] | 1.11 | 78.70 | |
| GO 417a (thickness-to-camber ratio = 2.9) [29] | 1.08 | 82.30 | |
| SD7032 (thickness-to-camber ratio = 10) [29] | 1.00 | 83.4 | |
| SG6043 (thickness-to-camber ratio = 10) [29] | 1.16 | 105.4 | |
| SD7062 (thickness-to-camber ratio = 14) [29] | 1.23 | 77.50 | |
| LRN 1007 (thickness-to-camber ratio = 7.3) [29] | 1.22 | 106.75 | |
| ProfilGA (Optimization of SG6042 airfoil using GA) [30] | 0.92 | 105 | |
| S809 (thickness-to-camber ratio = 21.20) [31] | — | 55.8 | |
| Original RG-15 (thickness-to-camber ratio = 8.9) [32] | 1.207 | 78.39 | |
| Modified RG15 airfoil [32] | RG15-(10)-70-1 | 1.252 | 77.57 |
| RG15-(20)-70-1 | 1.289 | 77.03 | |
| RG15-(30)-70-1 | 1.319 | 76.75 | |
| RG15-(40)-70-1 | 1.342 | 76.00 | |
| RG15-(50)-70-1 | 1.351 | 75.15 | |
| E387 optimized [36] | — | 142 | |
| Modified FX 63-180 [33] | FX 63-180 A X0 Y0 | 0.7913 | 37.76 |
| FX 63-180 A X-1 Y-1 | 0.914881 | 44.20 | |
| FX 63-180 A X+1 Y-1 | 0.908341 | 43.48 | |
| FX 63-180 A X-1 Y-2 | 0.970993 | 46.48 | |
| FX 63-180 B X0 Y0 | 0.829601 | 39.92 | |
| FX 63-180 B X-1 Y-1 | 0.944458 | 46.66 | |
| FX 63-180 B X+1 Y-1 | 0.957234 | 48.11 | |
| FX 63-180 B X-1 Y-2 | 0.993575 | 48.90 | |
| DU93W210 unmodified airfoil [34] | 1.18 | 42.24 | |
| DU93W210 modified airfoil [34] | Nonintrusive tubercle | 1.19 | 41.35 |
| Intrusive tubercle | 1.17 | 36.43 | |
| Very intrusive tubercle | 1.14 | 27.72 | |
| DU 06-W-200 (thickness-to-camber ratio = 39.6) [35] | 1.42 | 73.17 | |
Open Research
Data Availability Statement
The datasets generated during and/or analyzed during the current study are available from the corresponding author upon reasonable request.


