Contribution of Daylighting to Saving Electrical Energy in Cameroon: Case Study of a Classroom in a Public School
Abstract
The need for electrical energy in Cameroon is growing and supply is not keeping up with demand. The solutions proposed so far relate to the construction of new hydroelectric dams and solar power plants, but this requires a lot of time and enormous financial resources. In this work, we develop a method for reducing the energy bill by adjusting lighting level while remaining within regulatory margins. This method highlights the use of a dimmer which allows the lighting level of the luminaires to be adjusted from 0% to 100% of their value. Thus, by combining the contribution of natural outdoor lighting with that of artificial indoor lighting, we are able to significantly reduce the quantity of electrical energy consumed by a classroom during the day. In our case study, by dividing the classroom into 99 measurement points, we collect data on illuminance levels by simulation using DIALux software and by direct measurement using a luxmeter. Applying the optimization algorithm designed for this purpose brings the average illuminance level down to 300lx following the EN12464 standard. Finally, taking into account the cost of kWh practiced in Cameroon, this saving goes up to 57.85% depending on the daily lighting level. This solution could make it possible to partially resolve the energy deficit in the time necessary for the construction of new power plants.
1. Introduction
One of the challenges that the world will face by 2050 is the need for energy in all its forms [1, 2]. The growth of the population and the number of industries is one of the aggravating factors. The depletion of fossil resources pushes researchers to find new forms, or sources, of energy to avoid finding themselves years later in a war whose goal is to have the remaining available energy in the world.
To solve this problem, many studies have been carried out in various fields. In several countries around the world, research has become contextualized. For example, in China, the study carried out by [3] presents the use of simulation-optimization tools to find the optimal compromise between minimizing energy consumption for heating and lighting, reducing the period of discomfort in summer, and maximizing the useful illuminance of daylight (UDIavg, between 100 and 2000 lx). In France, using genetic algorithms (GAs), the authors in [4, 5] are developing a method that takes into account the multicriteria aspect of building renovation to resolve the energy crisis problem where the implementation of low-consumption buildings is required. In Canada, the authors in [6] found that uncertainties due to occupant behavior and building operation are rarely taken into account in the optimization process and, to solve this problem, combined stochastic modeling of occupant behavior with the optimization of building performance. Finally, in Cameroon, studies on the dimming coefficients of lighting fixtures have made it possible to achieve significant energy optimizations [7].
Regarding the optimization of lighting consumption, several researchers have approached the problem in different ways. In 2016, Madias et al. [8] proposed an optimization model using an evolutionary multiobjective GA NSGA-II to optimize the two objectives of reducing the energy consumption of buildings and improving the uniformity of lighting fixtures in buildings. The chosen case study shows that the optimization model allows significant energy savings of the order of 18%–22% for a system that does not take into account daily lighting. In 2017, Plebe et al. [9] proposed a more flexible approach to indoor lighting design by considering the mean illumination Em, the uniformity Uo, and the energy consumption. The solution integrates the 3D graphics software Blender to reproduce architectural spaces and simulate lighting effects using NSGA-II. In 2019, Mandal et al. [10] applied the particle swarm optimization (PSO) algorithm to the indoor lighting design (ILD) problem. They organized some conflicting objective parameters, such as average illuminance, overall uniformity, unified glare index (UGR), cost, and lighting power density (LPD), by weighting them into a single-objective optimization model. This model consists of three decision variables (regular spacing of luminaires along the length and width and luminaire mounting height). Thus, a loop in the program determines the number of luminaires, which makes the algorithm inefficient. The approach we propose combines the NSGA-III algorithm, which is an evolved variant of the NSGA-II algorithm proposed by Deb et al. [11], the colors of the walls in the sample room, artificial lighting, and daylighting to increase possible energy savings while complying with the illuminance values prescribed by standard EN12464.
Concerning Cameroon, much remains to be done in the energy sector [12–14]. To achieve this emergence on the energy level, major projects have been launched [15, 16] such as the construction of the Mekin (15 MW), Nachtigal (420 MW), and Lom Pangar (30 MW) power plants to name only a few. However, the construction of these power plants requires several years and by considering the economic crisis faced by the country at the time we are writing this article, that solution seems ineffective for occasional problems. Much more, the COVID-19 crisis which hit the world at the end of 2019 and throughout 2020 did not make things easier. Taking all of the above mentioned into account, one-off solutions that can be applied without delay are welcome.
In Cameroon, and particularly in the building sector, lighting consumes a non-negligible part of total energy. In this article, we are interested in the consumption of luminaires in a classroom and, therefore, propose an approach to optimize energy consumption by taking into account the contribution of natural daylight. This lighting is coupled with that provided by the lighting fixtures. Thus, by combining the contribution of natural outdoor lighting with that of artificial indoor lighting, we can significantly reduce the quantity of electrical energy consumed by a classroom during the day.
The work is organized as follows: in Sections 2 and 3, the optimization methodology and its application to our study case are presented. Various scenarios are simulated. The validation of these simulations is presented and discussed in Section 4. In Section 5, we draw the concluding words of this research work.
2. Methodology
2.1. Description of the Test Classroom
Our analysis is carried out in one of the classrooms of the Electrical Engineering department at the National Advanced School of Engineering of Yaoundé (NASEY) in Cameroon. Table 1 gives the dimensions of this classroom while Figure 1(a) shows its visual representation. The considered classroom is powered by a set of 9 luminaires with a unit power of 2 × 20 W distributed as depicted in Figure 1(b). The sun’s rays reach the room level through the windows as can be seen in Figure 1(a).
| Length (m) | 8.31 |
| Width (m) | 5.59 |
| Height (m) | 3.00 |


2.2. Model Formulation

In the literature, the most present optimization methods in the field are GAs [8, 25, 26] and artificial neural networks (ANNs) [7, 27, 28]. They highlight the use of particular software like DIALux for simulations and the results obtained allow to have interesting results in terms of energy efficiency. The percentages of energy saved are up to 34% [26] in some cases. Our approach starts from a particular type of GA, precisely NSGA-III, to build an optimization model taking into account the colors of the walls of the room [21], the minimum references of the illumination levels admitted by the EN12464 standard, and daylight to increase the amount of energy saved (up to 50% in some cases). Tables 2 and 3 give a summary of the similarities and differences between two frequently used methods and the approach we propose.
| Algorithm/techniques | Focus area | Model training | Room color | Daylight | Artificial light | EN 12464 standard |
|---|---|---|---|---|---|---|
| ANN |
|
Yes | No | Yes/no | Yes | Yes/no |
| GA |
|
No | No | Yes/no | Yes | Yes/no |
| Proposed approach |
|
No | Yes | Yes | Yes | Yes |
| Algorithm/techniques | Complexity | Computing time | Period of the year | Energy saved |
|---|---|---|---|---|
| ANN | +++ | +++ | + | ++ |
| GA | ++ | ++ | ++ | ++ |
| Proposed approach | + | ++ | +++ | +++ |
The common goal of the different methods is to reduce the amount of energy consumed, but the approaches are different. While the ANN model requires training the system first, which makes the algorithm more complex, GA methods are quite demanding in terms of iteration time in most cases. By simultaneously integrating several parameters such as the colors of the walls of the room, daily, and artificial lighting, we can increase the amount of energy saved while remaining within the values prescribed by the EN12464 standard. The implementation of our approach is easy although it strongly depends on the time of year and, therefore, a bad climate would reduce the energy savings that can be achieved.
2.3. Mathematical Modeling of Efficiency Calculation
3. Implementation of the Methodology
3.1. Measurements by Simulation
We carry out modeling on the DIALux software Version 4.13 [29] of the classroom described in the methodology section with a calculation frame of 11 × 9. This means that we will have 99 measurement points (see Figure 3). We choose a luminaire equivalent to that installed in the classroom in the manufacturers’ catalogs (Table 4) and we carry out the simulation (see Figure 4). The 3D view of the classroom modeled and simulated on software is presented in Figure 5.

| Visual form: |  |
|---|---|
| Dimensions: | 1509 × 165 × 61 mm |
| Total electric power: | 2 × 20 W |


3.2. Experimental Measurements
We mark on the floor of the classroom the 99 measurement points defined by the calculation framework (see Figure 6). These points are all equidistant from each other. Using a luxmeter, we measure the different levels of illumination in the presence and absence of daylight. These measurements are carried out for each of the 99 points defined by the calculation frame (9 × 11) as presented in Figure 3. It should be noted that the measurements are taken at 0.8 m from the ground which corresponds to the work plane. Also, to carry out the experimental study, we used the material listed in Table 5.

| No. | Designation | Image view |
|---|---|---|
| 01 | Dimmer |  |
| 02 | Meter |  |
| 03 | Watch |  |
| 04 | Luxmeter |  |
| 05 | Luminaires | 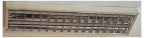 |
4. Results and Discussion
The simulated data and those measured are given in Figure 7. The simulation is carried out with a lamp maintenance factor of 0.5, taking into account the level of lamp aging. We see that the two curves are almost superimposable. The differences observed are due to measurement errors and the lamp maintenance factor. Also, the value of the average artificial lighting by measurement with the luxmeter is 164 lx. This value is less than 300 lx prescribed by standard EN12464. As already highlighted, this can be due to the age of the luminaires and the lack of maintenance. It is, therefore, recommended to carry out maintenance to correct this by cleaning the luminaires or replacing them to have a compliant regulatory value.

Figure 8 shows the evolution of daily lighting depending on the time of day. These measurements are taken on three different days (in January) to better assess the evolution of the level of light. The measurements are taken at a specific position in the room but at different times of the day. We see that it increases until reaching a peak between 10 a.m. and 12 p.m. and then begins to decrease until reaching zero at around 6 p.m. The daily lighting level changes depending on the radiation perceived. It is, therefore, difficult to accurately predict the daily radiation but we can have an idea of its evolution.

By combining daylight with artificial lighting in the classroom, we obtain the graph in Figure 9 for the 99 measurement points. Note that this measurement was taken around 11 a.m., that is, to say when the daily intake was reaching a maximum. Using equation (1), we calculate Ema and Emj and obtain the total illumination using equation (3). This total average illuminance is equal to 654 lx.

As the standard sets the minimum lighting level in a classroom at 300 lx, we see that ET is greater than 300 lx. The additional illuminance which is the difference between the total illuminance and the normative illuminance represents the part to be reduced to zero to achieve our energy savings.
The principle of calculating the dimming factors developed by [7] is then applied to arrive at the result ET = En and, therefore, to make an energy saving varying from 0% to 100% depending on the hours of the day. This saving is possible when daily lighting is maximum. Taking into account the evolution profile of daylight, we can draw the energy-saving profile as presented in Figure 10. Given that the value of artificial lighting is already lower than that prescribed by the standard certainly due to the aging of the lamps and the need to ensure maintenance on the luminaires, the values of 0% energy saved mean that the lamps are all on and operating at 100% of their capacities. Since daylight is important, 100% savings assume the lights are completely turned off during the relevant time slots.

If we calculate the consumption over a month due to the lighting of this classroom, knowing that the kWh costs 50 XAF for subscribers whose monthly consumption is less than 110 kWh (as specified by the company distributing electricity in Cameroon), and using equation (6), we obtain the value of 5940 XAF. This value does not take into account value-added tax (VAT). Taking into account the principle of optimization, this cost is reduced to 2504 XAF (using equation (8)). This, therefore, makes it possible to reduce lighting expenses with an energy saving of approximately 57.85% (using equation (9)).
By applying this principle to all rooms in the establishment, the savings made will increase. This just requires associating an intelligent dimmer (develop using the flowchart of Figure 2) with the lighting system, which will vary the lighting depending on the time of day and the desired level of lighting.
5. Conclusion
In Cameroon’s emergence strategy by 2035, the search for an energy optimization solution led us to propose a method for optimizing the lighting consumption of a classroom in a public establishment. Thus, we considered the contribution of daylighting associated with artificial lighting but in proportions respecting the minimum values proposed by the EN12464 standard. The data collected, processed, and analyzed showed that savings in energies are possible when daylight is combined with artificial lighting with significant gains around 10 a.m. and 11 a.m. The evaluation of consumption in XAF showed that we can achieve a money-saving of approximately 57.85%. This solution can therefore allow the country to better manage available resources while waiting for the installation of power plants planned and under construction. Also, the money saved can be used to finance other projects that will contribute to the country’s emergence. Finally, this work could later be used to develop a design model in the DIALux software that incorporates the climate parameter for each region of the country. The resulting model could then be extended to street lighting.
Conflicts of Interest
The authors declare no conflicts of interest.
Funding
No funding was received for this research.
Acknowledgments
The first author would like to thank the level 3 students whose classroom was used for testing, for their cooperation, and help when taking the data for the article. Special thanks to Dr Théophile Fozin for valuable suggestions and reading of this paper.
Open Research
Data Availability Statement
The data that support the findings of this study are available from the corresponding author upon reasonable request.