Numerical and Experimental Analysis of Base Cavity and Windshield Angle for Aerodynamic Drag Reduction of a Bus
Abstract
In reaction to increasing gasoline costs, scarcity of fuel, and environmental issues, the automotive sector has concentrated on decreasing aerodynamic drag in order to lower vehicle fuel usage and carbon dioxide emissions. Buses are a popular mode of transportation, and knowing their aerodynamics helps to make them more effective and reduce drag. The purpose of this study was to reduce the Bishoftu bus’s aerodynamic drag by using base cavity configurations and altering the angle of the windshield. ANSYS 19.2 was used to perform a computational fluid dynamics (CFD) simulation to assess the aerodynamic performance of vehicle models at different speeds with 3D CAD models created in SOLIDWORKS 21. Wind tunnel tests were also performed to validate the numerical results of the reference bus model. The drag coefficient results revealed an average error percentage of 6.09% between the CFD and wind tunnel tests. Applying a 12° base cavity angle with a tapered depth of 0.3H to the baseline model reduced the average drag coefficient by 7.06%. The study also looked at how changes in windshield angle affected the baseline model’s aerodynamic properties. It discovered that these changes led to a smaller stagnation pressure region and a maximum average drag coefficient reduction of 17.12%. Additionally, a study was conducted on the combined impact of base cavity layouts and differences in windshield angles. Model 26, which has a 17° windshield angle, a 12° base cavity angle, and a 0.3H tapered base cavity length, obtained the minimal average drag coefficient (Cd) and drag force (Fd) values of 0.4779 and 1420.97 N, respectively. With this improved model, the drag coefficient was lowered by 25.22% and the drag force by 26.6%. This led to a maximum reduction in fuel consumption of 3.66 L/h and the highest average annual CO2 savings of 48.35 tonnes/year. Lastly, by prioritizing the main purpose of the study, the response surface methodology was used to do multiobjective optimization. The best measurements were found to be an 11.54° base cavity angle, a 17° windshield angle, and a tapered base cavity length that was 0.3 times the vehicle’s height (0.3H).
1. Introduction
The quest to reduce dependence on oil-based fuels has been a long-standing goal driven by the desire to enhance the cost–benefit dynamics of products and mitigate potential adverse environmental effects. The transportation industry has been a significant contributor to greenhouse gases, which lead to global warming. Vehicle emissions such as carbon dioxide (CO2), HC, and NOx are highlighted as major sources that lead to global climate change. These days, the global war crisis-related rise in gas prices has led to a growing desire within the motor vehicle industry for vehicles to use less fuel. A vehicle’s consumption of fuel is influenced by a variety of internal and external elements, including rolling, drag, and drivetrain losses, as well as traffic, wind, and the condition and slope of the road. Aerodynamic efficiency enhancement is one of the chances that vehicle makers use to reduce the consumption of fuel [1, 2].
Aerodynamic efficiency is a critical aspect of vehicle design and performance. It refers to a vehicle’s capacity to reduce air resistance or drag as it passes through the air. Higher aerodynamic efficiency results in less drag, better fuel efficiency, and increased overall performance. As a result, it became critical for automotive companies to create aerodynamically efficient, long-range vehicles with low polluting emissions. Vehicles that are designed with aerodynamic efficiency are more likely to use less fuel, emit less CO2, and have enhanced driving stability. It is possible to improve aerodynamic drag significantly, as it can account for as much as 80% of the overall motion constraints in vehicles. The most typical approach to increase the aerodynamics of a vehicle is to adjust the outside vehicle design. In general, vehicle aerodynamics is a subject of study that has obtained a lot of interest to lessen drag and consequently fuel consumption and emissions [1, 3].
Despite the rail network, buses are the most used means of public transportation worldwide. They have recently introduced improved engines with modern types of equipment, which reduces the usage of fuel significantly, but it continues to cause problems, while the vehicle is driven at high speeds. The majority of buses are known to have inefficient fuel usage, especially at high speeds. As a result, efforts to improve the aerodynamics of bus forms to minimize vehicle fuel consumption have been continued. These enhancements aim to improve how buses interact with the air by lowering drag. Reduced acceleration resistance enables quicker speeds with the same amount of power or slower speeds with the equivalent power output. The bus’s aerodynamically effective design minimizes drag, enhancing its fuel consumption. It is also essential to design a vehicle body shape that maximizes downforce and negative lifts with the least amount of drag force [4, 5].
The aerodynamic investigations of vehicles are performed through experiments in the wind tunnel or by using computational fluid dynamics (CFD) analysis tools. In the early phases of design, before the vehicle is made to fulfill a specific function, a wind tunnel or a numerical approach might be utilized. Once the vehicle has been developed, it may be tuned and inspected on the road. Wind tunnels are laboratory facilities in which vehicles can be subjected to various airflow conditions. Engineers can replicate the airflow around a vehicle and measure the effects of forces impacting it by placing a prototype or a full-size vehicle inside a wind tunnel. It gives useful information for improving the vehicle’s design and maximizing its aerodynamic performance. Due to their computational power and affordability, CFD becomes a commonly used method in a wide range of engineering disciplines. CFD analyzes the flow of air around a vehicle using numerical methods and computer simulations. It can simulate airflow, pressure distribution, and other aerodynamic factors by dividing the vehicle into smaller computing cells and solving complex mathematical equations. Engineers can use this technology to observe and analyze the flow field, find areas of high drag, and optimize the vehicle’s shape and features as a result [6, 7].
Efforts to improve the aerodynamics of bus forms continue to evolve by focusing on minimizing aerodynamic drag. While transitioning to better aerodynamic shapes results in potential fuel savings, the cost and feasibility of implementing design changes are challenges raised by manufacturers. Several tactics and technologies are being used to optimize bus-air interaction, particularly at high speeds. One strategy is to improve the outside design of buses to reduce drag-inducing characteristics. This entails smoothing down shapes, reducing sharp edges, and providing a consistent flow of air around the bus. The other approach is the utilization of aerodynamic devices integrated spoilers, air deflectors, and optimized wheel designs to enhance aerodynamic efficiency [6]. Belachew et al. [8] researched minimizing the aerodynamic drag of the locally made FSR Isuzu bus by improving the frontal body configuration. The result shows a maximum drag coefficient reduction of 24.03% achieved at 80 kmph. Daniel et al. [9] studied the influence of vortex generators, lateral devices, and rails on the drag of the bus. With the devices, the bus’s flow behavior was get changed, leading to a highest decrease in the coefficient of drag of 8.63% and a drop in fuel usage of 3.92%. Martín-Alcántara et al. [10] investigated the reduction of drag resulting from the implementation of a multicavity at the rear end of the bluff body. The results show that the use of a multicavity significantly reduces the flow’s randomness, resulting in a wake that is considerably less chaotic and almost two-dimensional. Base bleed was used in the study by Sivaraj et al. [11] to minimize aerodynamic drag and usage of fuel in road vehicles. According to the results of the experiment, installing base bleed at an optimal location on the vehicle’s front and rear sides enhances efficiency and reduces drag coefficient by 6.18%. Baek and Lee [12] researched on vehicle drag reduction using rear blowing. A 6% reduction in drag was obtained with just the roof blown, and a 7.5% reduction in drag was obtained when the vehicle’s roof and sides were blown. Bayindirli and Celik [13] studied the nonsmooth surface plate impact on the reducing flow separation. Its use on the minibus frontal roof area was found to reduce the coefficient of drag by an average of 1.03%, resulting in a 0.5% minimization of fuel usage.
Regardless of this progress, existing studies primarily focus on external body streamlining as a drag reduction mechanism, which does not consider the internal space of the buses or the driver’s visibility. In addition, attempts to detect detailed pressure and velocity distributions in the wake region are minimal [14, 15]. Most of the aerodynamic investigations of the base cavities are performed on sport utility vehicles (SUVs) and Ahmed body, and their effect on buses is not investigated. Even within the context of SUVs, the optimization of base cavities in consideration of multiple factors and the integration of varied outputs or responses remains inadequately addressed [16, 17]. Although the optimal windshield angle varies by vehicle, determining buses’ optimal angle with the inclusion of multiple variables is still insufficiently examined [18].
This study advances the current understanding of how to improve aerodynamic drag and fuel efficiency by optimizing the aerodynamic features of buses with a focus on multiple objectives. Furthermore, it clearly offers a thorough examination of the wake region. To achieve this, rear cavities of different geometries and windshield angles were analyzed at different vehicle speeds. The analysis was conducted using CFD, and experimental wind tunnel tests were carried out to validate the baseline model’s CFD results. Also, the amount of fuel and CO2 saved due to the aerodynamic drag improvement of the baseline bus was analyzed. In the end, a multifactor optimization was carried out with response surface methodology (RSM), offering a thorough approach to enhanced bus aerodynamics.
2. Methodology
2.1. Drag Reduction Mechanisms Applied to Baseline Model
Multiple drag reduction approaches were used in this study, and their aerodynamic effectiveness was studied using CFD and wind tunnels. The study analyzed 29 modified models of aerodynamic performance on the Bishoftu bus baseline model. The first strategy utilized in this study to reduce drag was to raise the pressure distributions at the low-pressure base caused by suction on the surfaces that face back, particularly in the separated flow areas at the bus’s base. Reducing the drag at the back end concentrates on building up the base’s pressure. The intended base pressure distribution was increased by using base cavity designs. The base cavity lengthens the recirculating zone at the back of the vehicle, allowing for pressure recovery while symmetrizing the flow and reducing asymmetry-related drag. The basic cavity configuration that was employed was the tapered base cavity, which reduces drag more than straight cavities [19]. It was applied to the top rearward and sideward edges, leaving the bottom rearward at a 0° diffuser angle because the bottom rear end of the baseline already had a tapered diffuser.
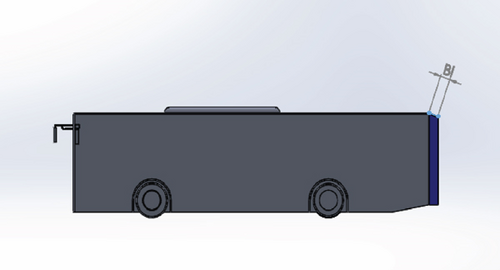
The optimal dimensions of a base cavity vary depending on the vehicle model. The effectiveness of a base cavity is determined by several factors, including cavity geometry, Reynolds number, and angle of attack [19, 20]. Howell et al. [21] studied the reduction of the bluff body drag using base cavities and found an optimal base cavity depth at 45% of the model height that achieves a 0.027 decrease in drag coefficient; however, Evrard et al. [22] agree with Howell et al. [21] on the drag coefficient mitigation intensity, while the optimum base cavity depth was 27% model height. Howell et al. [17] examined solid wall cavities on a 25% Windsor model. The authors identified from the result a finest cavity length of 35% of the height of the model with a drag coefficient reduction of 0.03. Therefore, it is important to consider the specific geometry and design of each vehicle when designing an effective base cavity. A variety of base cavity lengths was used in this study as a balance between practicality and drag reduction and also includes the minimum length which has not been studied yet. The base cavity lengths studied in this study as nondimensionalized depth associated with vehicle height to carry out the parametric study were 0.1 times base model height (0.1H), 0.2 times base model height (0.2H), and 0.1 times base model height (0.3H). Figure 1 illustrates the base cavity length representation on the modified bus model.
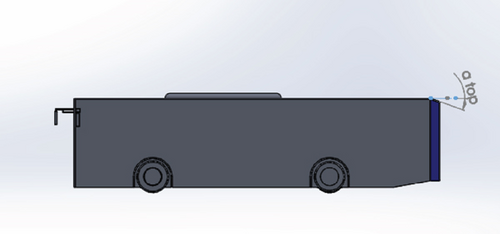
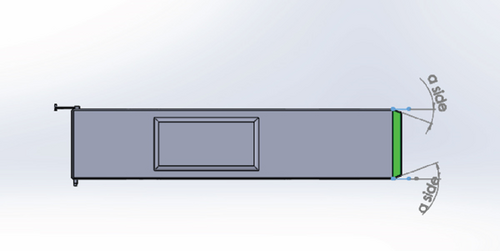
In addition, the optimum angle of the tapered cavity differs from model to model, and studies suggest that the tapered base cavity has more drag reduction capacity when compared to the straight base cavities. Urquhart et al. [19] studied drag reduction of a square back vehicle model by employing the base cavity. The acquired result indicates that the base cavity with a 0° diffuser and 14° side and roof tapering produced a higher value of 0.051. Abikan et al. [23] investigated the impact of the tapered and straight cavities on the bluff bodies. The authors stated that 41% drag reduction is achieved at a 9° base cavity angle. Koppa Shivanna et al. [16] studied the alteration of the rearward cavity on a square-back Ahmed body’s drag and flow zone structure. The study reveals that the tapered cavity at 6°, having an almost flawlessly symmetrical wake, led to a notable 22.55% drag reduction. So the previous studies show different optimum base cavity angles from 6° to 14° for the models that have different designs. Therefore, in this study, the angles of the base cavity 5°, 12°, and 20° were studied to analyze the implications of the base cavity angle on the overall minimization of the drag of the Bishoftu bus. These angles were studied by considering the minimum and maximum optimum base cavity angles for other vehicle models. Also, their impact on the structure of the wake and base pressure distribution was studied in CFD. A parametric investigation was conducted to determine the optimal base cavity angle “α,” taking into account minimum angles of 5° and higher angles of 20°. Figures 2 and 3 show the base cavity angle representations on the roof end and sides of the modified models at the base.
Brown et al. [24] demonstrated that as the base cavity wall thickness increases, the configuration tends to the reference base model with the same allied flow field, and they recommend the minimum base cavity thickness. Varney [25] recommends the minimum base cavity thickness of 0.01H nondimensionalized cavity wall thickness as vehicle height. Therefore, in this study, this base cavity thickness was adopted that was suitable to taste more angles of the base cavity. Table 1 shows the baseline bus model with different base cavity dimensions.
| Models | Base cavity angle (°) | Base cavity length |
|---|---|---|
| M1 | 5 | 0.1H |
| M2 | 5 | 0.2H |
| M3 | 5 | 0.3H |
| M4 | 12 | 0.1H |
| M5 | 12 | 0.2H |
| M6 | 12 | 0.3H |
| M7 | 20 | 0.1H |
| M8 | 20 | 0.2H |
| M9 | 20 | 0.3H |
The other method employed in this study for improving aerodynamic performance was varying the windshield angle. This is to lessen the pressure drag caused by the stagnation on the bus’s frontal body. Bayındırlı and Çelik [18] investigated the impact of changes in windshield angle in conjunction with a bus’s coefficient of drag. The authors noted that modifying the windscreen angle can reduce the coefficient of drag. The optimum windshield angles for the various vehicle models are different, and the optimum angle of specific vehicles needs to be investigated [26–28]. The existing doorway location of the Bishoftu bus does not allow a windshield angle variation of more than 17° because it hurts the design [29]. Also, the higher windshield angle causes visibility degradation due to the veiling glare caused by the reflection of the sun-illuminated windshield, reducing drive visibility distance and internal occupant spaces [30]. Therefore, in this study, the maximum baseline model windshield angle variation of 17° and windshield angle of 9° that was at the middle of the windshield angle of the bus (0°) and the maximum windshield angle of 17° were studied. Table 2 shows the dimensions of the models modified with windshield angle only. Figures 4 and 5 show modified Models 10 and 11, respectively.
| Models | Windshield angle (°) | Base cavity angle (°) | Base cavity length |
|---|---|---|---|
| M10 | 9 | — | — |
| M11 | 17 | — | — |
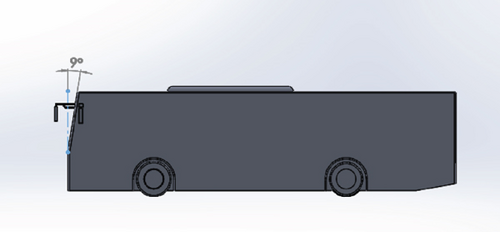
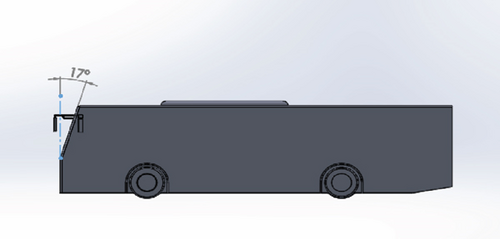
The windshield angles and base cavity dimensions of modified models that have both modifications are shown in Table 3.
| Models | Windshield angle (°) | Base cavity angle(°) | Base cavity length |
|---|---|---|---|
| M12 | 9 | 5 | 0.1H |
| M13 | 9 | 5 | 0.2H |
| M14 | 9 | 5 | 0.3H |
| M15 | 9 | 12 | 0.1H |
| M16 | 9 | 12 | 0.2H |
| M17 | 9 | 12 | 0.3H |
| M18 | 9 | 20 | 0.1H |
| M19 | 9 | 20 | 0.2H |
| M20 | 9 | 20 | 0.3H |
| M21 | 17 | 5 | 0.1H |
| M22 | 17 | 5 | 0.2H |
| M23 | 17 | 5 | 0.3H |
| M24 | 17 | 12 | 0.1H |
| M25 | 17 | 12 | 0.2H |
| M26 | 17 | 12 | 0.3H |
| M27 | 17 | 20 | 0.1H |
| M28 | 17 | 20 | 0.2H |
| M29 | 17 | 20 | 0.3H |
2.2. Numerical Setup
The numerical simulation in this study was performed via the commercial tool ANSYS 19.2 software. The finite volume approach is the basis of the program’s numerical formulation. The Navier–Stokes equations, which are conservation equations, are the fundamental equations in fluid mechanics. These are the laws for the mass and momentum equation. The solver computes the velocity and the acceleration using these equations. The pattern of pressure distribution is used to compute the drag and lift forces. The simulation using CFD has three general phases. The first is preprocessor stage where generating virtual wind tunnel, setting up boundary conditions, and mesh generation is completed. The second phase is solver stage in which solution, control, and initialization methods are implemented. Finally, the postprocessor stage that involves creating the velocity and pressure contours and vectors [31, 32].
2.2.1. Design of Virtual Wind Tunnel
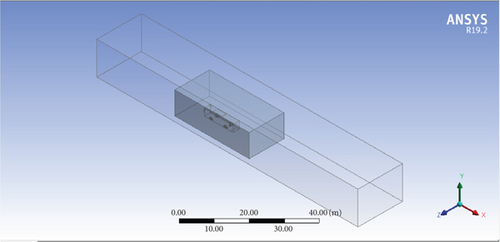
The size of a virtual wind tunnel in CFD can differ depending on the particular application and the level of detail required in the simulation. CFD allows for virtual wind tunnels to be created, which can be much larger or smaller than physical wind tunnels. The virtual wind tunnel’s dimensions must be sufficient to encompass all pertinent flow characteristics. The virtual wind tunnel has an upstream length of three times the bus length, a downstream length of five times the bus length, a width of three times the bus width on the side, and a height of three times the bus height on the top. An inner box can be employed to regulate the volume mesh adjacent to the bus. This box should be about a vehicle length in the wake and half a bus length in front, sides, and top. The body of influence’s small region around the bus body is drawn for its importance in capturing flow features around the bus body and getting good boundary conditions [31]. The enclosure and the inner box that were created for the baseline model analysis are illustrated in Figure 6.
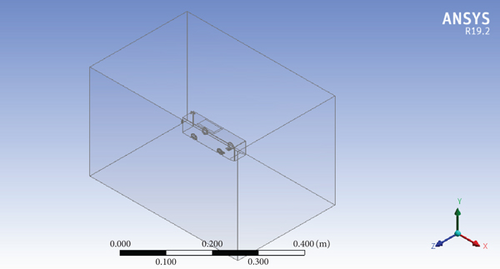
For the scaled model CFD analysis, the size of the enclosure used was identical to the dimensions of the measurement section of the wind tunnel available at the Jimma Institute of Technology. The measuring portion of the wind tunnel has a length of 450 mm and a cross-section area of 292 × 292 mm2 [33]. Figure 7 depicts the enclosure generated for the 1/60th scaled-down model of the baseline model.
2.2.2. Mesh Generation
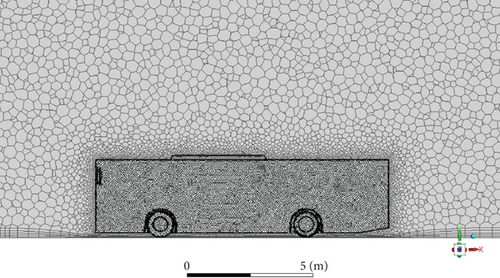
In the present investigation, polyhedral meshes were utilized to discretize the computational domain, which was initially tetrahedral and subsequently transformed to polyhedral to lower the cell count and hence the amount of time needed for computation. An irregular polyhedral grid produced plausible outcomes for a ground vehicle outside fluid flows as well [34]. The mesh refinement was employed in the current investigation to regulate the number of elements located inside the control zone. The goal was to improve calculation correctness (and thus element density) in areas where fluid flow comes into contact with significant bus body faces. The method chosen for mesh refinement in this study to particularly manage mesh size was based on interior boxes formed surrounding the vehicle and in the wake area [35]. The box was created in the design module. The proximity and curvature advanced size function was used to progress from the smallest size elements close to and surrounding the bus’s curvature to enlarge the element’s size distant from the bus and approaching the walls. High smoothing was employed to increase the number of smoothing iterations while enhancing the quality of elements by relocating nodes and elements close to each other. The element edge length was grown by 12% in each consecutive layer of the mesh using the default growth rate of 1.2. The default curvature normal angle of 18 was used, as was the greatest angle that a single element could span, and the curvature minimum size was 6 mm. The defeature size was maintained at 3 mm. The parameters that included aspect ratio and skewness were checked to ensure the correctness of the created mesh. Figure 8 demonstrates the unstructured tetrahedral grid before it was converted to the polyhedral mesh.
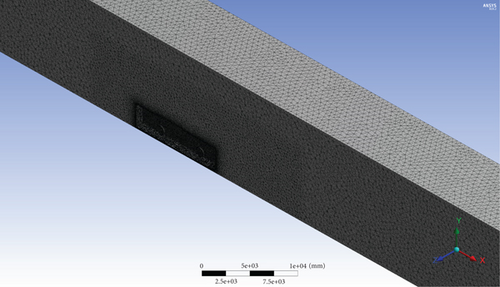
Figure 9 depicts the polyhedral mesh that resulted from the conversion of the tetrahedral mesh for the baseline model. The tetrahedral grid was transformed into a polyhedral grid to improve accuracy as well as minimize total cell count, which was intended to lower the total amount of time necessary for computation.
2.2.2.1. Mesh Independence Test
For CFD simulations to produce accurate and trustworthy results, meshing is essential. A grid neutrality test has been conducted to guarantee that the solution is grid independent. It is a technique for determining whether or not the findings of the simulation are independent of the underlying grid. Numerous grid independence investigations are carried out to minimize numerical difficulties like inaccurate outcomes and poor mesh quality. Verifying anticipated data estimations based on CFD has been one of the key concerns in choosing an advanced engineering strategy in recent years [34, 36]. The result check process via a grid-based independent study was crucial in giving satisfying results because one of the purposes of this study was to minimize the vortex creation on the bus’s zones of flow separation employing various drag reduction tactics. The final mesh for the study was identified through a mesh independence investigation based on the baseline model’s drag coefficient at the 60 km/h speed of the vehicle. Mesh independence test result is shown in Figure 10. The study considered seven mesh cases, with a total number of cells ranging from 500,000 to 2.3 million tetrahedral mesh.

2.2.3. Boundary Conditions
The boundary conditions are an especially significant component in the mathematical simulation of CFD-based studies. As a result, in CFD-based situations, boundary condition requirements are essential because reliable conditions can only deliver adequate outcomes. It was defined as inlet, outlet, wall, and bus, through the option of named selection. In this study, the analytical solver was pressure-based, with a constant time and absolute velocity formulation. The density of the air flowing over the bus was 1.225 kg/m3, and the viscosity was 1.7894 × 10⁻⁵ kg/(m · s). The pressure needed for the operation was set at 101,325 Pa, which is a typical static value acting upon the bus’s environment of operation (atmospheric pressure) [35]. The velocity inlet had values of 16.67, 22.23, and 27.67 m/s. The exit was a pressure outlet having a gauge pressure of 0 Pa. The bus and the wall were each regarded as fixed walls with no-slip features. The boundary settings of all applied conditions are tabulated as displayed in Table 4.
| Boundary | Boundary conditions | Value |
|---|---|---|
| Velocity inlet | Constant velocity | 60 km/h, 80 km/h, 100 km/h |
| Turbulent intensity | 5% | |
| Turbulent viscosity ratio | 10 | |
| Pressure outlet | Gauge pressure | 0 (pa) |
| Pressure profile multiplier | 1 | |
| Backflow direction specification method | Normal to boundary | |
| Turbulent intensity | 5% | |
| Turbulent viscosity ratio | 10 | |
| Wall zones | Wall motion | Stationary wall |
| Shear condition | No slip | |
| Roughness models | Standard | |
| Bus | No-slip stationary wall | |
| Fluid type | Air | |
| Density | ρ = 1.225 (kg/m3) | |
| Kinematic viscosity | v = 1.7894 × 10⁻⁵ (kg/(m·s) | |
2.2.4. Turbulence Model
The coupled scheme solution mechanism for pressure–velocity coupling that has a quicker time-to-solution and greater stability was used. The second-order upwind was used to quantify the pressure, momentum, turbulent kinetic energy, turbulent dissipation rate, and spatial discretization gradient because it yielded more precise outcomes than the first-order upwind [37]. Drag and lift monitors were built beneath the monitors. The solution was initiated using the standard initialization procedure. The standard initialization technique was utilized to begin the process of solving the problem. Levels of 1e−5 are regarded as well converged in CFD, while residual levels of 1e−4 are regarded to be somewhat converged [38]. To achieve an acceptable solution, in this study, the convergence criteria for residual of all the solving parameters were set to 10−5.
2.3. Experimental Validation of Numerical Analysis
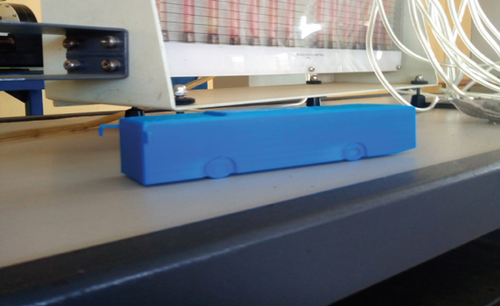
CFD is based on turbulence models and simplifications, which introduce uncertainty and are sensitive to operating conditions. Combining it with experimental validation enhances the accuracy and confidence in predictions. Experimental validation is critical because it ensures that the numerical model’s predictions reflect actual physical behavior [39]. In a wind tunnel, the numerical analysis of the baseline model result was validated experimentally. This validation was carried out using an actual test on the baseline model’s scaled 3D model. A comparison of aerodynamic drag coefficients was performed to determine the accuracy of the CFD model for the scaled baseline bus at the same wind speeds and yaw angle of 0° to ensure consistency between simulations and experiments. The study establishes validity by contrasting numerical CFD findings with experimental outcomes. The printed 3D model of the Bishoftu bus is shown in Figure 11.
2.3.1. Experimental Setup
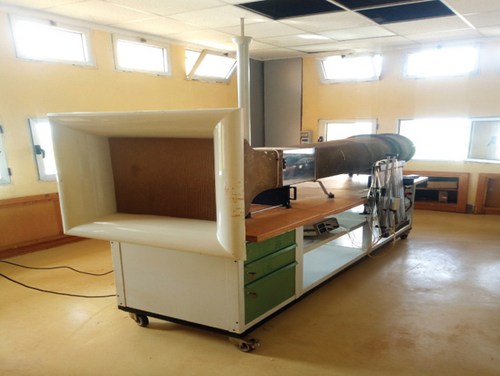
The experimental test on the 3D-printed scaled baseline bus was carried out in the Jimma Institute of Technology’s HM 170 wind tunnel, an open, subsonic wind tunnel having a rectangular measurement section profile. These experiments’ main objective was to assess the aerodynamic forces on a Bishoftu bus model based on CFD. The wind tunnel is divided into three sections: the power section, which sets up an external blower for the tunnel’s air supply; the test section, which contains some equipment; and the diffuser, which uses an aluminum honeycomb to provide steady airflow. The test section’s air velocity is established using Bernoulli’s principle [33]. So in this study, the aerodynamic force on the bus was determined by mounting the vehicle 3D print on the force balance of the wind tunnel. Since increasing the Reynolds number in the wind tunnel is expensive and not possible in low-scale wind tunnels, the Reynolds number independence approach was followed for the scaled model test in this research. The wind tunnel that was used to analyze the scaled baseline model is depicted in Figure 12.
2.4. Multiobjective Optimization Using RSM in Design-Expert Software
RSM is a set of mathematical and statistical mechanisms for modeling and analyzing issues involving multiple factors. It is commonly used in areas such as the formulation and product development, as well as improving existing designs [40]. The RSM desirability function (RSM/DFA)–based design of experiment (DOE) method was used in this study to optimize the base cavity dimensions and windshield angle. As input parameters, the three significant variables windshield angle, vehicle speeds, and base cavity depth and angle were chosen. During each experimental run, the output responses such as the coefficient of drag and lift, drag force, lift force, fuel consumption, and CO2 emission were measured. To ensure all possible component and factor combinations, the defined design was selected with a prespecified list that was imported to the DOE after the CFD results and other analyses were conducted. The design model was quadratic and had 90 runs. Table 5 displays the maximum and minimum values of the input factors and responses.
| Factors | Min. | Max. | Responses | Min. | Max. |
|---|---|---|---|---|---|
| Speed (A) | 60 | 100.00 | Cd (R1) | 0.4763 | 0.6397 |
| Windshield angle (B) | 0 | 17.00 | Cl (R2) | −0.3308 | −0.0785 |
| Base cavity angle (C) | 0 | 20.00 | Drag force (R3) | 772.32 | 2902.97 |
| Base cavity length (D) | 0 | 0.99 | Lift force (R4) | −1477 | −128.437 |
| Fuel saved (R5) | 0 | 6.35 | |||
| CO2 saved annually (R6) | 0 | 83.97 | |||
Furthermore, the constructed quadratic models were statistically verified using an analysis of variance (ANOVA). It has been seen that in the ANOVA analysis for responses, that is, coefficient of drag, lift coefficient, drag force, lift force, fuel saved, and annually eliminated CO2 emissions, the p-values are less than 0.0001. That suggests the model is statistically significant, which indicates the observed results are highly unlikely to occur by chance under the assumption of no significant relationship. Also, residual versus predicted plots of responses were plotted to assess the viability of the model. The assessment illustrates that there are no distinct trends observed in the residuals as the predicted value varies. This indicates that the models are not consistently underestimating or overestimating the response variable across different ranges of predicted values.
The DFA approach of RSM was employed to optimize the multiresponse. Every anticipated output response was converted into a dimensionless value known as desirability (di) for optimization analysis. These desirability ratings were then utilized to calculate the global desirability function (D) using Design-Expert software Version 13. The largest value of D, which is believed to be the optimum result, implies the best function value of the system’s variables (the input parameters) correlating to the most desirable value of the outcomes. As a result, it is feasible to discover the most suitable set of input parameters for which the highest desired outcome values should be obtained through multiobjective optimization based on a range of outcomes.
3. Results
3.1. Baseline Model Results
The drag forces and drag coefficients (Cd) values of the baseline models at a variety of speeds are summarized in Table 6. The Cd and Fd values were presented as the pressure and viscous components; also, the net values are described. The drag force due to the pressure is 1023.72 N, and the drag force due to friction is 22.69 N at 60 km/h as observed from the CFD result. The net Cd value at this velocity was 0.6397, where the pressure component is 0.6258 and the viscous component is 0.01387.
| Speed (km/h) | Drag force (pressure) | Drag force (viscous) | Net | (pressure) | (viscous) | Net |
|---|---|---|---|---|---|---|
| 60 | 1023.72 | 22.69 | 1046.42 | 0.6258 | 0.0138 | 0.6397 |
| 80 | 1819.64 | 39.13 | 1858.78 | 0.6257 | 0.0134 | 0.6391 |
| 100 | 2843.22 | 59.74 | 2902.96 | 0.6257 | 0.0131 | 0.6388 |
At the 80 km/h vehicle speed, both drag due to pressure and viscous are increased. The result shows 1819.64 N due to pressure and 39.13 N due to viscosity. So the overall drag force at this speed becomes 1858.78 N. The net Cd value at this velocity (80 km/h) was 0.6391, where the pressure component is 0.6257 and the viscous component is 0.01345. The drag force reaches 2902.96 N at 100 km/h, where the drag force due to pressure further reaches 2843.22 N and the drag force due to friction becomes 59.74 N. The net Cd value at this velocity was 0.6388, where the pressure component is 0.6257 and the viscous component is 0.01314.
The finding indicates that as the speed of the vehicle increases, the drag force of the baseline model increases. That means the bus experiences higher drag at higher speeds. The overall drag force and drag coefficients are dominated by their pressure components. The amounts of the viscous components to the net Fd and Cd are less compared to the pressure component. The result also reveals the behavior of the Cd of the Bishoftu bus with its speed. So it is seen that the Cd remains relatively constant.
The summary of lift force and lift coefficient values of the baseline model is shown in Table 7. The net lift forces at 60, 80, and 100 km/h are −417.80, −753.61, and −1189.24 N, respectively, where the lift forces due to pressure were −415.24, −749.13, and −1182.30 N. The lift forces due to the viscous are −2.55, −4.47, and −6.94, respectively, with the vehicle speed used in the analysis. The net lift coefficients are −0.2554, −0.2591, and −0.2617 at 60, 80, and 100 km/h, respectively. The lift coefficients due to viscosity are −0.00156, −0.00154, and −0.00152 with corresponding speeds. Pressure-related lift coefficients for studied vehicle speeds are −0.2538, −0.2576, and −0.2602, respectively. The lift coefficient due to viscosity shows a slight increase, and due to pressure, it decreases. The finding reveals that as the vehicle’s speed rises, the lift force declines. This indicates that with the increase in the vehicle speed, a favorable downward force can be achieved. The pressure components of Fl and Cl participation to the overall values of Fl and Cl are greater.
| Speed (km/h) | Lift force (pressure) | Lift force (viscous) | Net | (pressure) | (viscous) | Net |
|---|---|---|---|---|---|---|
| 60 | −415.24 | −2.55 | −417.80 | −0.2538 | −0.00156 | −0.2554 |
| 80 | −749.13 | −4.47 | −753.61 | −0.2576 | −0.00154 | −0.2591 |
| 100 | −1182.30 | −6.94 | −1189.24 | −0.2602 | −0.00152 | −0.2617 |
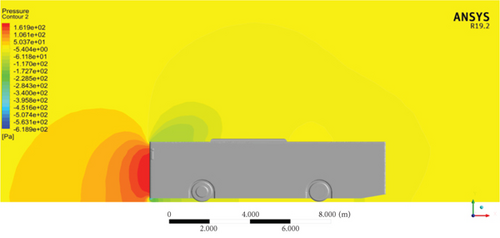
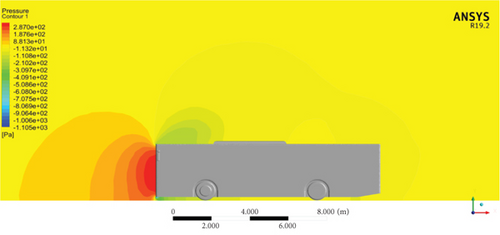
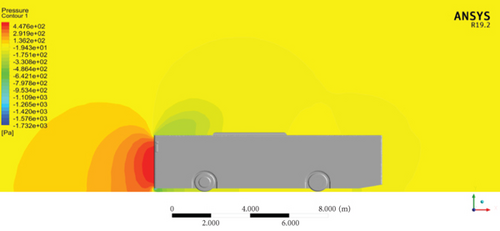
Figure 13 exhibits the distribution of pressure contours on the exterior of the bus model on the symmetry plane. The result reveals that the highest pressure happened on the forehead area of the Bishoftu bus, and alongside the rise in vehicle speed, the higher pressure increased. This implies that to achieve reduced aerodynamic drag, the reduction of the pressure at the frontal part of the model and the maximization of the pressure distribution at the back of the bus were needed.
The velocity contour plots of the baseline model at 60, 80, and 100 km/h are presented in Figure 14. The velocity contour of the vehicle at various speeds depicts the distribution of velocities across the vehicle’s surface. The result shows that large recirculation zones at the base of the reference model are observed at varying vehicle speeds. Maximum velocities observed are 27.99 m/s at 60 km/h, 37.28 m/s at 80 km/h, and 46.5 m/s at 100 km/h. These maximum velocities are visible on the frontal top edge and bottom edge of the baseline model, where the flow is split. In the velocity contour plots, it appears as a yellow region.
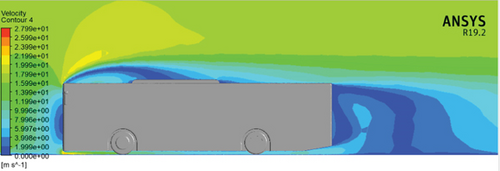
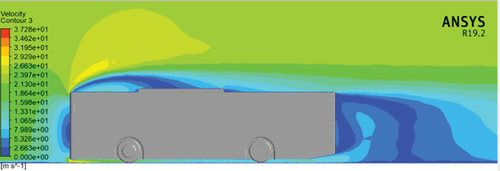
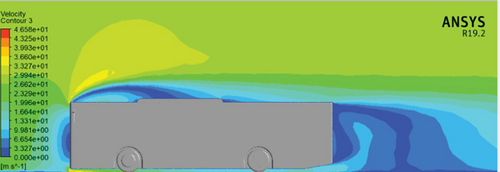
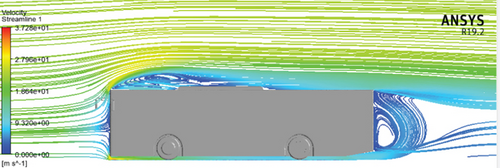
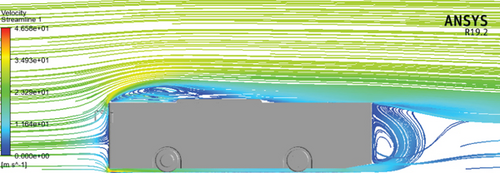
Figure 15 depicts a streamlined plot of the baseline configuration at the symmetry plane at vehicle speeds of 60, 80, and 100 km/h. The maximum separation of flows was seen at the back and top of the baseline configuration front, resulting in a maximum turbulence and then a maximum drag force. The flow that had separated at the frontal edges of the bus was seen reattached to the bus’s Ac unit surface.

3.2. Experimental Validation of the Baseline Model
- •
Δv represents the velocity irregularity (Δv) of the wind tunnel, and Δ(v2) = v2 × (2Δv/v).
- •
ΔFd represents the uncertainty in the quantity Fd.
- •
ΔCd represents the propagated error of the drag coefficient.
The uncertainty of each drag coefficient value was expressed as a percentage, ranging from ±0.76% to ±6.17%. These percentages represent the range of the potential variation in the drag coefficient values due to uncertainties associated with the measurements. This means that the average drag coefficient was estimated to be 0.6093, and the uncertainty associated with this value was ±2.396. Drag coefficient (Cd) values at multiple velocities with propagated error are tabulated in Table 8.
| Velocity (±2%) | Average drag force (±0.005) | ± propagated error (ΔCd) |
|---|---|---|
| 11.2 | 0.086 | 0.6218 ± 6.17% |
| 13.3 | 0.12 | 0.6153 ± 4.46% |
| 15.5 | 0.162 | 0.6116 ± 3.34% |
| 18.5 | 0.23 | 0.6095 ± 1.45% |
| 21.5 | 0.308 | 0.6043 ± 1.09% |
| 22.5 | 0.338 | 0.6055 ± 1.00% |
| 23.57 | 0.37 | 0.6040 ± 0.89% |
| 26 | 0.4488 | 0.6021 ± 0.76% |
| Average | 0.6093 ± 2.39% |
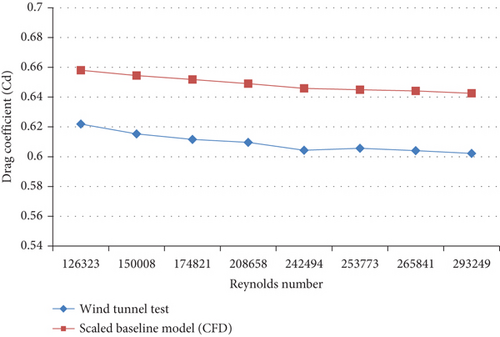
Table 9 illustrates the experimentally and numerically determined Cd values for a scaled reference bus model. The average difference percentage of 6.09% was seen between the CFD outcomes and the experimental outcomes through studied speeds. The percentage of error falls an acceptable percentage because the error rates in engineering computations can be lower than or equal to 10% [42].
| Speed (m/s) | Scaled baseline model (CFD) | Wind tunnel test | Percentage of difference |
|---|---|---|---|
| 11.2 | 0.658 | 0.6218 | 5.49% |
| 13.3 | 0.6545 | 0.6153 | 5.98% |
| 15.5 | 0.6518 | 0.6116 | 6.16% |
| 18.5 | 0.6490 | 0.6095 | 6.07% |
| 21.5 | 0.6458 | 0.6043 | 6.41% |
| 22.5 | 0.6450 | 0.6055 | 6.11% |
| 23.57 | 0.6442 | 0.6040 | 6.22% |
| 26 | 0.6425 | 0.6021 | 6.27% |
| Average | 6.09% | ||
The variations of the findings may be related to the assumptions related to the CFD calculations and wind tunnel tests. Wind tunnel test results can be influenced by aspects like surface roughness, boundary conditions, and the accuracy of measuring instruments. The turbulence models and computational approaches used in CFD simulations may also introduce uncertainty into the results [43, 44].
Figure 16 shows the Reynolds independence test result. The plot shows that the data points are dispersed with no obvious trend or structure. From the Cd values of the CFD and wind tunnel, it is possible to deduce that there is no apparent systematic association between the Reynolds number and the values. The evidence confirms the Reynolds independence idea.
3.3. Effect of Base Cavity
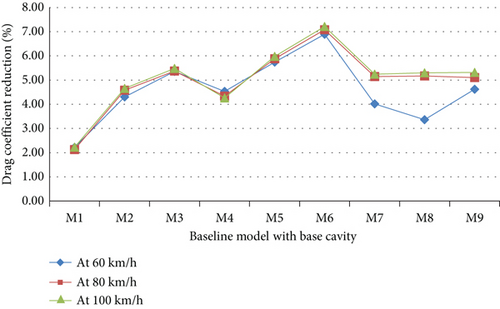
Figure 17 shows the percentage of drag coefficients of models that were modified with a variety of base cavity dimensions relative to the baseline model. The finding shows that the highest percentage of coefficient of a drag reduction of 7.21% was accomplished with Model 6 at 100 km/h. Model 6 has a 12° base cavity angle and 0.3H tapered base cavity depth, where the percentages of the Cd reductions are 6.89% and 7.08% at 60 and 80 km/h for the model. The average Cd reduction percentage through all speeds for Model 6 was 7.06% which was the highest reduction compared to other modified models by the base cavity. The reduction points out the importance of the base cavity configurations in reducing Cd and improving the aerodynamic performance of the Bishoftu bus.
3.3.1. Base Cavity Effect on Wake
Figures 18, 19, and 20 show the influence of the base cavity angle and base cavity length on the wake of the bus at 80 km/h. The velocity vector was plotted on the XY plane at Z = 1.25 to investigate the features of the wake of models modified with the base cavity. The results reveal that at 5° and 12°, the wake flow was seen as directed upward which means its upward dominated wake. The given result indicates the behavior of wake patterns at different base cavity angles in a specific configuration. While at 20° base cavity angle, the upward washed wake is shown only at the shorter tapered base cavity length (0.1H). However, at 0.2H and 0.3H tapered base cavity length, downwash dominant wake was seen. The result shows the wake size was reduced with all base cavity configurations, while at the 20° base cavity angle, the flow starts to detach from the surface of the base cavity earlier compared to the base cavity angle of 5° and 12°. The presence of a downwash-dominant wake at the larger base cavity angle suggests an increased downward flow behind the vehicle. This can contribute to a rise in the total drag coefficient.


3.3.2. Base Cavity Effect on Base Pressure Distribution
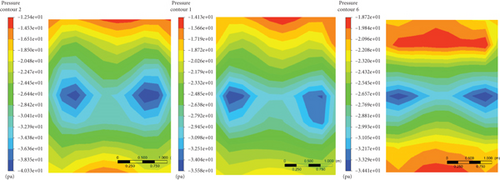
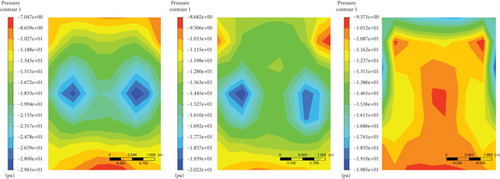
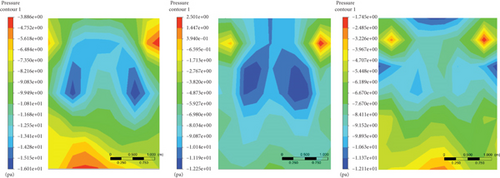
Figures 21, 22, and 23 demonstrate the pressure contour on the YZ plane at the base for the reference configuration modified with base cavity modifications at 80 km/h. From the result, it has been observed that the maximum base pressure distribution was increased as the base cavity length became large. However, the wide maximum base pressure area was observed at the 12° base cavity angle and 0.3H base cavity length. The low-pressure areas for the modified models were observed; thus, their area has been decreased with base cavity configurations and almost diminished for the modified model which has a 12° base cavity angle and 0.3H base cavity length.
3.4. Windshield Angle Effect
Figure 24 illustrates the pressure contours and velocity contours of the baseline model and two models that were modified with a windshield angle. The result illustrates the pressure and velocity distributions of the baseline model, the baseline model modified with 9° and 17° windshield angles. From the results, it is understood that the stagnation pressure reduction at 17° was higher in comparison to the reference bus configuration and modified model which has a 9° windshield angle. The stagnation pressure for the baseline model, a model with 9° and 17° windshield angle, was 161.9, 158.5, and 152.8 Pa, respectively. That indicates the lowest resistance to the bus model’s forward motion and results in the lower aerodynamic drag. The windshield angle variations cause the flow at the front of the bus smoother and streamlined.
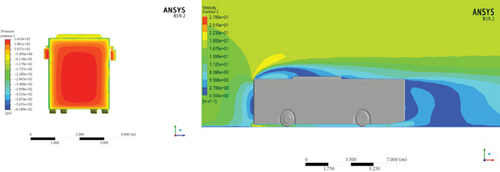

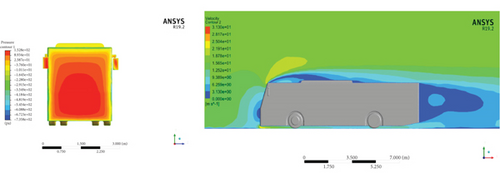
The velocity contours were used to visualize the recirculation zone. The minimum recirculation zone was observed for the model which has a windshield angle of 17°. Also, it has been observed that the low-velocity zone at the front of the modified model which has a 17° windshield angle is the lowest compared to the other models. This low-velocity region shown as blue at the frontal surface of the models is where the airflow comes in contact with the vehicle surface and stalls. The smaller the recirculation zone, the less turbulence created, and thus the lower the drag.
The Cd value for the two models shows a reduction at all speeds in contrast to the baseline model. The average Cd reduction percentages for both models (M10 and M11) are 10.21% and 17.12%, respectively. In addition, the modified models achieve the lowest coefficient of lift and lift force compared to the baseline bus. That indicates more downward force. Also, the average reductions in drag force for both models are 9.87% and 18.62%, respectively.
3.5. Combined Effect of Base Cavity and Windshield Angle Modifications on Bus Aerodynamics
The amount of the Cd reduction percentage for all 18 models modified with both windshield angle base cavities was presented in Figure 25. From the 18 models, Model 26 achieves the highest drag coefficient reduction through all analyzed speeds. These Cd reduction percentages achieved with this model were 24.8%, 25.4%, and 25.3% at speeds of 60, 80, and 100 km/h, respectively. Averagely, it was a 25.2% reduction of drag coefficient. Thus, the applications of the windshield angle and base cavity modifications are effective in the enhancement of the aerodynamic efficiency of the baseline bus model.

Figure 26 presents the pressure distributions on the modified Model 26 which achieves the minimum drag force out of all modified models. The maximum pressures of this Model 26 increase with the vehicle speed. At 60 km/h, the maximum pressure is 151.9 Pa; at 80 km/h, it is 269.3 Pa; and at 100 km/h, it reaches 419.8 Pa. The result reveals that the highest pressure area on the leading end of this modified vehicle model was reduced when contrasted with the baseline bus. The result illustrates that the minimum stagnation pressure area has been observed at the front of the modified bus which results in the minimized aerodynamic drag.
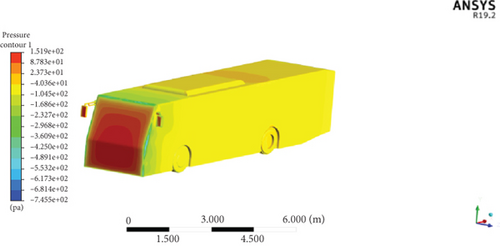
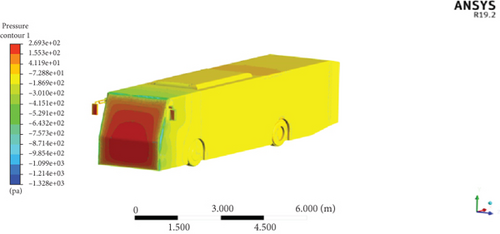
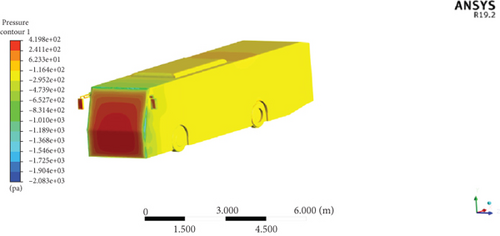
Figure 27 illustrates the velocity contour plot of Model 26 at studied vehicle speeds. The velocity contour of the vehicle at different speeds shows the distribution of velocities across the vehicle’s surface. The maximum velocities observed are 32.26 m/s at 60 km/h, 43.03 m/s at 80 km/h, and 53.91 m/s at 100 km/h. These maximum velocities are seen on the frontal top edge of the modified model at which the flow is separated. It is shown as a yellow region in the velocity contour plots. It has been seen that the recirculation zone at the rear of the reference bus was reduced with the modified model. The recirculation zone of the modified model is much minimum than that of the baseline model at all speeds.
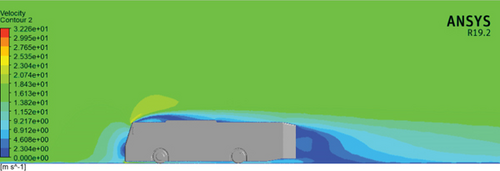
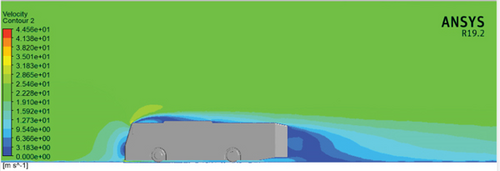
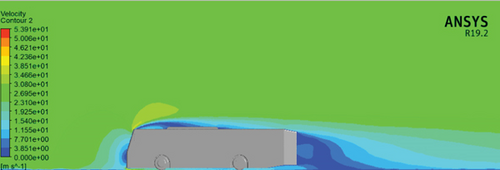
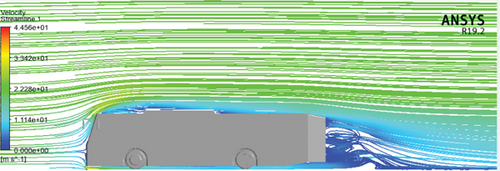
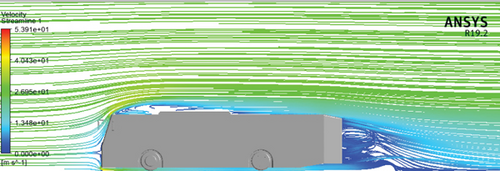
Figure 28 shows a streamlined plot of the modified Model 26 at the symmetry plane at 60, 80, and 100 km/h vehicle speeds. When compared to the baseline bus model, less flow separation was found at the back and top of the modified model front, resulting in minimal turbulence and, as a result, a maximum drag force reduction.

3.6. Fuel Consumption Saved
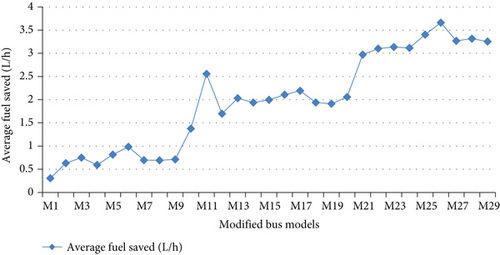
Figure 29 shows the average fuel saved (L/h) of all modified models relative to the baseline Bishoftu bus through all analyzed speeds. The highest average fuel consumption saved was achieved with Model 26 which has the lowest drag force among all modified models. The maximum average fuel consumption saved was 3.66 L/h.
3.7. Amount of CO₂ Saved
- •
mf stands for the amount of fossil fuel burned or activity level of fuel consumption.
- •
mCO2 for carbon content is 0.77 tons/m3 or 0.77 kg/L.
- •
The fossil fuel oxidation factor (OF) is 1 for complete combustion.
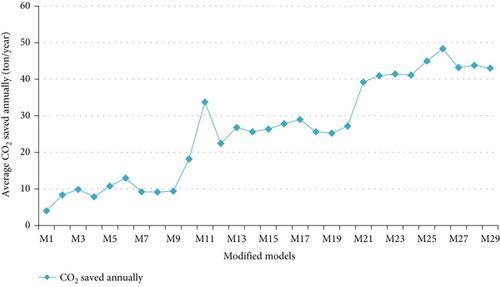
Figure 30 shows the average CO2 saved annually of all modified models relative to the baseline bus through all analyzed speeds. The overall impact of the base cavity and windshield angle variation on the environment can be seen. The amount of CO2 saved was calculated by considering the operating hours per day of the Bishoftu bus which is 13 h and the yearly operation of this bus which is 360 days per year [47]. The highest average CO2 saved annually was achieved with Model 26 which has the lowest drag force among all modified models. This model has 48.35 tonnes/year of CO2 saved annually which alters the release of such a huge amount of emission per year.
3.8. Effect of Interaction of Factors on Responses
3.8.1. Effect of Factor Interaction on Drag Coefficient (Cd)
Figure 31 illustrates the combined effect of vehicle speed and windshield angle on the coefficient of drag (Cd). The result was presented by a contour plot 3D surface graph by keeping other factors at intermediate values. It has been noticed that the minimum Cd value was achieved at a higher windshield angle and higher speed of the bus. Comparably, the impact of the windshield angle variation on the reduction of Cd was incredible, while the Cd value reduction with the speed of the bus was nearly negligible. The minimum Cd value of 0.4763 was observed at 100 km/h and a windshield angle of 17°.
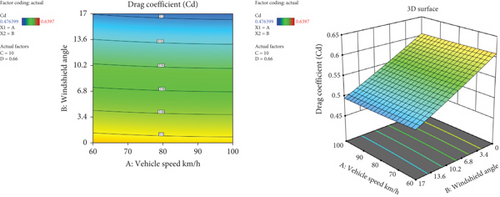
Figure 32 shows the contour and 3D graph of the combined effect of windshield angle and base cavity angle on the coefficient of drag. The result demonstrates that the least drag coefficient was achieved at a higher windshield angle of 17° and the highest base cavity length of 0.3 of vehicle height (0.3H). While the drag coefficient minimization was achieved by an increment of base cavity length, the Cd value was highly reduced by the increment of windshield angle. That described the tendency of the modifying windshield angle to reduce the drag coefficient by minimizing stagnation pressure at the front end of the Bishoftu bus. Similarly, it shows the effect of base cavity length at the back of the bus for the extra lessening of Cd.
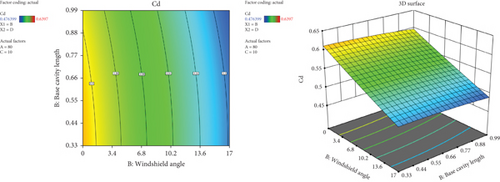
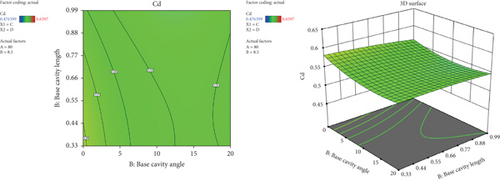
Figure 33 demonstrates the interaction between the base cavity length and base cavity angle coefficient of drag. The result has shown that the lengthening of the base cavity leads the drag coefficient to be reduced. That indicates the longer base cavity effect on increasing the base pressure in other ways. Also, with the increase of base cavity angle, the Cd value decreases, and it is important to note that after 12° base cavity angle, the Cd value starts increasing by a small amount. This shows the adverse influence of increasing the base cavity angle beyond the optimum. In general minimum, Cd value was achieved at the higher base cavity length (0.3H) and 12° base cavity angle.
3.8.2. Effect of Factor Interaction on Lift Coefficient (Cl)
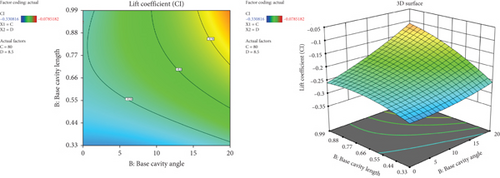
Figure 34 illuminates the combined effect of the vehicle’s base cavity angle and windshield angle on the coefficient of lift. It has been understood that at a higher windshield angle and lower base cavity angle, the lift coefficient was minimum. Higher base cavity angles are responsible for the increase of lift coefficient, while windshield angle increment has a positive impact by reducing the lift coefficient value.
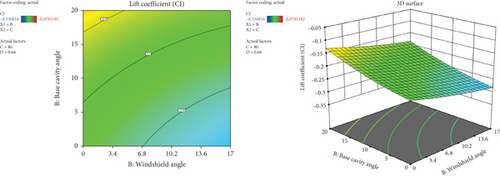
Figure 35 presents the impact of the base cavity angle and base cavity length on the lift coefficient. It has been seen that with an increase in both the base cavity angle and base cavity length, the lift coefficient shows a notable increase. At a higher 20° base cavity angle and 0.3H base cavity length, the lift coefficient reaches maximum.
3.8.3. Effect of Factor Interaction on Drag Force (Fd)
Figure 36 presents the combination effect of vehicle speed and windshield angle on drag force. The contour and 3D surface graph reveal that at higher windshield angles and lower vehicle speed, the drag force was minimal. It was extremely affected by vehicle speed as it increased with the rise of the speed of the vehicle. However, the drag force was minimized with the increase of windshield angle which has an optimistic result on vehicle aerodynamic performance. In general, it shows the aerodynamic importance of higher windshield angles and the impact of vehicle speed variations.
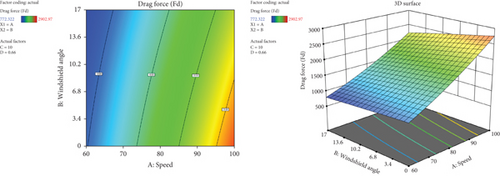
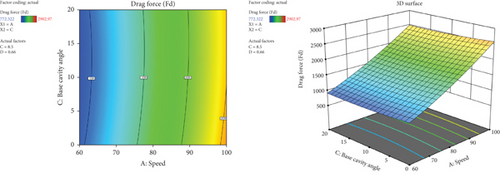
Figure 37 presents the combined effect of vehicle speed and base cavity angle on the drag force. The contour and 3D surface graph reveal as vehicle speed increases the drag force increases. With the increase of the base cavity angle, the drag force was minimized, while the minimum drag force value was achieved at 12° of the studied base cavity angles and lower vehicle speed.
3.8.4. Effect of Factor Interaction on Lift Force (Fl)
Figure 38 presents the interaction effect of windshield angle and base cavity angle on the lift force. It has been observed that the lift force was highly affected by the base cavity angle. As the base cavity angle increases, the lift force also increases, while with the increase of windshield angle, the lift force decreases. Minimum Fl was achieved at the combination of a higher windshield angle (17°) and the lowest base cavity angle.
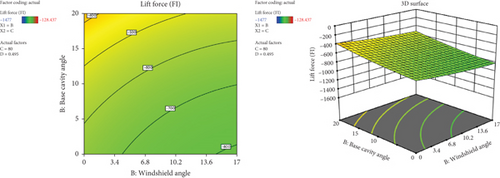
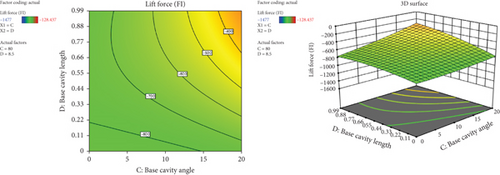
Figure 39 presents the interaction effect of base cavity angle and base cavity length on the lift force. The contour and 3D surface graph reveal as both the base cavity angle and base cavity length increase the lift force increases. This indicates the reduction of downward force that affects negatively the bus stability or ground gripping intensity. The lowest downward force was seen at a 20° base cavity angle and 0.3H base cavity length.
3.8.5. Effect of Factor Interaction on the Amount of Fuel Saved
The effect of windshield angle and base cavity angle on the amount of fuel saved is shown in Figure 40. It has been observed that the highest amount of fuel saved was observed at the combination of the higher windshield angle (17°) and the base cavity angle (12°). The amount of fuel saved was highly impacted by the windshield angle variations. The fuel saved increases with the windshield angle increment and vice versa.
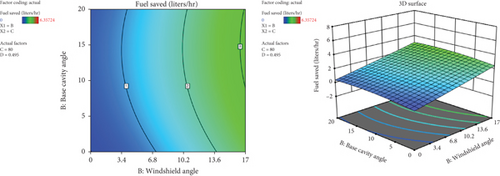
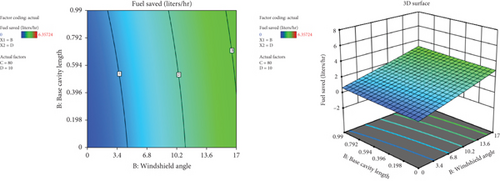
Figure 41 illuminates the interaction impact of windshield angle and base cavity length on the amount of fuel saved. The result reveals as both windshield angle and base cavity length increase, the amount of fuel saved has also been increased. It has been seen that the amount of fuel saved was highly affected by the windshield angle. The highest amount of fuel saved was achieved at the 17° windshield angle and 0.3H tapered base cavity length.
3.8.6. Impact of Factor Interaction on CO2 Saved
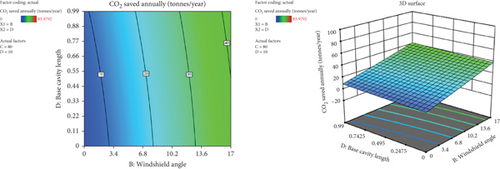
The effect of windshield angle and base cavity angle on the amount of CO2 saved is shown in Figure 42. It has been observed that the highest amount of CO2 was saved at the combination of the higher windshield angle (17°) and the base cavity angle (12°). The amount of CO2 was highly impacted by the windshield angle variations. The CO2 saved increases with the windshield angle increment and vice versa.
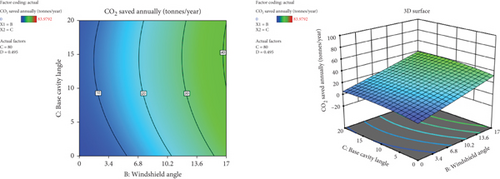
Figure 43 shows the interaction effect of windshield angle and base cavity length on CO2 saved. The result reveals as both windshield angle and base cavity length increase, the amount of CO2 saved has been also increased. The amount of CO2 saved was highly affected by the windshield angle variations. The peak amount of CO2 saved was attained at the 17° windshield angle and 0.3H tapered base cavity length.
3.9. Optimization of Parameters
The multiobjective optimization of the parameters was employed by using the numerical optimization. The optimization of the parameters was done by setting specific goals and constraints. The parameters that were optimized are B (windshield angle), C (Base cavity angle), and D (base cavity length). The goals of coefficient of drag, drag force, and lift forces were set to minimize. The goal of optimizing the fuel saved per hour and the CO2 saved annually was to maximize efficiency. Since the aim of the study was to reduce the aerodynamic drag, fuel consumption, and CO2 emission reduction, the weight given to them was 5 which highlights their high importance in the optimization process. The goals and constraints are shown in Table 10.
| Name | Goal | Lower limit | Upper limit | Importance |
|---|---|---|---|---|
| A: Speed | Is equal to 80 | 60 | 100 | 3 |
| B: Windshield angle | Is in range | 0 | 17 | 3 |
| C: Base cavity angle | Is in range | 0 | 20 | 3 |
| D: Base cavity length | Is in range | 0 | 0.99 | 3 |
| Cd | Minimize | 0.4763 | 0.6397 | 5 |
| Cl | Is in range | −0.3308 | −0.0785 | 1 |
| Drag force (Fd) | Minimize | 772.32 | 2902.97 | 5 |
| Lift force (Fl) | Minimize | −1477 | −128.43 | 1 |
| Fuel saved (L/h) | Maximize | 0 | 6.35 | 5 |
| CO2 saved annually | Maximize | 0 | 83.97 | 5 |
The goals and constraints were considered in the numerical optimization process to identify the parameter combinations that achieve the desired objectives. Thus, from the optimization, a total of 82 possible solutions were found. A solution with a higher desirability score of 0.62 was selected as the optimal combination. This solution was chosen because it displayed a significant degree of desirability, indicating that it effectively balanced the optimization problem’s specified goals and constraints. The selected solution parameter combinations are 11.54° base cavity angle, 17° windshield angle, and 0.99 m tapered base cavity length. The minimum drag force of 1385.75 N and the minimum lift force of −577.82 N were achieved at these optimized points. Also, the maximum fuel consumption saved per hour was 3.22 L and the maximum CO2 saved annually per tonne was 42.58 at this selected solution.
4. Conclusions
The objective of this study was to reduce the aerodynamic drag of the Bishoftu bus by employing windshield modifications and base cavity configurations. The reference bus and modified models were created in SOLIDWORKS and analyzed. The aerodynamic analysis was conducted using CFD at three different vehicle speeds. The baseline model has drag forces of 1046.42, 1858.78, and 2902.96 N at 60, 80, and 100 km/h, with Cd values of 0.6397, 0.6391, and 0.6388, respectively. The CFD results were validated by experimental tests on a 3D baseline prototype, which revealed an average Cd difference between CFD and wind tunnel results of 6.09%. Also, the comparison of the amount of fuel saved, CO2 saved, and money saved for all modified models relative to the baseline model was determined.
The finding shows the highest average percentage of the coefficient of drag reduction of 7.06% accomplished with only base cavity application on the baseline model for Model 6 (12° base cavity angle and 0.3H tapered base cavity depth) through all speeds at 100 km/h. The rise in the windshield angle reduces the stagnation pressure on the frontal area of the baseline bus. The average Cd reduction percentage for models modified with 9° and 17° windshield angles (M10 and M11) was 10.21% and 17.12%, respectively. Also, the drag force reduction averages for both models are 9.87% and 18.62%, respectively. These modified models achieved the lowest coefficient of lift and lift force compared to the baseline bus, which indicates more downward force.
In addition, the combined effect of the windshield angle variations and base cavity configurations was studied. The minimum average Cd and Fd values of 0.4779 and 1420.97 N were achieved, respectively, by Model 26, which has a 17° windshield angle, a 12° base cavity angle, and a 0.3H tapered base cavity length. Averagely, it was a 25.22% reduction in the coefficient of drag related to the baseline bus. The maximum average fuel consumption saved was 3.66 L/h, and the highest average CO2 saved annually was 48.35 tonnes/year that was achieved by Model 26. The highest cost of fuel that can be saved by this modified model was 1,307,675 Ethiopian birr, or 23,673 USD.
Furthermore, using the RSM, the individual effects and the combined impacts of a variety of factors on aerodynamic performance, CO2 reduction, and fuel consumption were analyzed. It has been revealed that the drag coefficient was moderately affected by vehicle speed and significantly minimized with an increase in windshield angle. Also, the Cd reduction was effective with base cavity variation up to 12°, with a minimum rise in Cd beyond that but a minimum compared to the baseline model drag coefficient. After conducting a multiobjective optimization, the best dimensions were found to be an 11.54° base cavity length, a 17° windshield angle, and a 0.3H tapered base cavity length. The maximum fuel consumption saved per hour was 3.22 L/h, and the maximum CO2 saved annually per tonne was 42.58 at this selected solution. It is concluded that the windshield angle modification and the base cavity configuration application contribute to the aerodynamic drag, fuel usage, and CO2 emission reductions. The aerodynamic drag reduction strategies and validation method in this study can be adapted to buses. However, due to design, size, and external feature variation of vehicles, the additional aerodynamic analysis is required. To draw a more generalized conclusion, future studies should examine additional bus designs.
Conflicts of Interest
The authors declare no conflicts of interest.
Author Contributions
Daniel Hailu Aseba: conceptualization, CFD simulation, experimentation, data analysis, results and discussions, and writing–original draft. Ramesh Babu Nallamothu, Abraha Kahsay: model preparation, experimentation, data analysis, results and discussions, writing–reviewing and editing.
Funding
No funding was received for this manuscript.
General Statement
Statement of Repository. This work is uploaded to a repository of Jimma University, Jimma, Ethiopia. https://repository.ju.edu.et//handle/123456789/9212.
Open Research
Data Availability Statement
The data that support the findings of this study are available from the corresponding author upon reasonable request.


