IoT-Enabled Machine Learning for Comprehensive Water Quality Assessment in the Mahanadi River: A Multibelt Analysis of Seasonal Contamination and Predictive Modeling
Abstract
The increase in water contamination in the Mahanadi River, exacerbated by industrial discharges, domestic effluents, and agricultural runoff, requires urgent and advanced water quality monitoring. This research integrates IoT-based monitoring systems with the powerful XGBoost machine learning model to address the limitations of traditional evaluation methods. The Mahanadi River, a vital resource amid rapid urbanization and industrialization, requires sustainable water quality management. Cutting-edge technology facilitates real-time data collection on pH, dissolved oxygen (DO), biochemical oxygen demand (BOD), chemical oxygen demand (COD), and total coliforms (TCs). The study delves into intricate relationships between variables, geographical regions, belts, and seasonal changes, providing a nuanced understanding of the dynamics of water pollution. Incorporating sophisticated data analysis and machine learning empowers precise predictions and comprehensive insights. A multibelt assessment across industrial, residential, and agricultural regions during various seasons offers a holistic perspective on water quality fluctuations. XGBoost demonstrates remarkable efficiency, achieving 95% accuracy in predicting water quality categories. Comparative evaluations highlight the superiority of the proposed method in seasonal patterns, the calculation of the water quality index (WQI), and belt-wise comparisons. This research is crucial in developing effective management strategies and sustaining conservation efforts for the Mahanadi River ecosystem. It serves as a valuable resource for policymakers, conservationists, and concerned residents, offering insight into the future of the river and contributing to the broader discourse on environmental preservation.
1. Introduction
Rivers serve as essential ecological support systems, sources of power, and convenient means for human transport and communication. They provide the raw materials and resources necessary to sustain human life. Furthermore, rivers are vital sources of life for numerous towns and villages across the country. With the growth of industrial zones and the expansion of cities, the Mahanadi River struggles to maintain clean water. Natural phenomena and human activities have exacerbated this situation, making it challenging for environmental workers to meet the increasing demands of a growing population [1]. This has led to numerous facets of water contamination. The intricate interactions among natural processes, industrial discharges, household effluents, and agricultural runoff contribute to this mosaic of problems [2]. Monitoring river water has become increasingly imperative to ensure environmental safety. The intricate interplay between pollutants evaluates the quality of the water. Traditional methods require a systematic and up-to-date grasp at all times. Accordingly, the dividing line between home and away can, in fact, connect when cutting-edge technology is used to bridge that divide. It is of utmost importance that we use up-to-date technologies to manage this indispensable resource on a sustainable basis. The river, often regarded as the life of the region, plays a crucial role in the lives and ecosystems of people living downstream. The Mahanadi River is rich in biological resources and supports vast fertile plains, which play a crucial role in the region’s agricultural productivity. These two factors are critical to the socioeconomic development of this region. The Mahanadi River is significant, but it faces increasingly severe problems, such as water pollution. Several factors contribute to the decline in water quality. These include industrial effluent, untreated wastewater from households, and agricultural runoff (which comes with pesticides and fertilizers), plus natural causes [3]. Deterioration threatened the ecological balance of the river and even threatened the peripheral people who depended on it. However, all these aspects of rapid urbanization and industrialization leave no room for delay. There is an urgent need for high-tech monitoring methods to ensure real-time data on critical water quality parameters. These parameters are essential indicators of overall water health. pH influences biological processes and determines the solubility of nutrients and heavy metals, affecting aquatic ecosystems [2]. Dissolved oxygen (DO) is crucial for sustaining aquatic life, while biochemical oxygen demand (BOD) and chemical oxygen demand (COD) quantify organic and inorganic pollutants, respectively [4]. Total coliforms (TCs) serve as microbial contamination indicators and are essential for assessing public health risks [3]. Monitoring these parameters enables early detection of pollution and aids in sustainable water management [5]. Good environmental, social, and economic health is inseparable from monitoring the Mahanadi River. The Mahanadi River is closely related to environmental, social, and economic health [6]. Clear water is maintained so there is enough supply for human beings without becoming toxic while containing diseases and preserving the richness of life. Furthermore, monitoring provides information on the impact of climate change, can serve as a basis for adaptation measures, and can reduce the effects on ecosystems [7]. This monitoring protects human health by certifying that potable water meets every applicable safety standard [8]. Monitoring of the Mahanadi River is crucial to sustainable development, habitat preservation, and the well-being of the region.
- I.
The main goal is to implement and integrate cutting-edge IoT technology to monitor pH, DO, BOD, COD, and TC in real time [9, 10].
- II.
The research is aimed at creating and deploying advanced predictive models on real-time data.
- III.
The comparative analysis of water quality throughout various seasons and geographical regions along the Mahanadi River constitutes.
- IV.
Calculating a comprehensive water quality index (WQI) for all seasons and regions.
- V.
Examine intricate connections between water quality measures, geographical regions, and seasonal fluctuations utilizing cutting-edge analytical methods.
We provide some fundamental ideas to understand and control the water quality of the Mahanadi River with our holistic methodology. With the help of IoT technology, data can be captured in real time. The frequency and granularity achieved by monitoring critical water parameters are higher than average. If we apply predictive modeling to this live dataset, our ability to forecast changes in water quality will be significantly improved. Furthermore, having this capability allows us to exercise some degree of control based on prediction and a high level of anticipation accuracy. Checking the WQI in various geographical regions and seasons also tells us much about their intricate interplay. WQI is a valuable method to ensure that water purity indicators can be united and standardized when comparing differences in water quality between different locations, seasons, or belts. This research combines these contributions to describe the dynamics of the water quality of the Mahanadi River.
Consequently, such work forms the basis for policymaking, environmental protection, and ecologically sustainable management. This research contributes to environmental science by providing helpful information to those working to conserve and restore the Mahanadi River ecosystem. Our research helps preserve and recover the Mahanadi River environment for humankind forever.
2. Related Work
Excessive consumption of land and sea resources, coupled with the intensifying effects of globalization, has contributed to a decrease in the purity of potable water. Additionally, the increase in population has placed significant pressure on the water systems that supply communities, further exacerbating the scarcity caused by the drying up of rivers due to the effects of global climate change. Immediate implementation of intelligent river water management systems is necessary to ensure robust surveillance of the quality and quantity of drinking water to address these urgent challenges. A water monitoring system has become essential to our daily lives, as it enables real-time control over water quality and facilitates prudent allocation of management resources in urban areas.
We performed an exhaustive analysis of the numerous systems that researchers developed to produce a model of superior quality. Although focusing on parameters including temperature, pH, conductivity, and others, many authors have proposed novel models for evaluating water quality. We devised an intelligent river water monitoring system to carry out each monitoring responsibility in light of these observations.
Remote sensing imaging has been used alongside machine learning algorithms, IoT, and wireless sensors in the current literature to forecast pollution levels in lagoon waters. This novel methodology allows continuous monitoring of contaminants, with possible implementations in agriculture [11]. Previous studies employed machine learning techniques to forecast water quality but needed help obtaining adequate results. A study suggested a technique for monitoring contamination in real time by using sensors to measure characteristics such as temperature and water discharge. However, this approach is only applicable to a particular geographic region. Dissolved solid analysis (DSA) was performed to examine water contaminants in single and mixed water samples by Smith et al. [12]. Several studies have demonstrated the effectiveness of AI and IoT-based water quality monitoring methods. Li et al. [11] achieved an accuracy of 92% in predicting water quality using machine learning models, whereas Cui et al. [13] developed an IoT-based microbial contamination detection system with a sensitivity rate of 95% [14–16]. Porwal et al. [17] utilized support vector machines (SVMs) for water quality classification, achieving an F1 score of 0.88, indicating high classification reliability. While these studies highlight the advantages of AI and IoT, challenges remain in terms of adaptability across diverse water bodies, sensor calibration, and data scalability [17]. Real-time awareness is considered essential in flood-prone areas such as the Philippines, leading to the development of advanced flood monitoring and forecasting systems by Lee et al. [18]. An economically efficient supervisory control and data acquisition (SCADA) system utilizing a GSM module was suggested to remotely monitor water quality indicators by Johnson et al. [19]. Novel instruments, including Forel-Ule color scale stickers, the TurbAqua mobile app, and integrated platinum (Pt) sensors in a microelectromechanical system (MEMS), were developed to detect water color and clarity [20, 21]. A real-time turbidity monitoring system utilizing infrared detectors was developed as an open-source optical system by Rao et al. [22]. In addition, a microcontroller system was created to communicate wirelessly and measure water quality parameters. This system demonstrates a high level of sensitivity and accuracy, which is comparable to commercial sensors by Cui et al. and Alam et al. [13, 23]. Khan et al. [24] investigated the seasonal fluctuations and clustering of monitoring stations along the Yamuna and Ganga rivers in the Indian state of Uttarakhand using cluster analysis (CA) components, principal component analysis (PCA), and correlation analysis.
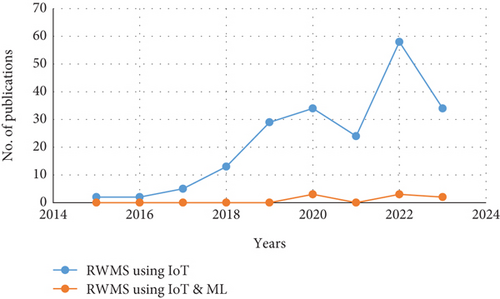
Figure 1 highlights that the full potential of these technologies, especially ML, in river water monitoring still needs to be realized, even though research trends point to steady growth in exploring RWMS with IoT. The research community is currently focused on using connectivity and real-time data capture, as seen by the significant influence of IoT in recent years. The dynamic character of these trends highlights the necessity of ongoing research and development in the RWMS field using IoT and machine learning.
3. Identification of Water Quality in the Odisha Section of the Mahanadi River
The monitoring stations were strategically placed to capture diverse pollution sources and environmental conditions along the Mahanadi River. Instead of uniform placement, the stations were chosen based on key environmental and geographical factors, ensuring representation of distinct belt types (industrial, residential, agricultural) and varying pollution intensities. This approach allows for a more comprehensive assessment of seasonal contamination patterns, enabling precise water quality monitoring in areas most impacted by human and industrial activities [25–27]. Traditional water quality testing techniques are isolated, complicating effective water environment management.
This study introduces a water quality monitoring system for the Mahanadi River, leveraging an intelligent decision-making module based on IoT architecture. This system enhances river environment management by enabling automatic and intelligent data collection for water quality analysis [28]. The main objective is to implement a capable mechanism to continuously monitor river water quality. To improve the quality of water, this system focuses on assessing vital indicators, including pH, DO, BOD, COD, and TC.
3.1. IoT Architecture of the Monitoring System
This paper divides the IoT system into three parts: the physical, middleware, and application layer. The system implements the divide-and-conquer strategy in response to the diverse monitoring waters and complex environment [29, 30]. To do this, the entire water area is divided into 10 monitoring subnetworks. While operational, the monitoring terminal creates a water quality monitoring network in the designated water area. The water quality gateway then transmits the water quality data through the main transmission network. The monitoring center handles data aggregation and management, ultimately allowing online water quality monitoring of the designated water area. Figure 2 shows the complete design framework of the IoT water quality monitoring system.
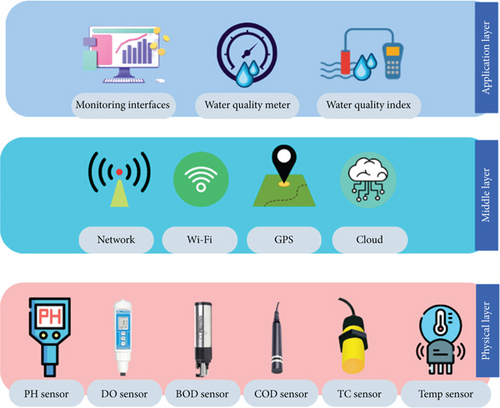
Figure 2 captures the orchestrated data flow from the physical layer, through efficient transmission through middleware, to the cloud application for in-depth analysis. The user-friendly interface at the application layer ensures accessibility and usability, making the river water monitoring system a comprehensive and effective tool to manage the water quality of the Mahanadi River. The IoT monitoring architecture uses the water quality monitoring terminal. It is widely deployed in certain bodies of water, and its main function is to gather and transmit water quality information in real time [31]. The proposed monitoring system used Wi-Fi technology to establish subnetworks for dynamic monitoring of water quality. During operation, the terminals collect data on pH, DO, BOD, COD, and TC levels in the water. They follow the system instructions and aggregate significant water quality data within the network. Figure 3 illustrates a schematic diagram of the proposed RWMS.
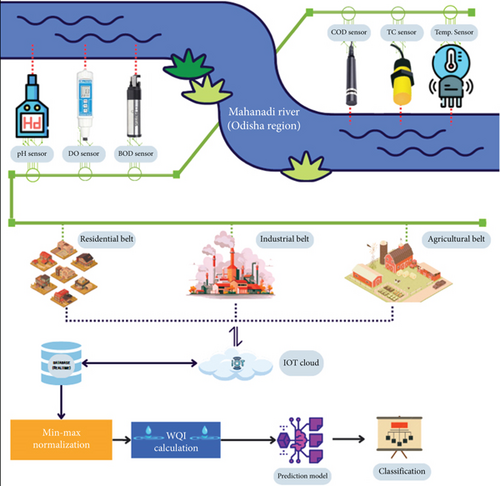
Figure 3 visually represents the proposed IoT-based river water monitoring (IoT-RWM) system. The system was developed to collect data from the Mahanadi River in 10 distinct locations spanning different sectors (industrial, residential, and agricultural) and varying seasons (summer, winter, fall, and monsoon). The sensor deployment process culminates in the computation of the WQI via normalization and machine learning classification, as depicted in the schematic diagram. This IoT-RWM system is aimed at improving the monitoring and categorizing of water quality in the Mahanadi River, providing vital knowledge for efficient environmental governance.
3.2. Description of the Study Area
The Mahanadi River, a prominent river that flows in the eastern direction of Peninsular India, mostly passes through Chhattisgarh, Odisha, and, to a lesser degree, Jharkhand, Maharashtra, and Madhya Pradesh. The river originates in the Dhamtari district of Chhattisgarh at an elevation of around 442 m above sea level. It stretches for a distance of 851 km before reaching its endpoint in the Bay of Bengal. The Mahanadi River basin, which spans 141,600 km2 or approximately 4% of the country’s total land area, is classified as a predominantly mixed coastal plain estuary due to its physical attributes. The basin has a tropical monsoon climate. The basin’s land is mostly used for agriculture, forest reserves, industries, and residential areas. Sampling sites were strategically placed across the basin to thoroughly evaluate the state of the Mahanadi River as it flows through the entire basin. An intensive effort was made to assess surface water quality in important places along the river as part of the sampling and analyzing of river water using IoT technologies. For the current investigation, water quality data obtained by the IoT node from 10 monitoring stations were utilized. These stations include Paradeep (S-1), Jharsugoda (S-2), Kathajodi (S-3), Sankhatras (S-4), Kuakhai (S-5), Kua R (S-6), Daya at kanas (S-7), Rajdhani College (S-8), Chandaka forest (S-9), and Khordha vadimula (S-10) shown in Figure 4 and the study area shown in Figure 5.
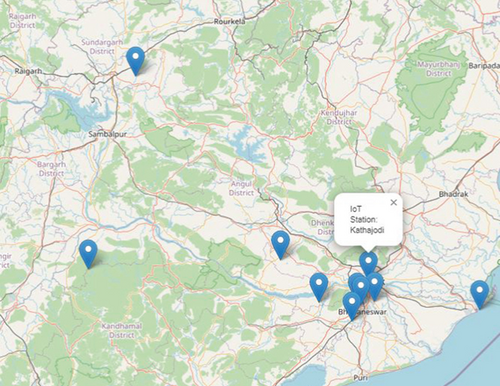
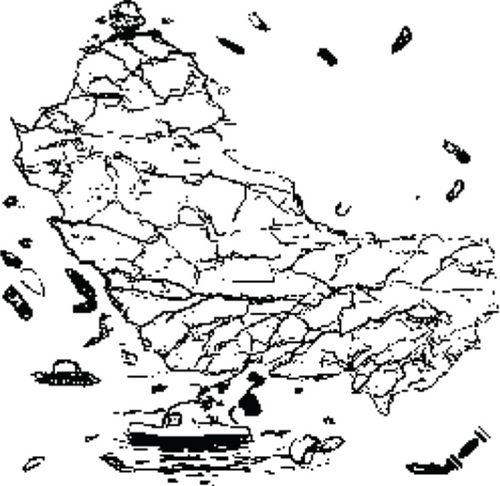
Every month for the entire year of 2022, water samples were taken below the surface. The sampling stations that were selected were arranged in a way that would cover a range of seasonal and belt changes. This all-encompassing sampling strategy sought to capture dynamic variations in water quality throughout the year, considering the distinctive qualities of each site and the impact of several seasons. Detailed studies and evaluations were based on data from the water parameters of the different stations. IoT technology guarantees precise and real-time monitoring of critical water quality indicators.
3.3. Experimental Setup
- ➢
A pH sensor is tasked with the critical responsibility of determining the chemical composition of a river by analyzing its pH level.
- ➢
The DO sensor monitors and quantifies the amount of oxygen in the water. Measurement of DO is a critical indicator of a river’s capacity to sustain aquatic life.
- ➢
The BOD sensor is determined by evaluating the amount of oxygen microorganisms consume as they decompose organic matter in water. This metric provides insight into the extent of waste contamination.
- ➢
The COD sensor determines the informational value of chemical contaminants present in water by quantifying the oxygen required for the chemical degradation of pollutants.
- ➢
The TC sensor detects the concentration of TC bacteria, an indicator of microbial contamination and the associated risks to human health.
The integration of the sensors produced a robust monitoring system that consistently assessed and tracked the dynamic changes in water quality over the specified duration of 1 year. A comprehensive understanding of the water quality of the Mahanadi River was achieved through real-time experiments, which is critical for environmental management and decision-making in the region. Table 1 shows the type of sensors and their measurement standards according to the Department of Water Resources & River Development. The sensors used in this study were calibrated to meet these standards, ensuring accuracy and consistency in data collection throughout the experimental setup.
| Parameters | Sensor type | Range | Accuracy |
|---|---|---|---|
| pH | pH sensor | 6.5–8.5 | ±0.01 pH |
| DO | DO sensor | > 4.0 | ±0.1 to ±0.2 mg/L |
| BOD | BOD sensor | < 3.0 | ±0.1 to ±0.5 mg/L |
| COD | COD sensor | Maximum 10 | ±5 to ±10 |
| TC | Microbial sensor | < 5000 | ±2% or ±0.1 NTU |
Data collection and transmission to the real-time database through the IoT cloud depended on the sensors.
3.4. Dataset Generation
The dataset was effectively collected using IoT sensors located at 10 individual monitoring points over 12 months. These sensors are aimed at collecting as much information about the parameters crucial for the quality of water, such as pH, DO, BOD, COD, and TC, a primary indicator in measuring biological pollutants, which can alter the chemical properties within an aquatic environment. Here, we are also interested. All stations in the data collection process incorporated continuous monitoring and recordkeeping of these parameters. This led to a coherent dataset that represents the fluctuation in water quality throughout the year in fine detail. Ten monitoring stations were established in residential, industrial, and agricultural areas along the banks of 10 angling grounds on the Mahanadi River. Data from the four seasons (summer, winter, autumn, and monsoon) were included in the dataset. The dataset covers different settings of changes in water quality measures. The long duration of the monitoring and various geographic locations led to a deep understanding of the different variations in water quality on the Mahanadi River. The dataset has 121 rows and 13 columns. Each row in the dataset means a different observation or measurement; each column refers to one of the variables studied. These accumulated data, including pH, DO, BOD, COD, and TC measurements, provide a solid foundation for in-depth analysis and assessment. This dataset is invaluable for understanding the environmental health of the Mahanadi River. To extract insights into trends, patterns, and potential relationships among water quality measures, it is only when we fully understand these elements that we can hold onto or add value; it has never been strictly about cost-cutting only.
3.5. WQI
The WQI is a numerical rating of water quality based on several standards that determine whether it should be used for drinking or washing. Different numerical ranges were used in previous research [32–34], for example, to represent the quality index. These ranges were based on the number of weights assigned to different criteria. The WQI was created by processing the dataset, assigning weights to each indicator and subsets of indicators, or calculating these inherent in individual indices.
3.5.1. Preprocessing
3.6. Correlation Analysis
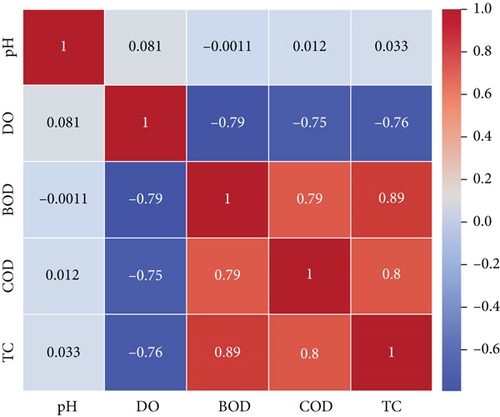
Correlation analysis facilitates the identification of connections between various metrics of water quality. This information is vital to comprehend the intricate interaction among many factors that impact water quality. Figure 6 shows the heat map that illustrates the correlation between several characteristics.
- I.
pH and TC
- II.
DO and BOD
- III.
COD and TC
The correlation coefficient between pH and TC is 0.8, indicating a robust positive association. As the pH level rises, there is a corresponding tendency for the TC to increase. The correlation coefficient between DO and BOD is −0.79, indicating a robust negative association. As DO levels grow, BOD generally decreases. This occurs because microbes utilize DO during the decomposition of organic matter in the BOD. The correlation coefficient between COD and TC is 0.89, indicating a robust positive correlation. As the cost of debt increases, there is a corresponding tendency for the TC to grow. The remaining pairs of features have weaker correlations. The correlation coefficient between pH and DO is 0.081, which indicates a weak positive correlation. The correlation coefficient between pH and COD is −0.0011, essentially zero. The correlation coefficient between BOD and DO is −0.75, which indicates a moderate negative correlation.
However, the heat map plot indicates that pH, DO, BOD, and TC are highly connected.
3.7. XGBoost
XGBoost is a robust machine learning algorithm with great potential. It has proven to be accurate in predicting water quality for applications on different scales, from small wells to large reservoirs and estuaries. It offers several advantages compared to traditional methodologies: (a) Water quality indicators include DO, pH value, and TC bacteria. With XGBoost, it is possible to accurately predict their values. (b) Its precision makes it a beneficial monitoring and control indicator for water quality. (c) XGBoost is very flexible, and its powerful ability to quickly handle a broad range of water quality data (categorical and numeric attributes) not only makes it a precious tool for forecasting the spread of blue–green algae but also puts up several appearances on screen. For these reasons, it is adaptable and can easily be tailored to fit many aquatic environments and various surveillance activities. (d) The XGBoost algorithm suits water quality data at different levels, spaces, and times. Due to its ability to process large datasets, it represents a new step forward in the analysis world. (e) Accordingly, the means for XGBoost’s feature importance scores can determine which attribute exerts the most significant influence on water quality within each location where the analysis takes place. Using these data in this way, more concrete water quality control programs can be specified.
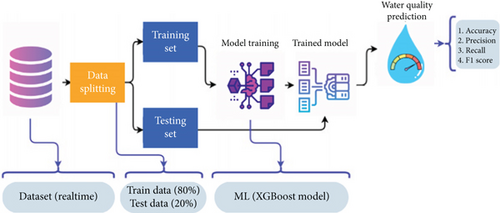
This article suggests a simple and effective way to forecast water quality and use. This investigation used the methodology shown in Figure 7. Accuracy, precision, recall, F1 score, and confusion matrix are metrics for testing models predicting water quality. The systematic methodology of the research then examines the performance of a machine learning model based on a real-time dataset. We divided our dataset into 80% for training and 20% for testing.
3.8. Performance Evaluation/Validation of the Model
where TP, TN represent true positive and negative and FP, FN represent false positive and negative, respectively.
4. Experimental Results, Analysis, and Implications
During the data collection period of January 2022 to December 2022, 10 monitoring sites were chosen to evaluate the water quality of the Mahanadi River in various Odisha regions. The dataset was compiled according to season and belt type (including industrial, agricultural, and residential belts) using IoT sensors. The methodology outlined in Section 3.7 was used to calculate the WQI. The classification of water quality was determined by giving values to many characteristics of the water, as shown in Table 2.
| Sl. no. | WQI range | Category | Assigned value |
|---|---|---|---|
| 1 | 0–50 | Excellent | 0 |
| 2 | 50–100 | Good | 1 |
| 3 | 100–200 | Poor | 2 |
| 4 | 200–300 | Very poor | 3 |
4.1. WQI for Months
Our research is aimed at examining water quality fluctuations every month using the WQI throughout the year. To determine the monthly WQI, the median value of the quality index assessments for the month is calculated.
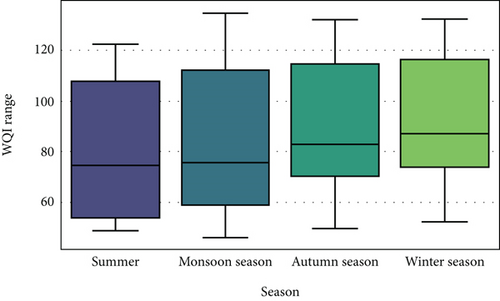
Figure 8 indicates that the highest WQI (poorest water quality) is observed in summer, while the lowest WQI (best water quality) occurs in winter. This seasonal variation is primarily influenced by increased microbial activity, organic matter decomposition, and agricultural runoff during the warmer months. Bacterial proliferation and the release of organic substances from detritus can increase during the summer, which can contribute to the degradation of water quality. Monsoon season runoff from agricultural regions can be significantly increased due to the transport of contaminants into water bodies facilitated by heavy precipitation. In autumn, leaf decomposition can occur in bodies of water containing fallen trees. This process can lead to oxygen depletion and increased levels of BOD. In winter, lower temperatures can impede the rate of bacterial decomposition, resulting in the accumulation of organic waste in aquatic environments.
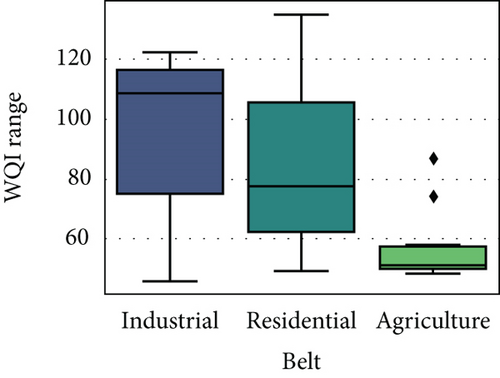
The WQI of the industrial belt is the highest, followed by the residential and agricultural belts as shown in Figure 9.
- I.
pH: The pH values at all sites exhibit consistent stability throughout the year, ranging from 6.5 to 8.5. This falls within the ideal range for supporting aquatic organisms.
- II.
DO: The DO values of all sites fluctuate throughout the year, between 0.5 and 9 mg/L. In some sites, the DO level is not suitable for aquatic and drinkable purposes.
- III.
BOD: BOD levels peak during May and June and are at their lowest during November and December across all stations. The probable cause is the increased discharge of organic materials from agricultural activities during the monsoon period.
- IV.
TC: The TC peaks in May and June, while it is at its lowest in November and December for all stations. The probable cause is the increased discharge of fecal coliforms resulting from agricultural activities and human waste during the monsoon period.
- V.
COD: The concentration of COD peaks during May and June, reaching its lowest levels in November and December for all stations. The probable cause is the increased discharge of organic matter from agricultural activities and human waste during the monsoon period.
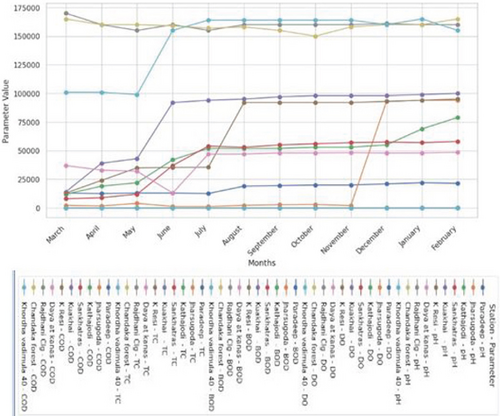
There is variation between the stations with respect to the water quality parameters, and certain stations demonstrate exceptional conditions. Compared to Kathajodi and Sankhatras stations, the water quality at Paradeep and Jharsugoda consistently improves. The water quality metrics at all stations demonstrate a seasonal pattern in which the monsoon season provides the most unfavorable conditions. Increased levels of COD, TCs, and BOD are commonly ascribed to the increased discharge of agricultural runoff and human waste during the monsoon season. Except for the elevated levels of DO, BOD, TC, and COD recorded during the monsoon season, the water quality indicators at all locations are adequate.
The categorical plots of several water quality metrics are shown in Figure 11. The excellent water quality has a narrower pH range than the good water quality. As a result, pH is a more sensitive indication of water quality than the other measures. DO values corresponding to exceptional water quality are more significant than those of good water quality. This is because DO is required for aquatic life to survive. Excellent water quality is characterized by lower COD and BOD ranges than acceptable water quality. This finding indicates that water quality is positively correlated with minimal levels of organic matter. The TC range for outstanding water quality is lower than the TC range for medium water quality. This indicates that minimal bacterial concentrations signify water quality.
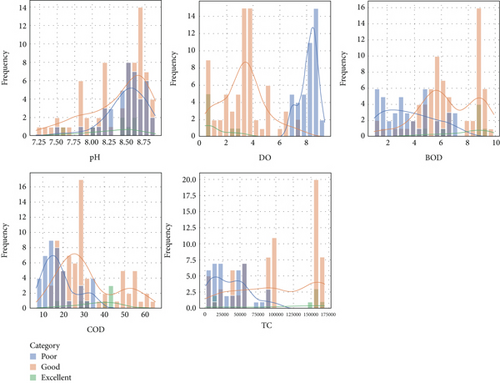
The graph indicates that the pH, DO, COD, BOD, and TC parameters are critical water quality indicators. By monitoring these factors, we can better understand the general health of a water body and adopt protective measures.
4.2. Results for Water Quality Prediction
Machine learning models were used to forecast water quality categories, specifically “excellent,” “good,” and “poor.” The results of the experiments conducted to estimate water quality using machine learning models are provided in Table 3. The findings are relevant for the forecasting of water quality.
| Metrics | Accuracy | Precision | Recall | F1 score |
|---|---|---|---|---|
| Values | 0.95 | 0.96 | 0.95 | 0.95 |
- ➢
The accuracy value obtained of 0.95 indicates that the models successfully classified 95% of events related to water quality.
- ➢
With a precision value of 0.96, it can be identified that 96% of the instances categorized as “excellent,” “good,” or “poor” were classified accurately.
- ➢
The recall value of 0.95 indicates that the models accurately classified 95% of the water quality instances as “excellent,” “good,” or “poor.”
- ➢
The F1 score of 0.95 indicates that the models demonstrate a wonderful balance between recall and precision.
The confusion matrix in Figure 12 indicates that the model exhibits high accuracy in predicting water quality as excellent and good. In contrast, its performance in predicting poor water quality is comparatively lower. This is because there is a higher occurrence of false negatives, where the model incorrectly predicts good water quality despite the natural water quality being poor, compared to false positives, where the model incorrectly predicts poor water quality despite the actual water quality being good.
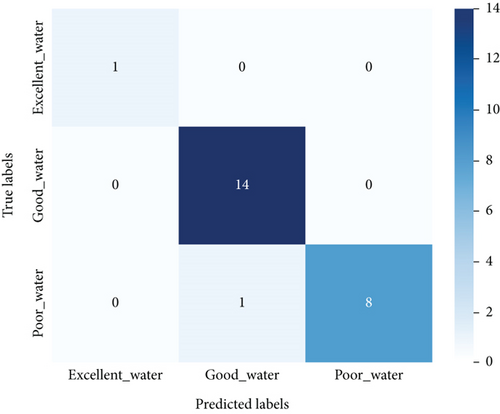
However, the model exhibits high precision and recall rates for excellent and good water quality but lower rates for bad water quality. These findings indicate that the model may exhibit a bias towards accurately forecasting high-quality water conditions, leading to the omission of instances of low-quality water conditions.
During our model implementation, we observed a training accuracy of 100% after 20 epochs and the test accuracy of our model reaches 95% after 20 epochs and this trend is almost constant up to 50 epochs, as shown in Figure 13. This is a positive indication since it suggests that the model is learning from the data and improving its ability to forecast water quality categories. The learning curve indicates that the model can accurately forecast water quality categories.
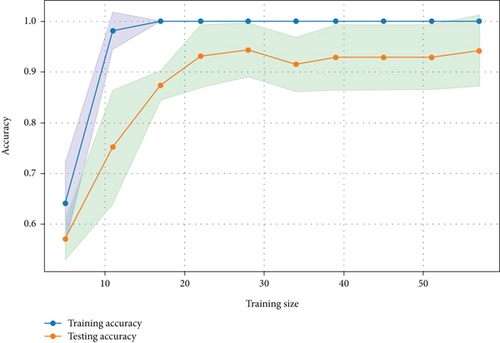
However, the findings of this analysis indicate that XGBoost has the potential to be a highly effective method for forecasting water quality classifications.
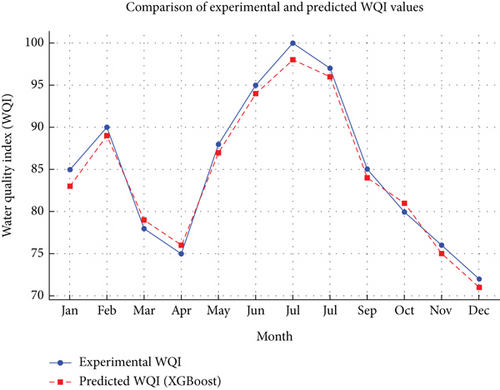
Figure 14 illustrates the accuracy of the XGBoost model in predicting WQI across different monitoring stations. The solid line represents experimental WQI values, while the dashed line represents model-predicted WQI. The close alignment between the two indicates the model’s reliability in assessing water quality trends.
4.3. Comprehensive Analysis
To show the importance of our proposed approach, we compared performance in this study. In the Related Work section, several carefully selected studies were analyzed that address the current problem. Researchers used IoT sensors and statistical techniques to collect online data throughout the experiment [35]. An alternative method was [36] the use of long- and short-term memory (LSTM) to forecast water quality. A summary of these studies is provided in Table 4, which shows that the proposed methodology unambiguously outperformed existing studies in all scenarios.
| Works | River name | Data frame | IoT used | WQI calculated | Seasonal | Belts | Statistical/ML/DL model |
|---|---|---|---|---|---|---|---|
| [35] | Citarum River | 2018–2020 | √ | X | X | X | √ |
| [36] | Yangtze River | 2016–2018 | √ | X | X | X | √ |
| [40] | Weihe River | — | √ | X | X | X | √ |
| [37] | Satluj River | — | X | √ | X | X | √ |
| [41] | Thamirabarani River | May 2021–Dec 2022 | X | X | X | X | √ |
| [1] | Sangam (Ganga and Yamuna River) | Oct 2019–Feb 2020 | √ | √ | √ | X | X |
| [38] | Mahanadi River | 2011–2019 | X | √ | X | X | √ |
| [39] | Mahanadi River | 2000–2018 | X | X | X | X | √ |
| Proposed work | Mahanadi River | January–December 2022 | √ | √ | √ | √ | √ |
Approaches to assign water quality monitoring responsibilities based on clustering of ant colonies algorithmic were presented in [40]. Forecasting the quality of the water of the Satluj River was performed using various statistical methodologies [37]. Researchers using a hybrid deep learning model [41] predicted the water quality of the Thamirabarani River. The comparisons of WQI between seasons were derived from IoT sensors installed at the Sangam of Ganga and Yamuna to collect real-time data [1]. The Mahanadi River was investigated statistically and with artificial neural networks (ANNs) [38]. The water quality of the Mahanadi basin was studied using a multivariate statistical method [39]. These approaches were used to analyze the dataset we studied, such as calculating WQI and seasonal analysis and belt-wise comparison of WQI. Then, their results were compared with the proposed methodology. An impressive 95% accurate prediction model was developed with XGBoost, a machine learning model.
4.4. Implications of the Investigation
The implications of our proposed research, which centers on the utilization of IoT sensors, WQI calculations, and predictive models to monitor and forecast water quality in the Mahanadi River, are of immediate significance to the agricultural, residential, and industrial requirements of the inhabitants of the Mahanadi belt. River water, as an essential component to support life on our planet, profoundly impacts the well-being of organisms. However, the degradation of river water quality has resulted from the accelerating global development. The increasing magnitude of the human population exacerbates the need for copious amounts of potable water. Contrary to expectations, the urbanization necessary to facilitate this increase in population negatively affects the quantity and quality of water. Within this framework, our research underscores the critical nature of collaborative endeavors to assess water quality around the world, thereby highlighting the considerable influence that machine learning techniques can exert in this field. The imminent predicament of water scarcity is a significant concern that presents a danger to many nations in the decades to come. In addition to its worldwide importance, our research has practical implications for the Mahanadi region as it tackles the day-to-day needs of industrial sectors, residential zones, and agriculture. By incorporating IoT sensors, predictive models, and WQI calculations, a comprehensive strategy is achieved to monitor and forecast water quality. Figure 3 illustrates the proposed architecture, defining a methodical framework suitable for practical implementations. A range of sensors, such as pH, DO, BOD, COD, and TC, are utilized to collect a variety of water parameters. Precise water quality evaluations are achieved after entering these values into the predictive model.
5. Conclusion and Future Work
Water quality must be monitored regularly to ensure human survival, as it is the most essential ingredient for life on Earth. For this research, a 10-site monitoring network was strategically positioned to conduct a comprehensive assessment of water quality along the Mahanadi River in different Odisha regions. From January to December 2022, the data collected by IoT sensors was classified into distinct seasons and belts (industrial, agricultural, and residential). The preprocessing of the massive dataset, consisting of 121 rows and 13 columns, was thorough and included data cleansing and min–max normalization. This normalization technique standardized characteristics and improved water quality assessment and forecast models. In order to facilitate a thorough evaluation, weights were assigned to particular parameters, subindices were developed, and the WQI was computed. Stations such as Jharsugoda and Paradeep generally have higher water quality than other areas, with pronounced seasonal fluctuations, most notably during the monsoon season. Significant discoveries are increased concentrations of COD, TC, and BOD during the monsoon, which can be attributed to increased human waste and agricultural effluent. The importance of pH was underscored by the fact that it was a sensitive indicator with a more limited range for exceptional water quality. The correlation between critical parameters (pH, DO, COD, BOD, and TC) and the overall health of the water bodies underscored their importance. Machine learning models, more precisely, XGBoost, were implemented to predict water quality categories with a notable 95% accuracy. A comprehensive evaluation of the proposed method on established approaches, including assessments of seasonal patterns, WQI computation, and belt-wise comparisons, revealed its superior performance. The precision of the predictive model provided additional evidence of its effectiveness, which established it as a potentially helpful instrument for evaluating water quality in the Mahanadi River. The findings of this study, which emphasize validation and forecasting while utilizing advanced machine learning models, highlight its potential to address the critical need for adequate water quality assessment and management, thereby providing valuable information for environmental conservation and sustainable water management practices.
- i.
For real-time monitoring to be accurate, sensor calibration must be done periodically to prevent data drift.
- ii.
The model is trained on 10 monitoring sites, restricting its applicability to other river systems with various pollution sources.
- iii.
The approach does not explicitly account for abrupt pollution events like industrial spills, which could affect real-time estimates.
XGBoost performs well, but its computational complexity may limit real-time adoption on resource-constrained IoT devices. Addressing these restrictions would improve the suggested approach’s reliability.
Future research should focus on improving sensor calibration and precision by incorporating self-calibrating sensors or developing automated recalibration mechanisms to mitigate data drift. Applying the model to numerous river basins with different ecological and industrial situations improves its scalability and generalization. Finally, merging IoT sensor data with satellite imaging, weather data, and remote sensing technologies can improve water quality management prediction and early warning. These enhancements will make river ecosystem water quality monitoring more robust, scalable, and flexible.
Nomenclature
-
- IoT
-
- Internet of Things
-
- ML
-
- machine learning
-
- GSM
-
- global system for mobile communications
-
- WQI
-
- water quality index
-
- DO
-
- dissolved oxygen
-
- BOD
-
- biochemical oxygen demand
-
- COD
-
- chemical oxygen demand
-
- TCs
-
- total coliforms
-
- RWMS
-
- river water monitoring system
-
- SI
-
- subindex
-
- Wi
-
- weights
-
- Ni
-
- normalized values
-
- TP
-
- true positive
-
- TN
-
- true negative
-
- FP
-
- false positive
-
- FN
-
- false negative
Conflicts of Interest
The authors declare no conflicts of interest.
Funding
The authors declare that no funding was received for this research.
Open Research
Data Availability Statement
The data utilized in this study was collected through IoT sensors by the authors. Access to the dataset is possible through personal request, and inquiries can be directed to [email protected]. The authors are committed to providing transparency and facilitating data access for further scrutiny and reproducibility.


