Making Use of Local Waste: Adsorptive Removal of Novacron Red FN-2BL Using CTAB-Aided Sodium Hydroxide–Pretreated Jute Fibers
Abstract
The purpose of our work was to increase the efficacy of jute fibers through the application of two successive treatments: sodium hydroxide (NaOH) and cetyltrimethylammonium bromide (CTAB). The goal was to remove the dye Novacron Red FN-2BL from wastewater. We thoroughly investigated how different parameters, such as initial concentration of dye (20–100 mg/L), adsorbent dosage (0.01 g–0.10 g), contact time (2–16 min), pH (from 2 to12) and temperature (298, 308, and 318 K) affected the kinetics of removal of dye. The removal efficiency of reactive dye Novacron Red FN-2BL by the jute treated with surfactant CTAB (JST) adsorbent peaked at 95% using 0.05 g/50 mL dye solution, an initial concentration of dye of 40 mg/L, pH 7, contact time of 8 min, and temperature of 298 K. A thorough understanding of the process of adsorption was made possible by our experimental setup, and the data fit effectively into a variety of isothermal and kinetic models. In particular, the adsorption behavior was well-represented by the Langmuir isotherm model, and the adsorption kinetics followed a pseudo-second-order model. Notably, a remarkable 74.63 mg/g of monolayer adsorption was possible at 318 K. An endothermic adsorption phenomenon is reflected by the increasing value of KF (Freundlich’s constant) on rising temperature. Furthermore, the Dubinin–Radushkevich isotherm demonstrated a physisorption-like mechanism for the adsorption of Novacron red FN-2BL dye on JST; the magnitude of E, which varied from 1.29 to 2.24 KJ/mol when the temperature rose from 298 to 318 K, indicated the process’s temperature dependence. With respect to thermodynamics, the ΔH∗ value was found to be 11.73 KJ/mol, and the ΔS∗ value was determined as 65.74 J/mol/K. An entropy-driven nature, spontaneity, and feasibility of Novacron Red FN-2BL adsorption on JST are highlighted by the positive ΔS∗ and consistently negative ΔG∗ (ranging from −7.87 KJ/mol to −9.19 KJ/mol, across all temperatures).
1. Introduction
The textile dyeing and treatment sector is responsible for 17%–20% of water pollution caused by industries, ranking it as the tenth largest contributor of pollution to the waterways. [1, 2]. It is astonishing that instead of adhering to textile fibers, up to 50% of these dyes remain as contaminants in liquid effluents [3].
Anionic dyes (direct, acidic, and reactive dyes), cationic dyes (basic dyes), and nonionic dyes (disperse dyes) are the three categories into which dyes are divided [4]. A specific kind of reactive dye used in textile dyeing procedures is called Remazol dyes. Remazol dyes’ molecular structure enables them to build stable covalent bonds with textile fibers through their reactive groups like vinyl sulfone, monochlorotriazine, or monofluorotriazine. The development of covalent bonds in Remazol dyes leads to remarkable color retention, even after multiple washings, which makes them an ideal choice for creating vivid and durable textile colors. Remazol dyes are renowned for their scalability as well because they may be used in a variety of dyeing situations, including colder temperatures and without the requirement for extra fixing agents. Novacron Red FN-2BL (RR) dye has been one of the most widely used Remazol dyes since its introduction.
Wastewater containing dyes is treated using a variety of techniques, including chemical [5, 6], biological [7], physical [8–13], and more contemporary, cutting-edge technologies, including nanotechnology [14, 15], microbial nanocomposites [16], and microbial fuel cells [17].
Adsorption is a particularly efficient and simple technique for removing dye from wastewater among these techniques. Its main benefits are that it is inexpensive, easy to use, and reusability, which makes it ecofriendly [18]. During this procedure, dyes are transferred from the solution to the surface of the adsorbent [19]. However, the creation of effective adsorbents is a prerequisite for the effectiveness of adsorption technology.
Many different materials have been researched as adsorbents to remove dye effluents. These materials include activated carbon [20, 21], hydrochars [22], nanomaterials [23–25], bioadsorbents [26–29], layered double hydroxides [30, 31], and composites [32, 33].
Reactive dye adsorption on different adsorbents has been the subject of numerous studies [34–40]. Furthermore, cationic [41–53], anionic [54, 55], and nonionic surfactants have also been used in conjunction with other adsorbents for the removing dye from wastewater [56, 57]. Utilizing low-cost, renewable lignocellulosic waste fibers with particular chemical compositions as biosorbents is currently gaining popularity. Examples of these fibers include jute [58–61], coconut coir [62–64], kenaf [52, 65–67], ramie [68, 69], banana trunk or stem fibers [70–74], cotton fibers [75–79], and flax [80–83]. Extensive research is being conducted on these materials to explore their potential in dye removal applications.
Waste jute packaging bags were used as the adsorbent’s raw material in our investigation. These used bags were purchased from nearby merchants. The first step of the pretreatment process for the jute material was scouring with 2% sodium hydroxide (NaOH) preceding mercerization with 18% NaOH. The aim of this successive treatment was to increase the acceptability of the jute fibers (JFs) for a later surfactant and dye treatment. Jute is regarded as the second-most important natural fiber in terms of production, use, and consumption, right after cotton. [84]. Jute is one of the main agricultural products and plays a vital role as a crop, particularly throughout the Indian subcontinent. About 85% of the jute produced worldwide comes from India and Bangladesh.
JF is a bast fiber that is obtained from the bark of the jute plant. It is composed of three main groups of chemical compounds: (i) 58%–63% of cellulose, (ii) 20%–24% of hemicellulose, and (iii) 12%–15% of lignin, in addition to a small number of additional aqueous extract, pectin, lipids, etc. [85]. The tiny cellulose units that make up JF are encased and bound together by hemicellulose and lignin [86].
Dye adsorption is facilitated by the carboxyl and hydroxyl functional groups found in JFs. Because of its abundant porosity structure, excellent mechanical properties, and ease of processing, JF has been studied as a possible biosorbent. [87–89]. The electrophysical and sorption properties of jute fabric have been improved by a variety of modifications, such as oxidative and alkali treatments.
Different forms of jute, such as jute stick powder [90], jute stick activated carbon [91], NaOH-treated JF [92–94], Na2CO3-treated JFs [95], polyphenolic tannin modified JFs [96], and sodium periodate (NaIO4) oxidized JFs [97] have been used in dye removal. Furthermore, several of these modifications require high-temperature pyrolysis or treatments with potent reducing agents, which can be more expensive or complex.
Our method, on the other hand, offers a more economical and ecologically friendly solution by first applying a basic caustic treatment and then applying a surfactant treatment. Additionally, our approach is more environmentally friendly because the dye-loaded adsorbent may be used in other applications. Our research involves treating caustic-treated jute fibers (JCT) with cetyl trimethyl ammonium bromide (CTAB) to create jute treated with surfactant CTAB (JST), an adsorbent that is used to remove reactive dye RR from textile effluent. To our knowledge, JFs modified in this way have never been employed as an adsorbent for removing dye from effluent.
2. The Materials Utilized and Procedures
2.1. The Materials Utilized
JFs were procured from a nearby vendor (Sat departmental store, Guru Nanak Dev University main campus Amritsar), while Loba Chemie Laboratory Reagents & Fine Chemicals provided the surfactant, CTAB (CAS No. 57-09-0) with minimum of 98% purity. The supplier of the caustic soda lye (flakes) (CAS No. 1310-73-2) with minimum of 99% purity was Meenakshi Trading Company, Amritsar, whereas the Reactive dye RR/Reactive Red EC-2BL used was supplied by Colour-Chem India Pvt Ltd. The dye is a reactive dye containing fluorine-s-triazine and vinyl sulfone group. The RR dye is a patented dye so its complete structure could not be obtained from literature. It has a stable chemical structure, giving it excellent color fastness and process stability and the color yield is extremely high. All other compounds employed in this investigation were analytical grade.
2.2. Procedures
2.2.1. Preparation of Adsorbent
A series of treatments were applied to 10 g of JFs (jute before treatment (JBT)) (Figure 1(a)) in order to prepare the adsorbents. Firstly, the fibers were boiled for 1.5 h at 358 K in a 500 mL solution of 2 wt% NaOH. The fibers were filtered; then, they were agitated for 2 h at room temperature in 300 mL of an 18 wt% NaOH solution. After giving the treated fibers a thorough rinse with deionized water, they received another filtering. JCT were then produced by drying the fibers at 333 K for 2 h, as shown in Figure 1(b).

The JCT fibers were then given a second treatment with the surfactant CTAB, as seen in Figure 1(c), to create JST. Twenty grams of dried JCT fibers and 1.14 g of CTAB dissolved in 500 mL of distilled water were mixed together in a beaker for this step. Following that, the mixture was agitated in a shaker at ambient temperature (298 K) for 24 h. The suspension was allowed to settle after being agitated, and then, the liquid part was thrown away. After being treated with surfactant, the JFs were washed multiple times with distilled water to get rid of any surfactant that might have attached themselves to the surface. The final adsorbent material, which was prepared for further investigation and use, was obtained by drying the JST for 24 h at 333 K in a hot air oven.
2.2.2. Preparation of Dye Solution
Without additional purification, a reactive dye called RR was utilized. A 100 mg/L stock solution of dye was prepared by dilution with distilled water, and multiple needed concentrations were generated from this stock solution in turn. To record the electronic absorption spectra, an ultraviolet-visible (UV-vis) spectrophotometer (Shimadzu UV-1900) was used.
2.2.3. Calculation of pHZPC and Surface Functional Groups
The adsorption process depends critically on the pH of zero-point charge (pHzpc). According to reports, the point of zero charge is defined as pHzpc (pHFinal = pHInitial), and this is the pH where the curve and line intersect. By employing the drift method, the pHzpc of JBT, JCT, and JST were calculated [98]. The adsorption process depends critically on the pH of zero-point charge (pHzpc). By employing the drift method, the pHzpc of JBT, JCT, and JST were calculated [98]. In a volumetric flask of 100 mL capacity, 50 mL of sodium chloride solution (0.01 M) was taken. Using NaOH (0.1 N) for alkaline pH and hydrochloric acid (0.1 N) for acidic pH, several NaCl solutions were prepared, ranging in pH from 2 to 12. For every 50 mL of NaCl solution (pH ranging from 2 to 12), 150 mg of the adsorbents were added. After 24 h of contact, the ultimate pH value was determined and was plotted against the initial pH value. According to reports, the point of zero charge is defined as pHzpc (pHFinal = pHInitial), and this is the pH where the curve and line intersect.
To ascertain surface chemistry, the Boehm titration techniques were employed [99]. Fifty milliliters of sodium bicarbonate, sodium carbonate, hydrochloric acid, and NaOH of 0.01molarity each were taken, and to these batches, 100 mg of adsorbents was added. The mixtures were agitated at 100 rpm for 24 h at 298 K. After that, the aliquots were titrated back with 0.01 M HCl for finding out acidic groups and 0.01 M NaOH for knowing basic groups. Two universal pH indicators—methyl red for strong acid with weak base and phenolphthalein for strong acid with strong base titration—were used to identify neutralization points. According to the presumptions that sodium bicarbonate neutralizes only carboxylic groups, both carboxylic and lactonic groups are neutralized by sodium carbonate, and NaOH neutralizes both carboxylic and lactonic groups, while the basic groups are neutralized by hydrochloric acid, and the amount of each functional group was determined [99].
2.3. Characterization of the Adsorbents
The Fourier transform infrared (FTIR) spectra of the samples were recorded using the attenuated total reflectance (ATR) technique on an Agilent technology Cary 630 spectrophotometer, covering the 4000–400 cm−1 range. Using the X-ray diffraction (XRD) Rigaku MiniFlex 2 analytical equipment running at 30 mA of current and 40 kV with Cu-Kα radiation of wavelength 1.5406 Å, a further description of the samples was obtained using XRD. By assuming that a nitrogen molecule has an area of 0.162 nm2, the BET (Brunauer–Emmet–Teller) method was used to measure the specific surface area of the adsorbents. The surface morphology of JBT, JCT, JST, and Novacron Red FN-2BL dye–loaded jute fibers (RR-JST) was investigated using a Carl Zeiss FE—a specific kind of reactive dye used in textile dyeing procedures called Remazol dyes. The scanning electron microscope (SEM) was run with the anode voltage set to 10 kV and the beam current set to 50 μA. To evaluate the thermal stability of JBT, JCT, and JST, about 2 mg of compounds was examined making use of Hitachi STA7200 type thermogravimetric analyzer. As instructed, the heating was carried out, raising the temperature from 25°C to 600°C at a rate of 10°C/min while the nitrogen flowed at an average speed of 250 ml/min.
2.4. Investigation of Batch Adsorption
In order to clarify the effect of various factors on the adsorption of RR dye onto the adsorbents JCT and JST, investigations into batch adsorption were done. Adsorbent dosage, contact time, pH, initial concentration, and temperature were among the variables examined. The effect of the pH (2–12), contact time (2–18 min), adsorbent dosage (0.01 g–0.10 g), dye concentration (20 mg/L to 100 mg/L), and temperature (298, 308, and 318 K) on the removal of reactive dye RR was studied doing various batch experiments.
In every experiment, 50 mL of RR dye solution of known concentration was taken in a flask; then, the known amounts of adsorbent were added. Next, the mixture was stirred under predetermined guidelines. After filtering the liquid supernatant, the amount of dye that was taken out of the solution and adsorbed onto JCT and JST was measured using spectrophotometry at λmax (524 nm).
Unless otherwise noted, most experiments used a baseline set of standard experimental parameters, which included 0.05 g of adsorbent, pH of 7.0, 8 min of contact time, initial dye concentration of 40 mg/L, and temperature of 298 K.
3. Results and Discussion
3.1. pHZPC and Functional Groups on the Surface
The drift method was employed to ascertain the JF’s point of zero charge (pHZPC), including JBT, JCT, and JST adsorbents.
For JBT, JCT, and JST, the computed pHZPC values were discovered to be 7.3, 6.5, and 8.5, correspondingly (see Figure 2). One important indicator of the adsorbents’ surface charge characteristics is the pHZPC. To be more precise, at pH values below the pHZPC, the surface of adsorbent becomes positively charged, whereas at pH values above the pHZPC, the surface is found to be negatively charged. This finding emphasizes the ideal adsorption conditions, especially for JST, which shows maximum adsorption efficiency at pH values less than 8.5. Given that the dye is anionic, the best adsorption happens when the surface of the adsorbent is positively charged, while the adsorption process is halted by repulsion between the molecules of the anionic dye and the adsorbent surface when the surface of the adsorbent becomes negatively charged.
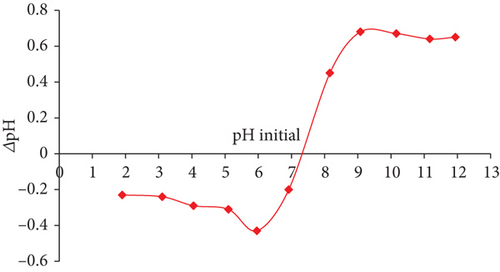
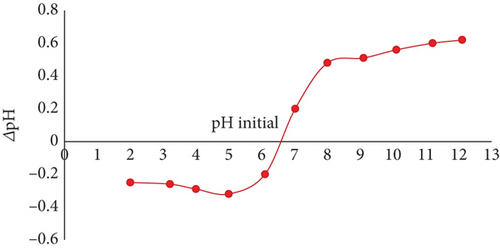
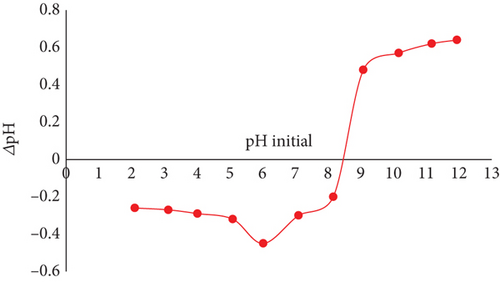
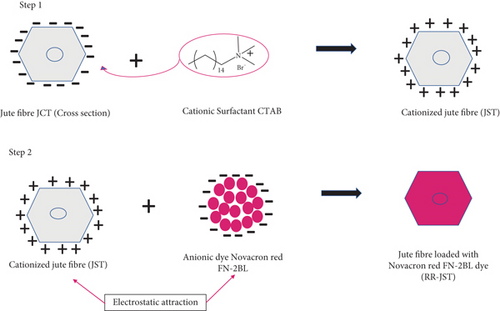
The difference in pHZPC between JBT, JCT, and JST is shown in Figures 2(a), 2(b), and 2(c), which also highlights the transformation of a negatively charged surface into a positively charged one. Significantly, as shown in Figure 2(b), the pHZPC of JCT is less than 7, indicating a surface that is negatively charged, whereas pHZPC of JST is greater than 7 as shown in Figure 2(c), suggesting a surface that is positively charged. The treatment of JCT with the surfactant CTAB is responsible for this change in surface charge because it effectively changes the surface charge of the JFs from the negative to the positive, increasing the affinity of the anionic dye molecules for adsorbent (see Figure 2(d)).
Moreover, the total basic groups, the total acidic groups, and the total functionalized groups were detected in JST by Boehm titration at concentrations of 1.9, 1.49, and 3.39 mmol/g, respectively. These results contribute to a complete knowledge of the adsorption behavior and adsorption mechanism of the adsorbent material by offering insightful information about the surface chemistry and functionalization of the material.
3.2. Characterization of JFs (JBT, JCT, JST, and RR-JST)
3.2.1. The FTIR Studies
Arguably, the most important method for finding out about the different chemical bonds and functional groups found in materials is the FTIR analysis. The JBT, JCT, JST, and RR-JST infrared spectra were recorded in our investigation between 4000–400 cm−1 utilizing an Agilent Technologies Cary 630 spectrophotometer and ATR technique (see Figure 3) [101, 102].
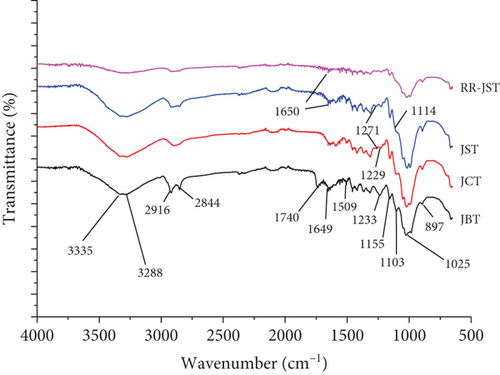
The “fingerprint region” is the area below 1500 cm−1, where it is challenging to identify absorption bands with particular vibration systems. After JBT analysis, significant peaks were found between 1800 and 3500 cm−1. The H-bonded –OH group was represented by a major peak that was centered around 3335 cm−1. On the other hand, this peak’s RR-JST spectrum sharpness significantly decreased, suggesting that the OH group was involved in the interaction between JST and the RR dye. Furthermore, following RR dye adsorption in RR-JST, the sharpness of bands at 2922.2 cm−1 (attributed to the -CH2 groups’ C-H stretching) and 2844 cm−1 (associated with dominant C–H vibrations of aldehyde groups) [103], which were prominent in JBT and JST, significantly decreased. Peaks in JBT observed at 1740 cm−1 and 1233 cm−1 are because of stretching vibration of the carboxyl group’s C=O within the hemicellulose unit [104]. Elimination of a significant portion of the hemicellulose unit during the conversion from JBT to JST via JCT, however, is indicated by the complete elimination of the peak at 1740 cm−1 and a reduced intensity of the peak at 1233 cm−1 in JCT and JST [104]. Also, the band at 1233 cm−1, which was present in JBT, lost intensity. Additionally, a peak at 1271 cm−1, which was absent in JBT, appeared in JCT and JST before disappearing again in RR-JST. Sharp bands seen in JBT at 1649 cm−1 and 1509 cm−1 most likely relate to the lignin benzene ring’s stretching mode. Additionally, C−O−C vibration may be responsible for a sharp band observed at 1025 cm−1. In general, FTIR analysis offers insightful information about the interactions and structural alterations that take place during the modification of JFs and the subsequent adsorption of RR dye.
3.2.2. XRD Study
Based on a material’s crystallinity or amorphousness, we can identify its nature using the XRD technique. Crystalline materials yield well-defined peaks; while noncrystalline or amorphous materials give broad peaks instead of sharp peaks.
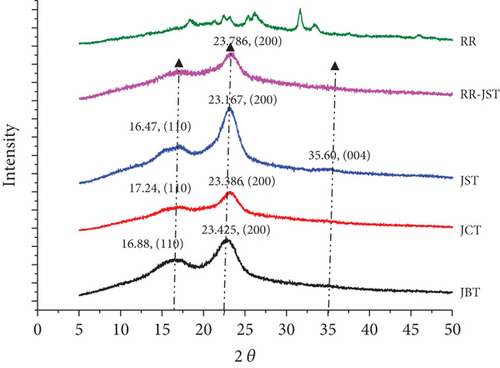
Peaks at roughly 2θ = 16°, 23°, and 35° originate from the 110, 200, and 004 planes of cellulose present in the fibers, respectively [106]. The increase in the peak intensity of the 200 reflections indicates that the crystallinity has increased when JCT is converted to JST [107].
3.2.3. SEM and Energy Dispersive X-Ray (EDX) Analysis
Advanced surface characterization methods, including the EDX analysis and SEM, was utilized to obtain detailed insights into the structural alterations of JFs before and after caustic treatment, followed by CTAB treatment and after being loaded with RR dye.
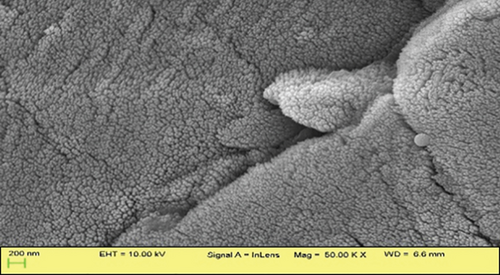
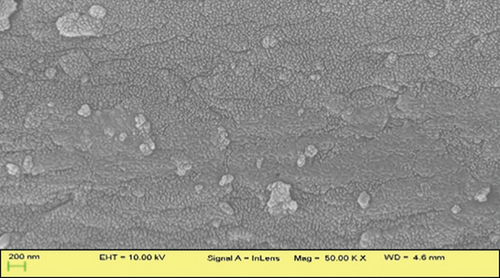
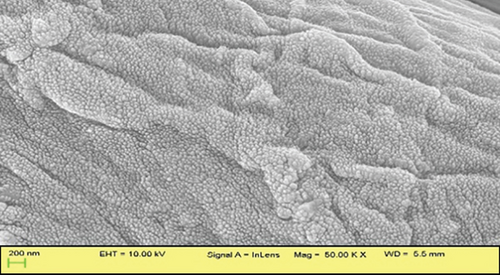
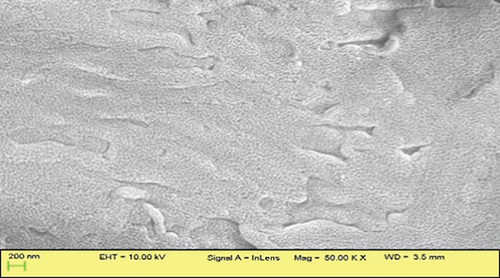
SEM images demonstrated distinct surface morphologies, highlighting the exceptional outcome of the CTAB treatment. The surface of JBT is covered with several ridges and fissures (Figure 5(a)); the surface of JCT is slightly smoother than that of JBT (Figure 5(b)); and the surface of JST is even more covered with ridges and fissures than that of JBT (Figure 5(c)), while in the case of RR-JST, the surface is found to be smoother than JST (Figure 5(d)). This correlates with the BET data in which the surface area of JST > JBT > JCT. The multipoint BET surface area of JBT, JCT, and JST were found to be 5.426, 1.987, and 9.303 m2/g, respectively. The surface area of an adsorbent is directly proportional to its adsorption capacity. The surface area of JST is greatest when compared to JBT and JCT which means that there is a maximum number of adsorbing sites in JST also evident from maximum ridges found on the surface of JST as observed in SEM analysis.
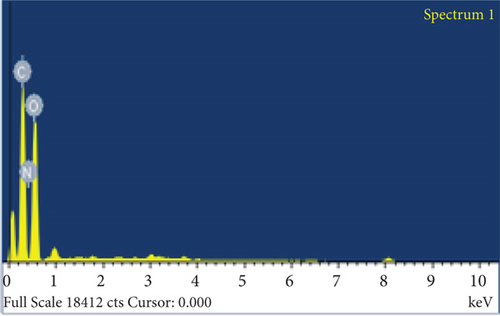
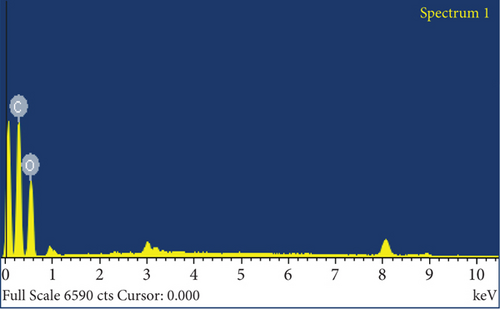
The elemental composition of JBT, JCT, JST, and RR-JST was examined using EDX analysis, which provided insight into molecular components on the fiber surfaces. The primary constituents of JBT and JCT were carbon and oxygen (Figures 6(a) and 6(b)). It is interesting to note that bromine was discovered on the surfaces of RR-JST (Figure 6(d)) and JST (Figure 6(c)), suggesting that molecules of cetyltrimethylammonium bromide were incorporated during the surfactant treatment. The outcome is in line with expectations because the modification included the use of CTAB, a surfactant containing bromide. Additionally, the RR-JST EDX analysis revealed elements that are typical of the RR dye, including sodium (Na), fluorine (F), and sulfur (S) (Figure 6(d)). The fact that the dye was effectively loaded onto the surfactant-modified bamboo fibres (BAT) surface enhances the material’s potential as a robust adsorbent for the dye removal from effluent.
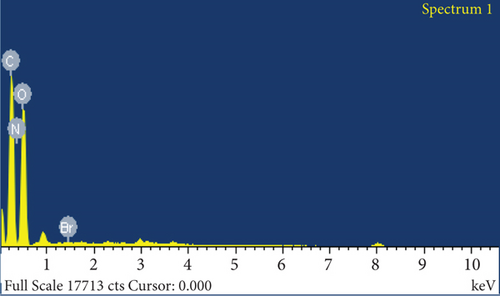
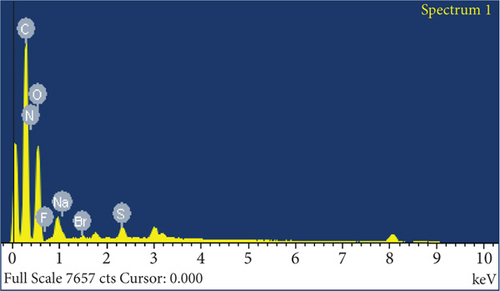
Taken together, a thorough grasp of the structural and compositional alterations caused by the dye loading and treatment of CTAB and caustic is provided by the EDX and SEM examinations. These changes not only show how effective JST is as an adsorbent but also pave the way for a detailed analysis of its adsorption capabilities and possible uses in environmentally friendly effluent treatment methods.
3.2.4. Thermogravimetric Analysis (TGA)
The thermal stability of RR-JST, JST, JCT, and JBT was thoroughly understood by the application of thermogravimetric analysis in a nitrogen atmosphere. The intricate processes of thermal degradation that occur in the JFs at various temperature ranges are depicted in Figure 7. The TGA curves at temperature ranges of 25–260°C, 260–380°C, and 380–550°C show three distinct phases of mass loss.
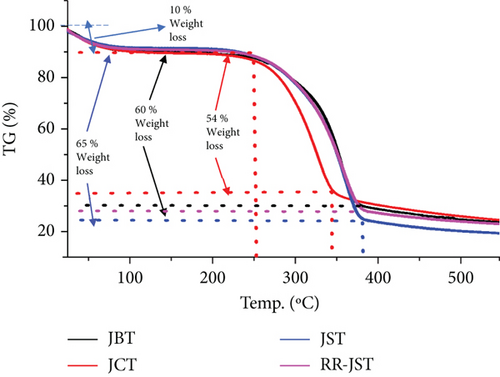
Every phase offers important information about the thermal properties of the substance and correlates to particular thermal phenomena.
The breakdown of chemical molecules of low molecular weight and the removal of water molecules from the absorbent are responsible for the mass loss of near about 10% that takes place during the first stage, which happens between 25°C and 260°C. For the four different varieties of JF—JBT, JCT, JST, and RR-JST—it is fairly comparable. This phase’s primary goal is to remove the moisture content from the materials.
There is a noticeable mass loss during the second phase, which lasts for JCT between 260 and 350°C with nearly 54% of mass loss. Whereas, for JBT, JST, and RR-JST between 260°C and 380°C, the mass loss was nearly 60%, 65%, and 60%, respectively. This suggests that the main hemicellulose skeleton found in JBT, JCT, JST, and RR-JST has degraded. The particular temperature range points to the hemicellulose components’ depolymerization, which explains thermal changes in JFs caused by the application of CTAB and caustic solutions. The third stage denotes additional breakdown and occurs between 350°C and 550°C for JCT and between 380°C and 550°C for JBT, JST, and RR-JST. The components of cellulose and lignin present in JBT, JCT, JST, and RR-JST have now broken down. The detailed disassembly process sheds light on the thermal stability of the materials at various temperatures. Together with a qualitative assessment of the thermal stability of JBT, JCT, JST, and RR-JST, the TGA analysis provides quantitative data on the mass loss at various temperature intervals. Understanding the thermal behavior is critical to evaluating the performance of the materials under various environmental conditions, especially in future applications where thermal treatment or exposure to high temperatures is involved. The multiple-phase mass loss observed in the TGA curves contributes to a deeper comprehension of the internal thermal dynamics of the JFs, enhancing our knowledge of their stability and suitability for a range of applications.
3.2.5. The BET Analysis
The pore volume, surface area, and pore Dv(d) diameter determined from the Barrett–Joyner–Halenda (BJH) method of desorption, total pore volume data, average pore diameter data for JBT, JCT, and JST, as well as the multipoint BET surface area (obtained from the multipoint BET plot), t-plot micropore volume, t-plot micropore area, external surface area (obtained from t-plot method micropore analysis), and Langmuir surface area (obtained from the Langmuir plot), are provided in Table 1.
| Sample | Multipoint BET surface area (m2/g) | t-plot method micropore analysis | Langmuir surface area obtained from Langmuir plot (m2/g) | BJH method desorption | Average pore size data | ||||
|---|---|---|---|---|---|---|---|---|---|
| t-plot micropore volume (cm3/g) | t-plot micropore area (m2/g) | External surface area (m2/g) | |||||||
| Surface area (m2/g) | Pore volume (cm3/g) | Pore diameter dv(d) (nm) | Average pore diameter (nm) | ||||||
| JBT | 5.426 | −0.001 | 0.449 | 4.976 | 25.485 | 7.389 | 0.007 | 1.818 | 3.53066 |
| JCT | 1.987 | −0.000 | 0.174 | 1.812 | 0.000 | 4.183 | 0.007 | 1.800 | 1.11518 |
| JST | 9.303 | −0.002 | 0.203 | 9.100 | 168.565 | 10.983 | 0.010 | 1.813 | 3.45615 |
The BET data for JBT, JCT, and JST are thoroughly analyzed in Table 1. These results provide important new information about the JFs’ adsorption qualities and surface characteristics.
First, JST has the largest surface area at 9.303 m2/g in the multipoint BET surface area, which combines the external surface area and the t-plot micropore area. This is a significant increase over JBT (5.426 m2/g) and JCT (1.987 m2/g). This shows that the JFs’ surface area is increased by the surfactant treatment, which may increase their ability to adsorb substances. The Langmuir surface area, which denotes the maximum adsorption capacity in perfect circumstances, also exhibits a comparable pattern. At 168.565 m2/g, JST exhibits the largest Langmuir surface area, suggesting a higher adsorption capacity than JBT (25.485 m2/g) and JCT (0.000 m2/g). Additionally, the average pore diameter of JBT is 3.53066 nm, while JST and JCT have average pore diameters of 3.45615 and 1.11518 nm, respectively, according to the analysis of average pore size data. This implies that the JCTs’ pore size may increase as a result of the surfactant treatment, possibly increasing the molecules of adsorbate that can bind to them.
Regarding the surface area derived from the BJH desorption technique, JST exhibits the greatest value at 10.983 m2/g, succeeded by JBT at 7.389 m2/g and JCT at 4.183 m2/g. Last but not least, the pore volume data show that JST has the largest pore volume at 0.010 cm3/g, which suggests that it can hold more adsorbate molecules in its pores than JBT and JCT, which both have pore volumes of 0.007 cm3/g. Overall, the BET analysis data highlight how the surfactant treatment significantly increased the surface area, adsorption capacity, and pore characteristics of JFs, making them more appropriate for a range of adsorption applications.
3.3. The Impact of Dosage of Adsorbent
RR dye removal efficiency was examined in relation to adsorbent dosage. The variation in dye removal efficiency with varying dosages of JBT, JCT, and JST, three different types of JFs, is shown in Figure 8.
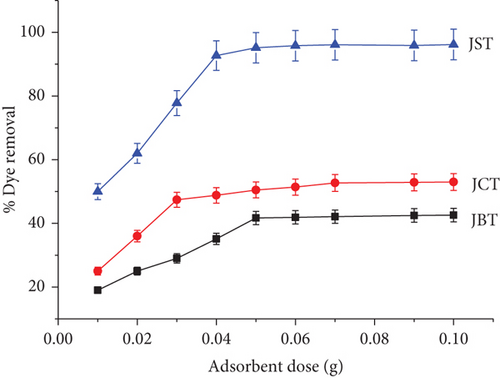
The graph clearly shows that when 0.05 g of adsorbent JST is used to treat a 50-mL solution containing 40 mg/L of RR dye, the percentage removal of dye achieves its maximum of roughly 95%.
This finding emphasizes how important adsorbent dosage is to the process of removing dye. Beyond this threshold, raising the dosage may not result in a corresponding rise in dye removal efficiency. On the other hand, if fewer dosages are used, there may be insufficient adsorption sites on the adsorbent surface, which could lead to incomplete dye removal.
The results highlight how crucial it is to optimize adsorbent dosage in order to achieve the highest possible dye removal efficiency while maintaining resource efficiency and cost effectiveness. Furthermore, JST outperforms JBT and JCT, highlighting the efficacy of surfactant treatment in augmenting JF adsorption capacity for the removal of reactive dye RR dye.
3.4. Impact of pH
The impact of pH on the adsorption of RR onto JST was examined in order to comprehend the interaction between the charge on the surface of the adsorbent and the dye solution’s chemistry. Figure 9 presents the results of this study.
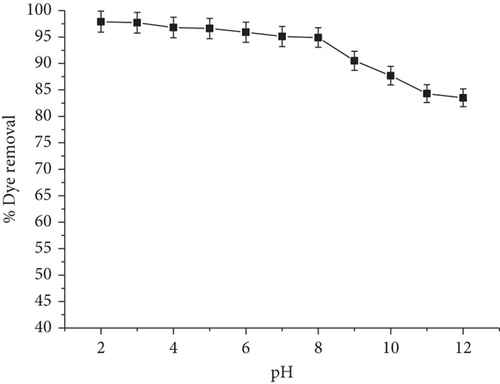
The graph, which uses 0.05 g of adsorbent per 50 mL of dye solution and a constant initial concentration of 40 mg/L of dye solution at 298 K, shows how the pH levels affect the percentage removal of dye. The graph’s observations show that when the pH drops from 12 to 2, the percentage removal of dye progressively rises. On the other hand, as the pH increases from 2 to 12, the proportion of dye elimination progressively drops.
The impact of pH on the adsorbent’s surface charge is responsible for this phenomenon. At lower pH levels, due to the increased positive charge on the surface of the adsorbent, the anionic dye molecules’ electrostatic attraction is enhanced [108]. Increased dye removal efficiency is the result. On the other hand, the adsorbent surface’s positive charge decreases with increasing pH, which reduces electrostatic interaction between the adsorbent and the dye molecules. Thus, the dye removal efficiency decreases [109].
The significance of pH optimization in optimizing dye removal efficiency is highlighted by these findings. Good, strong electrostatic interaction between the adsorbent surface and dye molecules is ensured by maintaining a proper pH level, which increases the adsorption capacity.
3.5. The Impact of Contact Duration
Using three different types of JFs—JBT, JCT, and JST—the impact of contact time on the RR dye removal percentage from its aqueous solution (40 mg/L) was investigated. Figure 10 presents the findings. The graph shows how, at a constant 40 mg/L concentration of dye solution and 0.05 g/50 mL of adsorbent dosage at 298 K, the percentage removal of dye varies across various durations of contact.
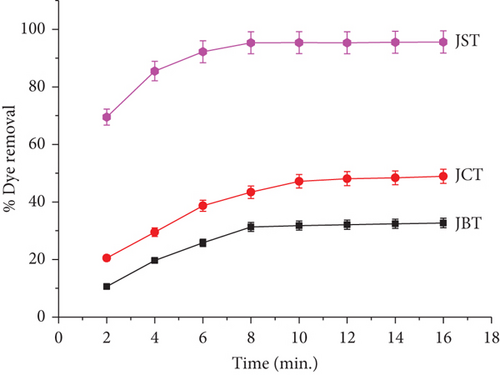
With an extended contact time between 2 and 16 min, the graph clearly demonstrates a rise in the dye removal percentage. Remarkably, more than 80% of the dye is eliminated in a contact time of just 8 min, demonstrating the quick rate of removal of RR dye.
This result implies that saturation or equilibrium is reached by the adsorption process at a comparatively short contact time and that an additional increase in contact time only slightly increases the efficacy of the removal of dye. Initially, during the contact process, there were plenty of sites available for adsorption on the surface of the adsorbent, this is why removal of dye increased quickly at first. These results highlight how crucial it is to maximize contact time in order to remove dye as effectively as possible. Shorter contact times could lead to partial dye removal, but excessively long contact times might not improve the adsorption capacity much after a certain point. So, for effective dye removal with JFs acting as adsorbents, knowing the adsorption process’s kinetics and figuring out an optimum contact time is essential.
3.6. The Effect of Initial Concentration of Dye
To illuminate the dynamic interactions affecting the adsorption phenomenon, Figure 11 investigates the intricate connection between the amount absorbed and the starting concentration of RR dye. This study uses JST to investigate the effects on dye adsorption (milligrams per gram) of a wide range of starting dye concentrations, from 20 to 100 mg/L. By visualizing the changing relationship between the adsorption of dye and different initial concentrations of dye, this graph offers crucial insights into the concepts that are involved in the process of adsorption. Figure 11 reveals a proportionate connection between the amount of dye adsorbed on adsorbent JST and the starting dye concentration. The quantity of dye that the adsorbent absorbs increases together with the initial dye concentration, which goes from 20 to 100 mg/L. The noticed correlation is based on the concepts of diffusion and concentration gradients. An increase in the initial dye concentration is correlated with an increased migration of dye molecules from the solution onto the adsorbent JST surface.
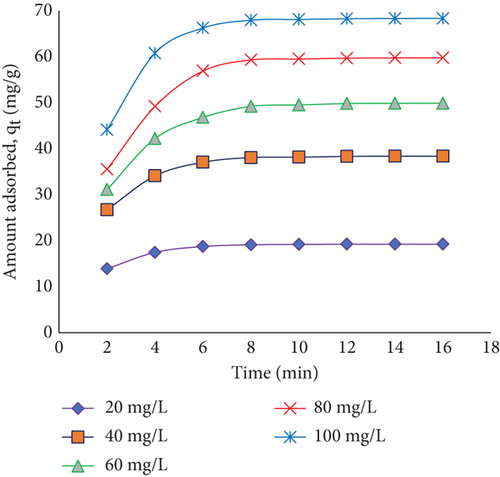
The gradient of concentration that develops between the adsorbent JST and the dye solution is what causes this phenomenon because it strengthens the force that drives the adsorption process. Strong inducers such as concentration gradients force more dye molecules in the direction of the adsorbent surface. JST’s adsorption capacity is, therefore, maximized by increasing the initial dye concentrations.
Understanding the influence of the initial concentration of dye is important for optimizing adsorption systems, especially when various concentrations of dye are utilized in practical applications. The aforementioned findings offer a more obscure comprehension of the dynamics influenced by the concentration, which will aid in the creation of productive as well as adaptable adsorption processes for the treatment of textile effluents.
3.7. Kinetic Study of Adsorption
Adsorption kinetics constitutes one of the foremost important factors in figuring out the mechanism of adsorption and how well an adsorbent absorbs the adsorbate. In this study, pseudo-first-order and pseudo-second-order models were used to evaluate the adsorption nature, effectiveness, and adsorption rate for the system. Based on R2 value and a comparison between the experimental value of qe and the calculated value of qe, the best model was selected.
3.7.1. The Pseudo-First-Order Kinetic Model
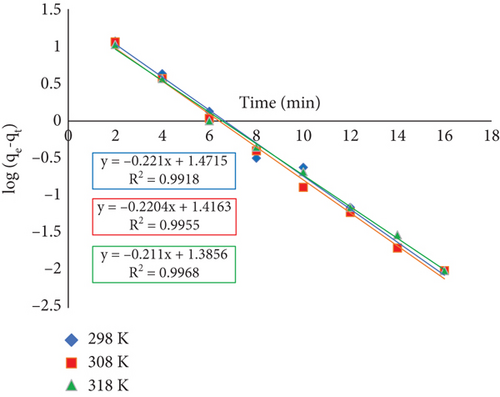
Table 2 illustrates how the calculated and experimental qe values obtained from the pseudo-first-order plot differ substantially, even though the value of R2 obtained from the pseudo-first-order plot is significant. These results highlight the limitations of the pseudo-first-order model in explaining the adsorption process kinetics, and they encourage the development of other models to clarify the dynamic nature of the adsorption of RR dye onto JST.
| Temperature (K) | Pseudo-first-order kinetic model | Pseudo-second-order kinetic model | ||||||
|---|---|---|---|---|---|---|---|---|
| Qe (exp) (mg/g) | Qe (cal) (mg/g) | K1 (min−1) | R2 | Qe (exp) (mg/g) |
Qe (cal) (mg/g) | K2 (gmg−1 min−1) | R2 | |
| 298 | 38.4 | 29.61 | 0.509 | 0.992 | 38.4 | 40.65 | 0.033 | 0.999 |
| 308 | 38.6 | 26.08 | 0.508 | 0.996 | 38.6 | 40.65 | 0.036 | 0.999 |
| 318 | 38.8 | 24.3 | 0.486 | 0.997 | 38.8 | 40.65 | 0.039 | 0.999 |
3.7.2. Pseudo-Second Order Kinetic Model
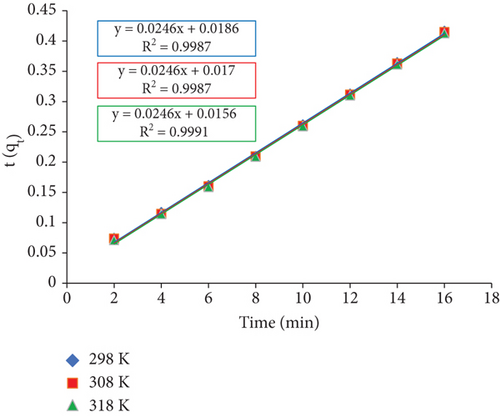
The results of this analysis provide validity to the assumption that the kinetic model of pseudo-second order describes adsorption. The high values of R2, which roughly equal 1, and a significant concordance between the calculated and experimental values of qe make this clear (shown in Table 2). This demonstrates unquestionably how well the adsorption of RR dye onto JST is fitted by the pseudo-second-order kinetic model, offering a better insight into the adsorption process’s dynamic nature.
3.7.3. The Intraparticle Diffusion Model
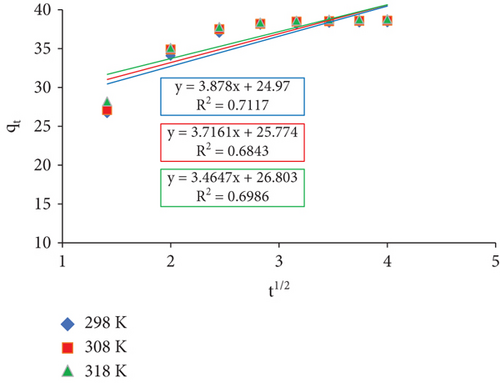
Plotting qt versus t1/2 should show a straight line crossing the origin if the sole step that limits the rate of adsorption is intraparticle diffusion.
The rate constants ki and Ci (milligrams per gram) are determined by calculating the slope and intercept of the regression line, respectively. The boundary layer’s thickness is indicated by a value of C. According to Table 3, a greater C value denotes a larger influence of the boundary layer.
| Temperature (K) | Ci | Ki | R2 |
|---|---|---|---|
| 298 | 24.97 | 3.878 | 0.712 |
| 308 | 25.774 | 3.716 | 0.684 |
| 318 | 26.803 | 3.465 | 0.699 |
The graph (Figure 14) shows that the plots of qt against t1/2 show less boundary layer control since they do not cross the origin. It also suggests that intraparticle diffusion could not be the only stage that limits the rate of diffusion, but rather a combination of other processes. The increased temperature causes the boundary layer impact to increase, as the C values illustrate.
3.7.4. Boyd Plot
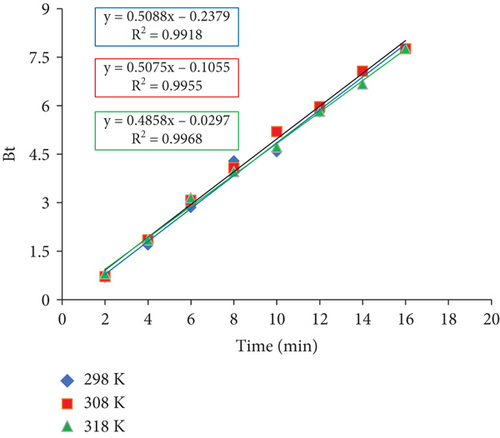
Using the Bt versus time (t) plot, the adsorption rate for particle diffusion and film diffusion was computed (Figure 14). Adsorption is considered to be controlled by a particle diffusion pathway (the movement of the adsorbate inside the pores of an adsorbent) or otherwise by a film diffusion mechanism (the movement of the adsorbate onto the adsorbent’s surface) if the Bt versus t plot produces a straight line that crosses the origin. The plot of Bt versus t plot as shown in Figure 15 illustrates that the adsorption of RR dye on JST follows a film diffusion mechanism because it does not pass through the origin.
3.7.5. Elovich Model
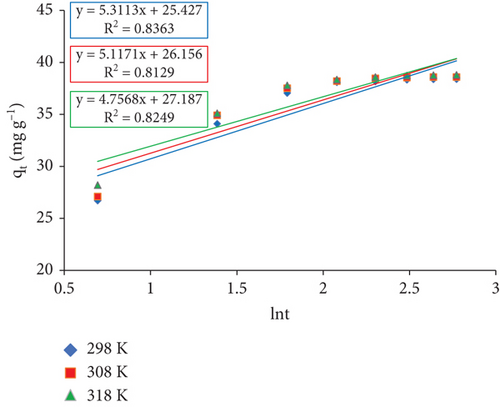
| Temperature (K) | α | β | R2 |
|---|---|---|---|
| 298 | 637.259 | 0.188 | 0.84 |
| 308 | 849.015 | 0.195 | 0.81 |
| 318 | 1443.711 | 0.210 | 0.82 |
3.7.6. Bangham’s Model
Here, qt, expressed in milligrams per gram, represents the quantity of dye adsorbed on adsorbent at time t. The values of constants ko and B(<1) are given in Table 5. Co and V represent the initial concentration and volume of dye in solution, expressed in milligrams per liter and milliliters, respectively. m is the amount of adsorbent used per liter of dye solution (grams per liter). It was discovered that as temperature increased, the values of constant B slightly decreased.
| Temperature (K) | B | K0 | R2 |
|---|---|---|---|
| 298 | 0.5117 | 45.036 | 0.90 |
| 308 | 0.5105 | 47.257 | 0.89 |
| 318 | 0.5005 | 50.172 | 0.90 |
As per Equation (12), the double logarithmic plot failed to generate appropriate linear plots regarding the RR dye adsorption onto JST. This demonstrates that there were other rate-controlling steps besides adsorbent diffusion into the sorbent’s pores (Figure 17). Therefore, while employing JST as an adsorbent, both the pore and film diffusion mechanisms might be involved in the adsorption of RR dye molecules, albeit to different degrees.
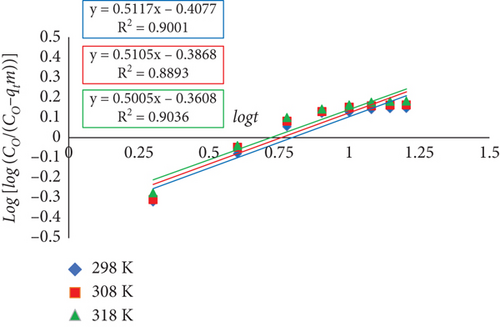
When the results obtained from various kinetic models are compared, the chemisorption of RR dye on JST is suggested by pseudo-second-order model with a significant R2 value. The intraparticle diffusion plot of qt versus t1/2 is not passing through the origin with the nonsignificant value of R2, suggesting that the intraparticle diffusion could not be the only stage that limits the rate of diffusion, rather it would be containing a combination of other processes. The Boyd plot with significant R2 value further supports the result obtained from the intraparticle diffusion model, as the Bt versus t plot is not passing through the origin illustrating that the adsorption of RR dye on JST follows a film diffusion mechanism rather than particle diffusion mechanism. As the Elovich model did not have a significant R2 value (R2 = 0.81 to 0.83) at all temperatures, it is recommended that the adsorption of the dye on JST was not controlled by chemisorption. The double logarithmic plot of the Bangham model failed to generate appropriate linear plots regarding the adsorption of the dye onto JST, which further supported that pore diffusion was not the rate-controlling step; rather, there might be a film diffusion mechanism involved in the adsorption process.
3.8. The Adsorption Isotherms
An adsorption isotherm is frequently used to understand the interactions between adsorbent and adsorbate molecules during the process of adsorption. A valuable graphic that describes the adsorption process is the adsorption isotherm. It explains the mechanism, process, and efficacy of adsorption. We can figure out which model the real adsorption isotherm follows by comparing the correlation coefficient or the degree of similarity between the experimental data and the adsorption model. As a result, a precise mathematical representation of an adsorption isotherm can aid in our understanding of the adsorption capacity and the characteristics of the adsorbents.
3.8.1. The Langmuir Isotherm
Langmuir adsorption isotherm assumes that the molecules of the adsorbate adhere to the adsorbent’s surface in a monolayer. Adsorbate adsorption occurs at a specific site irrespective of the presence of adsorbate at adjacent sites. Langmuir’s model, which neglects the variation in the adsorption energy, is the most widely accepted and simple description of the adsorption process.
| Temperature (K) | Novacron Red FN-2BL concentration (mg/L) | RL | KL (L/mg) | Qm (mg/g) | R2 |
|---|---|---|---|---|---|
| 298 K | 20 | 0.11 | 0.389 | 70.92 | 0.989 |
| 40 | 0.06 | ||||
| 60 | 0.04 | ||||
| 80 | 0.03 | ||||
| 100 | 0.03 | ||||
| 308 K | 20 | 0.10 | 0.432 | 72.99 | 0.989 |
| 40 | 0.05 | ||||
| 60 | 0.04 | ||||
| 80 | 0.03 | ||||
| 100 | 0.02 | ||||
| 318 K | 20 | 0.08 | 0.575 | 74.63 | 0.994 |
| 40 | 0.04 | ||||
| 60 | 0.03 | ||||
| 80 | 0.02 | ||||
| 100 | 0.02 | ||||
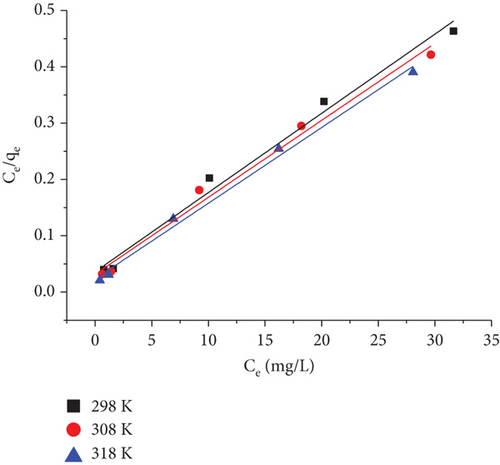
Initially, the dye concentration is represented by Co, expressed in milligrams per liter. The value of parameter RL, as shown in Table 7, reflects the nature of the adsorption process.
| RL value | Type of adsorption |
|---|---|
| 0 < RL < 1 | Favorable adsorption |
| RL = 0 | Irreversible adsorption |
| RL > 1 | Unfavorable adsorption |
| RL = 1 | Linear adsorption |
Table 6 displays the results, which indicate that as the temperature has increased, so have the values of qm as well as KL. This could be addressed by the dye’s increased kinetic energy with rising temperature, boosting the mobility of the dye ions. As a result, there was a higher chance that the dye would be adsorbed on the surface of the adsorbent, which raised its qm.
The obtained separation factor values, RL, vary from 0.02 to 0.11, indicating the favorability of the current adsorption technique.
3.8.2. The Freundlich Isotherm
The Freundlich isotherm model is an empirical equation that describes the surface heterogeneity of the adsorbent. Additionally, the model represented an uneven adsorption surface with different adsorption energies and unevenly accessible sites [118].
| Temperature (K) | KF (mg g−1) (L mg −1)1/n | n | R2 |
|---|---|---|---|
| 298 | 25.61 | 3.434 | 0.88 |
| 308 | 27.08 | 3.447 | 0.90 |
| 318 | 29.77 | 3.551 | 0.93 |
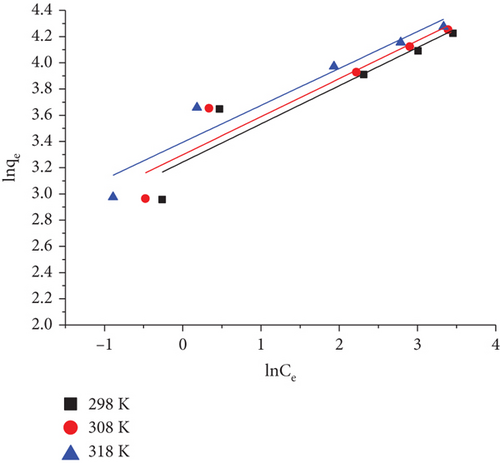
Good adsorption conditions are indicated by values of n greater than 1. The KF values rose as the temperature increased, indicating that this adsorbent was more effective at removing RR dye on increasing temperature from 298 to 308 K. Furthermore, for RR dye adsorption, both the KF (obtained from D-R isotherm) and qm (obtained from Langmuir isotherm) increase with increase in temperature.
3.8.3. The Temkin Isotherm
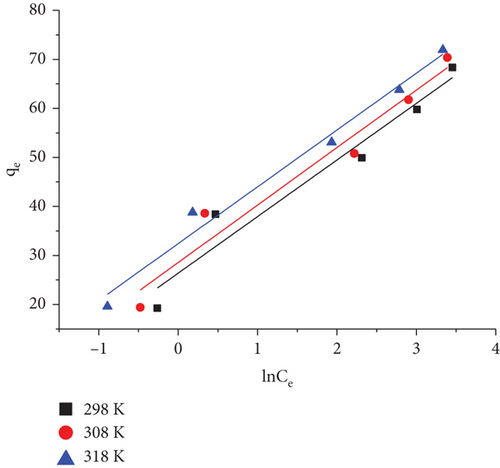
The impact of the indirect interaction between adsorbate and adsorbent on the process of adsorption is taken into account by the Temkin isotherm model. Because of this adsorbate–adsorbent interaction, as the adsorbent’s surface coverage increases, the heat of adsorption of each molecule in a layer reduces linearly. Despite what the Freundlich isotherm suggests, the decline in heat of adsorption follows linearity rather than logarithmic. In addition, a uniform spread of binding energies till the maximum binding energy is obtained characterizes the adsorption [119, 120].
It is possible to determine the constants, B1 and kT, given in Table 9 from the plot of qe versus ln Ce as shown in Figure 20, where the equilibrium binding constant, or kT (liters per milligram), is a function of the maximum binding energy and the heat of adsorption is represented by B1 [119]. T stands for absolute temperature (K), and R represents gas constant.
| Temperature (K) | KT (L/mg) | B1 | R2 |
|---|---|---|---|
| 298 | 9.838 | 11.544 | 0.95 |
| 308 | 11.421 | 11.725 | 0.96 |
| 318 | 16.402 | 11.588 | 0.98 |
3.8.4. The Dubinin and Radushkevich (D–R) Isotherm
D–R linear plot of lnqe versus ε2 for RR dye onto JST at various temperatures is given in Figure 21.
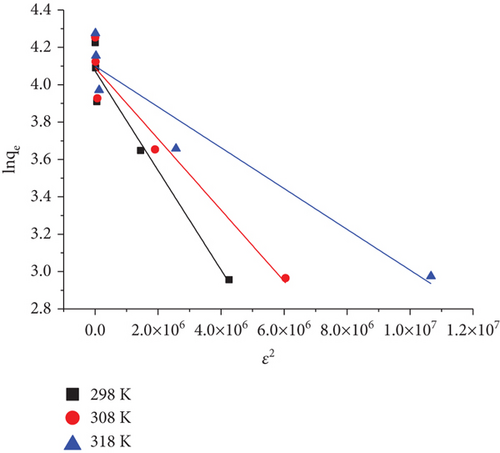
The values of qs (milligrams per gram) and B are obtained by plotting ln qe versus ε2 (Figure 21) and determining its intercept and slope. The constant qs (milligrams per gram) indicates the maximum quantity of adsorbate that could be absorbed by an adsorbent whereas, The constant B represents the mean free energy (E) of adsorption for each molecule of adsorbate while it is transported from the main solution to the solid surface. The D–R constants that were computed for the adsorption of RR on JST at various temperatures are shown in Table 10. The adsorption type —chemisorption or physisorption, can be inferred from the value of E computed from the D–R isotherm. When it comes to physisorption, E’s value ranges from 1 to 8 KJ/mol, while chemisorption is defined as a value greater than 8 KJ/mol. According to the present system’s E value, the dye RR adsorption on JST is solely physical. Table 10 displays the values of the constants. The maximum amount absorbed by a single layer on the surface of an adsorbent is represented by qm in the Langmuir model of absorption, while in the D–R model, the maximum uptake resulting from pore filling instead of monolayer adsorption is indicated by qs. In comparison to the D–R model (qs = 60.33 mg/g), JST’s maximum adsorption capacity for RR dye (qm = 74.63 mg/g) at 318 K was found to be higher, suggesting that JST has a significant number of active sites. Because of this, these two quantities are fundamentally different, which accounts for the disparate values found when the two models are fitted to the experimental data. It appears that the D–R model seems less appropriate to explain our results because the Langmuir model matches with our data better [102].
| Temperature (K) | Qs (mg/g) | E (KJ/Mol) | R2 |
|---|---|---|---|
| 298 | 58.76 | 1.29 | 0.95 |
| 308 | 59.81 | 1.58 | 0.95 |
| 318 | 60.33 | 2.24 | 0.93 |
3.9. Thermodynamics of Adsorption

| Temperature (K) | ΔG∗ (KJ/mol) | ΔH∗ (KJ/mol) | ΔS∗ (J/mol/K) |
|---|---|---|---|
| 298 | −7.87 | 11.73 | 65.74 |
| 308 | −8.49 | ||
| 318 | −9.19 |
Given that ΔH∗ is positive, the adsorption process is endothermic. The indication of the sorption type may also be provided by the value of ΔH∗. While the heat released in the chemisorption typically falls between 80 and 200 KJ/mol, the heat released during physical adsorption is equivalent in intensity to the heat released during condensation, thus falling between 2.1 and 20.9 KJ/mol. Thus, Table 11 suggests that a physical adsorption process is likely responsible for this adsorption [127, 128].
When ΔS∗ value is positive, it signifies that the adsorption process is driven by entropy. A positive entropy change (ΔS∗) value throughout the adsorption process denotes increased disorder along the solid/liquid interface [129].
3.10. Mechanism of Adsorption
Characterization, kinetics, and isotherm analysis provide the foundation for the mechanism of RR dye adsorption on JST (Figure 23). The adsorption mechanism is proposed also by comparing the FTIR spectra of JST (adsorbent) and RR-JST (dye-loaded adsorbent) (Figure 3). When RR dye was adsorbed on JST, the FTIR revealed that all of the bands’ intensities decreased (observed in the case of RR-JST). A prominent band at 3335 cm−1 corresponding to the O-H group of lignin, hemicellulose, and cellulose of JFs in JST loses its sharpness after the adsorption of RR on JST (in the case of RR-JST), showing the participation of these bonds in the adsorption. The stretching vibration of C-H groups almost completely disappears in the case of RR-JST in comparison to JST (appearing at 2916 cm−1 and 2844 cm−1) corresponding to the major C-H vibrations of the aldehyde group. The study’s pseudo-second-order kinetic model demonstrates that the chemisorption type mechanism might be adopted for the adsorption of RR dye on JST (Figure 13).
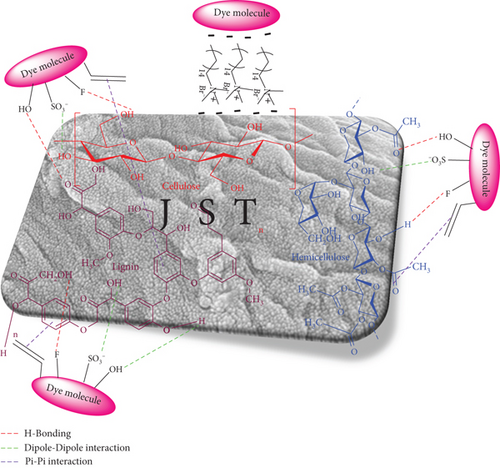
The Langmuir adsorption isotherm was used to confirm that JST and RR dye exhibited homogenous adsorption (Figure 18). E obtained from the D–R isotherm varied between 1.29 and 2.24 KJ/mol, which corresponds to physisorption (as the value of E lies between 1 and 8 KJ/mol), indicating that the RR dye is physically adsorbing on JST. Previous studies have demonstrated that both processes—chemical and physical adsorption, for example—exist concurrently or synchronously [130].
3.11. Removal of Dye Using Real Synthetic Effluents
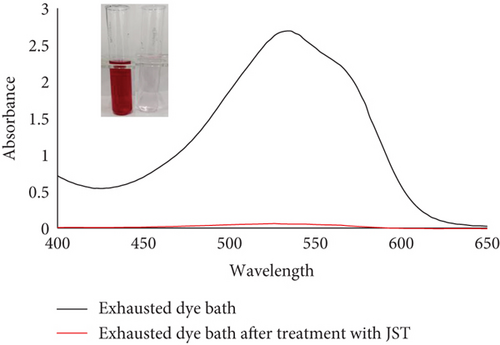
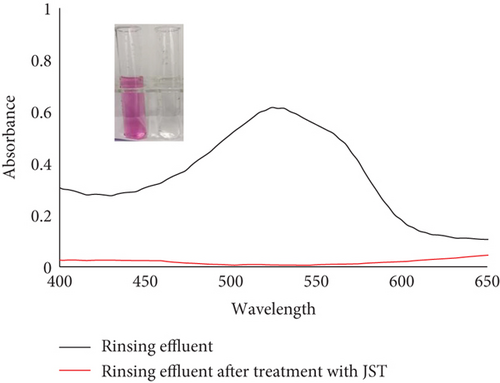
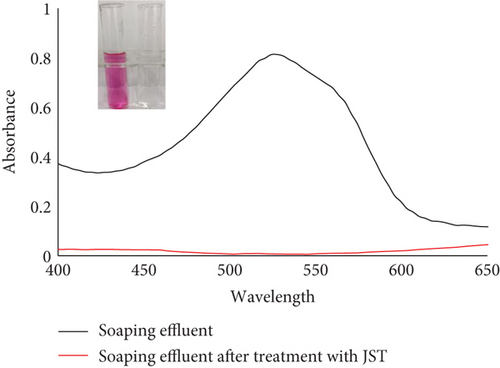
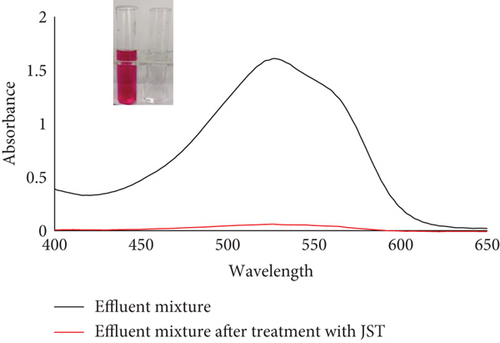
JST worked well to remove the dye RR from an aqueous solution, as demonstrated by the adsorption equilibrium and kinetic data, suggesting that this could also be used to remove dye from real effluents. The actual effluent for this was produced in a lab. The dyeing bath for cotton substrate was prepared in order to create the actual synthetic textile effluent on a laboratory scale. Using RR dye, the shade percentage was measured at 1% [131]. Nonionic detergent was also used to soap the colored substrate. Four stages of the effluent collection process were as follows: (a) effluent of the exhausted dye bath, (b) effluent of the rinsing bath, (c) effluent of the soaping bath, and (d) effluent of the mixture of all three baths.
UV-vis spectra of treated and untreated effluent were utilized to determine the percentage removal of dye (Figure 24). According to the absorbance study, utilizing JST as an adsorbent allowed for the removal of approximately 95% of dye from the synthetic effluent.
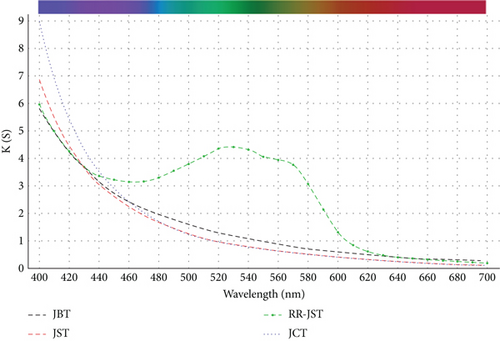
Datacolor 200 M was also used to obtain the color fastness, K/S values, light fastness, and color images of the absorbent having dye adsorbed on it (given in Tables 12 and 13). Figure 25 displays the K/S versus wavelength plot for JBT, JCT, JST, and RR-JST that was acquired from Datacolor 200 M.
| S. No. | Adsorbent used | Shade obtained | K/S values at 524 nm |
|---|---|---|---|
| 1 | JBT |  |
1.1 |
| 2 | JCT |  |
0.9 |
| 3 | JST |  |
0.9 |
| 4 | RR-JST |  |
4.4 |
| Sample | Change in color | Color staining | Light fastness | |||||
|---|---|---|---|---|---|---|---|---|
| SCA | BUC | N | P | A | WW | |||
| RR-JST | 4–5 | 4–5 | 4 | 4 | 4–5 | 4–5 | 4 | 4–5 |
3.12. The Factors Controlling the Cost of RR Dye Adsorption on JST
To guarantee the long-term sustainability of the recommended dye removal method, the estimated total execution cost needs to be ascertained. In addition to the dye removal procedure, the total cost of execution was computed. Because of the low chemical usage and low cost of the adsorbent, it is found that the execution cost is insignificant [132].
- i.
Cost of adsorbent (A)
- ii.
The cost of processing (B)
- iii.
Cost of batch operations (C)
Every batch operation (dye removal) requires constant stirring. It takes 8 min to run a single batch; thus, very little electrical energy is needed. This step costs approximately ₹1.45 for every liter of dye solution.
Hence, the overall cost of execution = cost of adsorbent (A) + the cost of processing (B) + cost of batch operations (C) = Rs. (0.0045 + 0.256 + 0.0542 + 2.08 + 1.45) for 1 L of dye solution = ₹3.845 for 1 L of dye solution.
The most favorable aspect of the total execution cost that was determined was that the value of the processing and batch operation costs would not significantly increase as the amount of dye solution (to be treated) increased. There will be a minimal increase in the cost of the absorbent.
3.13. Comparison Between This Adsorbent and Other Lignocellulosic Fiber-Based Adsorbents
The adsorption capabilities of JST for the dye Novacron Red FN-2BL are compared to the efficacies for different lignocellulosic fiber-based materials that have already been reported previously as an adsorbent for removing various dyes in Table 14. The adsorption capacity of JST for RR dye is greater than that of all other lignocellulose-based adsorbents, including sodium periodate–oxidized JFs [97], polyphenolic tannin–modified JFs [96], NaOH-modified JFs [92–94], and sodium carbonate–modified JFs [95]. Additionally, maximum of the reported works’ applied modifications is either overly expensive or overly complicated. Furthermore, pyrolysis at high temperatures or treatments with potent reducing agents were implemented in some of them, which raised concerns about the adsorbent’s cost-effectiveness. Comparing our study to other lignocellulosic-based adsorbents, we have also used the least amount of adsorbent. Recently, we had developed a bamboo fiber–based adsorbent and used it for removing Reactive Blue 235 dye [133]. But the adsorption capacity of adsorbent JST in the present study is very much greater than our previously reported adsorbent that was BAT [133]. The reason behind this might be a very high surface area of JST in comparison to BAT as determined using BET analysis. Also, the RR dye might be getting more easily adsorbed than the Reactive Blue 235 dye. The current study uses a very basic caustic treatment (in mild conditions) followed by a surfactant treatment; however, our work is made more environmentally friendly by using dye-loaded adsorbent in a variety of utility items.
| S. No. | Adsorbent used | Amount of adsorbent used (g/L) | Dye used | Initial concentration of dye solution (mg/L) | pH | Contact time (minutes) | Qm (mg/g) | References |
|---|---|---|---|---|---|---|---|---|
| 1. | NaIO4-oxidized jute fibers | 3 | Congo red | 50 | 10 | 330 | 8.493 | [97] |
| 2. | NaOH-modified jute fibers | 14.524 | Congo red | 150 | 7.20 | N/A | 33.69 | [93] |
| 3. | NaOH-modified jute fibers | 16 | Congo red | 150 | 7.0 | N/A | 32.24 | [92] |
| 4. | NaOH-modified jute fibers | 14.905 | Reactive red 195 | N/A | 7.047 | N/A | 32.2 | [94] |
| 5. | Na2CO3-treated jute fibers | 14.74 | Methyl red | 150 | 7.0 | 120 | 32.11 | [95] |
| 6. | Polyphenolic tannin-modified jute fibers | 10 | Congo red | 250 | 6.2 | 50 | ~22.5 | [96] |
| 7. | CTAB-treated bamboo fibers | 10 | Reactive Blue 235 | 40 | 6.0 | 40 | 7.39 | [133] |
| 8. | JST | 1 | Novacron Red FN-2BL dye | 40 | 7.0 | 8 | 74.63 | Present study |
4. Conclusions
Our research concludes that the use of locally collected waste JF, further modified by treating it with NaOH and then treating it with CTAB, is a compelling and environmentally friendly solution for treating effluent that contains the dye RR. This strategy supports the recycling of regional waste materials in addition to tackling effluent pollution, which is consistent with the values of protecting the environment and sustainability. Our research advances the change of direction in the field of environmental preservation through environmentally conscious techniques by utilizing indigenous assets. We have developed a thorough understanding of the chemical and structural attributes of the adsorbent JST using characterization techniques including FTIR, SEM, BET, Powder-XRD, pHZPC analysis, and TGA analysis.
In continuation to our previous research where Novacron Blue FNR dye was removed using modified bamboo fibers, here in this case, we have taken waste JFs, modified it, and then used it as an adsorbent for removing RR dye. The adsorption capacity of the present adsorbent, JST, was found to be approximately 10 times greater than that of previously reported bamboo adsorbent, BAT for Novacron Blue dye. This might be because of a quite high surface area of JST in comparison to BAT as obtained from BET analysis. It was found that pH had a significant influence, with lower pH levels favouring dye removal. It could be a result of the dye molecule’s (anionic) higher electrostatic attraction to the adsorbent surface (positively charged), developed at lower levels of pH. The pseudo-second-order as well as Langmuir adsorption models provided the most accurate explanation of the adsorption mechanism, with a maximum adsorption capacity of 74.63 mg/g at 318 K. Additional proof of the favorable aspects of the adsorption process is provided by the values of RL discovered using the Langmuir isotherm equation.
The value of E, which varied from 1.29 KJ/mol to 2.24 KJ/mol, derived from the D–R isotherm model validated the physicochemical character of the adsorption phenomena.
Furthermore, the values of ΔG∗ at all temperatures being negative revealed that the adsorption process was spontaneous, whereas the positive value of ΔS∗ suggested that the process was driven by entropy.
Overall, the findings point to the JST adsorbent as an appealing option for treating textile effluent and providing a workable way to reduce dye pollution in wastewater streams.
Conflicts of Interest
The authors declare no conflicts of interest.
Author Contributions
Samriti Vaid: conceptualization, visualization, methodology, writing–original draft. Varinder Kaur: supervision, conceptualization, methodology, writing–review and editing, resources mobilization including funding. Sanyog Sharma: material preparation, editing, methodology, characterization, data analysis. Raj Kumar Arya: conceptualization, methodology, review and editing, characterization. Bharat Bajaj: methodology, data collection and analysis and characterization. Bhavna Vaid: methodology and characterization. George D. Verros: conceptualization, methodology, and characterization. Devyani Thapliyal: methodology and characterization. The final manuscript was read and approved by all writers.
Funding
We acknowledge the DST-SERB Power Grant (DST No: SPG/2021/000857) for its support and are appreciative of the financial support from DST for a Woman Scientist Fellowship (File No. DST/WOS-A/CS-64/2021).
Open Research
Data Availability Statement
The data that support the findings of this study are available from the corresponding author upon reasonable request.


