Frequency Characteristics Analysis of Wind–Storage Joint Frequency Regulation System Taking Into Account the State of Storage Battery
Abstract
With the adjustment of the global energy structure, the power system under the penetration of new energy has developed rapidly. In response to the frequency security issues brought by new energy to the power system and the influence of the state of energy storage batteries on the system frequency, this paper constructs a frequency response model for wind–storage joint frequency regulation to analyze the frequency characteristics of the power system under different operating conditions. On this basis, considering the influence of the state of energy storage batteries on the system frequency, a system model under the scenario of additional load disturbance is built; the influence of environmental temperature on the state of energy storage batteries is analyzed to explore the changes in system frequency under high- and low-temperature conditions; finally, the robustness of the system frequency model under different wind speed changes is analyzed. The results show that when the state of energy storage batteries is considered in the wind–storage joint frequency regulation, the system frequency overshoot is reduced by 6.01%, the frequency recovery time is shortened by 3.476 s, and the steady-state frequency error is reduced by 0.004; high- and low-temperature environments will cause the frequency recovery time to be prolonged, with an overshoot of 16.30% in the 45°C high-temperature environment and an overshoot of 52.66% in the −25°C low-temperature environment; the lowest point of the system frequency remains above 49.6 Hz in the wind speed range of 5–15 m/s.
1. Introduction
In a period with a swift spread of globalization economic development, population increase, and technical advancement, there is an unparalleled rise in the world’s energy consumption [1]. Due to changes in the global energy system and the quick growth of clean resources, the share of newly generated power, mostly from wind and solar energy, is steadily rising [2]. Based on the German news agency, citing data from the Federal Network Agency, reported [3], Germany’s renewable energy generation in 2023 accounted for 56%; by the end of 2023, China’s wind power generation amounted to 885.87 billion kWh, and solar power generation amounted to 58.44 billion kWh, with the wind and solar power generation accounting for 25.63% of the total [4, 5]. However, traditional generators are unable to respond quickly enough to mitigate the intermittent power losses caused by new energy generation [6]. Moreover, the intermittent and random nature of new energy sources increases the volatility of grid-connected power generation and raises the frequency of system frequency regulation, leading to widespread concerns about the reliability of the power system [7]. Energy storage is one way to improve the utilization of new energy sources, reduce the impact of intermittent new energy sources on the grid, and provide flexibility and ancillary services to manage future power supply and demand challenges. It does this by having precise, quick, and flexible power response capabilities [8].
Therefore, the study suggests connecting energy storage to the wind power grid–connected system to provide active support, which can meet the grid’s requirement for the inertial response of wind farms and the primary frequency management, depending on the wind power’s inherent capacity for frequency regulation. Sun et al. [9] exploited the fast-ramping characteristics of energy storage systems to provide frequency regulation services using risk minimization techniques to address the uncertainty of frequency deviation and mitigate the problems associated with limited storage capacity. Castillo and Gayme [10] discussed the substantial role of grid-scale energy storage in the transition to an efficient, reliable, and cost-effective power system with renewable penetration rates, potential, and barriers and analyzed and compared different grid-scale storage technologies and battery technologies, showing that lithium battery storage is more suitable for large-scale energy and power services in terms of charge/discharge duration, response time, and efficiency. Wang et al. [11] conducted a comparative analysis of the substitution capability of energy storage and thermal units in power system frequency regulation, the multitimescales of different disturbance scenarios of the substitution ability of energy storage are analyzed under different disturbance scenarios in multiple timescales, and the high substitution ability of battery energy storage for thermal power units is verified. Liu et al. [12] establish the economic benefit model of energy storage batteries supporting conventional units in primary FM by carefully weighing the energy conversion rate and response time of various energy storage batteries when sizing energy storage capacity. This will yield the types of energy storage batteries that are appropriate for various control strategies in primary FM. In order to further analyze the frequency change of the power system when the battery energy storage participates in frequency regulation, scholars at home and abroad have carried out a lot of research on the frequency characteristics of the power system containing a high proportion of new energy sources [13, 14]. Yang et al. [15] use the model analysis method to establish the frequency response model of the power system where the wind–storage participates in frequency regulation and analyze the multidimensional frequency stability through the frequency characteristic transfer function, but they do not explore the internal state of lithium energy storage batteries. Gao et al. [16], after the power step, analyze the frequency response characteristics of the new energy power system and propose a workable method to quantify the common mode frequency characteristics of the system. To quantify the frequency characteristics, two indexes are proposed: a simple fall depth coefficient and a simple fall slope coefficient, but the battery pack state is not included. Zhang and Shi [17] conducted a dynamic modeling of large-scale wind power access to the power system’s frequency control features and examined the effects of wind power access on the power system’s frequency characteristics. Dar, [18] described the power and current response, which gives ideas for the simulation of this paper, based on the power system under high wind power penetration rate, the use of energy storage technology to improve the regional response characteristics of single-area power system, and the introduction of load perturbation.
When the energy storage charge state is at the top and lower limits, there will not be adequate storage power in the actual joint frequency control application. This is due to the fact that the energy storage battery’s internal condition affects how frequently the power system changes frequencies. Zhang et al. [19] proposed a wind–storage joint frequency regulation control strategy considering the state of charge (SOC) of the energy storage, comprehensively considered the frequency regulation demand under the complex working conditions of random changes in the wind speed and the load, and simulated and verified the proposed control strategy to take into account both the frequency regulation effect and the SOC protection. Ma and Yu [20] established the principle of dividing the charge state of energy storage to ensure the long-term stable operation of energy storage and adjusted the output of the energy storage device according to the division of the region, which greatly improved the stability of the frequency. Li et al. and Yan et al. [21, 22] proposed an SOC recovery strategy to ensure the stability of energy storage by considering the power management of the energy storage and taking full advantage of the dead zone of the frequency regulation, based on the base point of the SOC. SOC recovery strategy is proposed to ensure that the energy storage SOC is in a good state for a long time, but this control strategy model is more complex, which is not conducive to practical control. Large-scale battery energy storage systems are typically made up of several storage power plants. As input times increase, variations in the state of health (SOH) of the storage batteries develop gradually. These variations will eventually cause the storage system’s capacity and lifespan to be significantly reduced. Duan et al. [23] proposed an energy storage power allocation strategy that takes into account the consistency of the SOH of the storage batteries and the SOC, by using the optimization algorithm of the adaptive variational particle swarm algorithm, but this control strategy model is more complicated and is not conducive to practical control. To summarize, the majority of scholarly research has concentrated on energy storage SOC and SOH control strategies, largely ignoring the impact of external temperature, cycle times, and other factors on the internal characteristics of the battery in real-world scenarios. Additionally, analysis of the battery’s condition has a bearing on how the energy storage battery is allocated to capacity under wind–storage joint FM and how the power system frequency changes.
The main contributions of this paper are as follows: (1) By taking into account the penetration of new energy sources and the status of the storage battery, a suggested energy storage system frequency response model increases the power system’s frequency stability when compared to previous studies. (2) Dynamic characteristics (frequency recovery time tr, overshoot Mp) and static characteristics (frequency steady-state error ess) are introduced to qualitatively analyze the system frequency characteristics. The formation of rest of the article is organized as follows: A frequency response model of the power system under the combined wind–storage FM is constructed in Section 2. The energy storage system’s capacity is configured in Section 3. In Section 4, the model is validated by simulation, and the outcomes are analyzed. Lastly, the final portion contains the study’s conclusion.
2. Frequency Response Modeling of Power System Under Joint Wind–Storage Frequency Regulation
Power electronic control is primarily necessary for the realization of active frequency support in new energy power generation equipment, such as wind power and photovoltaic power generation equipment. Active support falls into two categories: power standby control and virtual inertia control. Wind farm virtual inertia is a control technique that mimics the synchronous generator’s inertia characteristics. It works by adding more virtual inertia to the wind farm, simulating the synchronous generator’s inertia response, which slows down power fluctuations and further improves power system stability. Figure 1 illustrates the control principle of the wind farm.

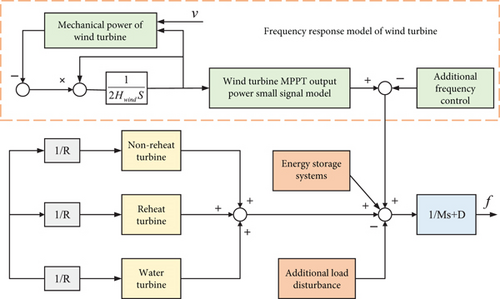
According to the above mathematical model, the wind turbine (DFIG) FM model is built as shown in Figure 2.

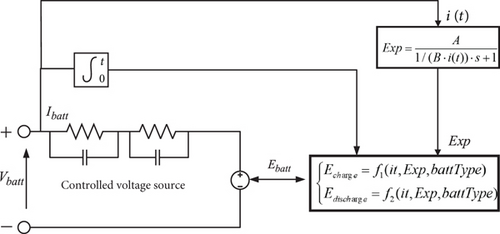
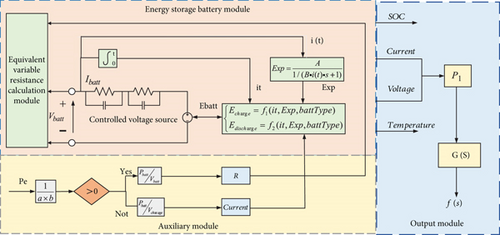
In the equation, ηAC-DC is the energy storage battery [29] AC to DC conversion power, ηDC-AC is the energy storage battery DC to AC conversion power, ηC is the storage battery’s own charging efficiency, and ηd is the storage battery’s own discharge efficiency. As can be seen from the formula, η1 and η2 are the value of the approximation, and it is unified to express the storage battery charging and discharging efficiency. The above mathematical models are combined to build a frequency response model of the battery energy storage system considering the efficiency of energy storage charging and discharging, as shown in Figure 3. The diagram controls the charging and discharging modes through logical judgments (such as “yes” and “not”) and describes the dynamic response characteristics of the system using transfer functions (such as 1/(s + 1)). Key parameters include power (Pe), time (3600 s), energy rate (Erate), and the battery’s SOC and initial energy (E0).

The energy storage system’s capacity can be configured in a way that is both rational and scientific to address the issue of grid frequency that arises from wind power grid integration. In order to analyze the additional load, frequency downward fluctuation of the wind power, and energy storage system to participate in the ratio of the electric power system’s capacity in order to meet the demand of the storage system under the change of wind speed, this section combines the actual wind speed and power data of a wind power plant in the Inner Mongolia Autonomous Region.
3. Results
Based on the aforementioned study, a power system frequency response model is constructed on the MATLAB/Simulink simulation platform, as seen in Figure 6, and the system configuration is displayed in Table 1. In the MATLAB/Simulink model, the initial power value is set to P0 = 100 MW and the initial frequency value is f0 = 50 Hz. A step load disturbance with an amplitude of ΔPL = 10 MW is applied to simulate the system’s response to sudden changes in load. The model includes traditional power supply, wind generation, and energy storage. This study sets up four simulation instances with varying operating conditions to show how the wind–storage joint system improves frequency responsiveness while taking the energy storage battery’s condition into account.
| Parameters | Numerical value | Parameters | Numerical value |
|---|---|---|---|
| Initial Power P0 | 100 MW | Initial frequency f0 | 50 Hz |
| New energy penetration α | 30% | Inertial response time Tw | 0.1 s |
| System equivalent time constant H | 4.5 | Sagging factor R | 0.05 |
| Damping constants D | 2 | Energy storage time constant TE | 0.2 s |
| Wind power inertia factor kdf | 20 | Primary FM power for wind farms ΔPβ | 20 MW |
| Primary frequency modulation factor kpf | 20 | Primary FM capacity of wind farms E | 166 KMh |
| System disturbance PL | 10 MW | The duration of the energy storage system Td | 50 s |
Working Condition I: no wind power access, by the traditional power supply for a frequency regulation; Working Condition II: wind power to participate in frequency regulation; Working Condition III: energy storage system access, do not consider the storage battery state of the wind–storage joint frequency regulation; Working Condition IV: energy storage system access, considering the storage battery state of the wind–storage joint frequency regulation.
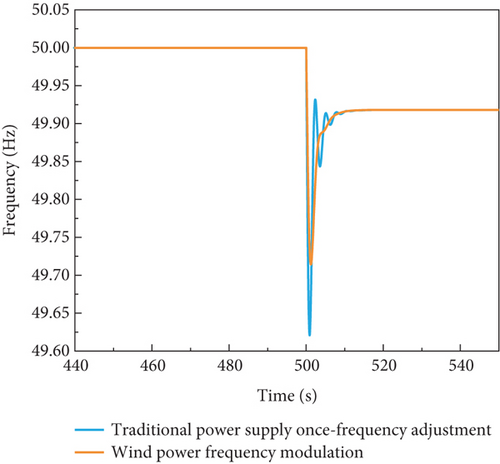
From Figures 7 and 8, it is found that when new energy is connected to the power system, wind power participation in frequency regulation provides inertial response and spare capacity required for frequency regulation so that the lowest point of the system frequency under the additional perturbation is increased, the amount of frequency deviation is reduced, the inertial response of the wind turbine is faster than that of the traditional power source, and the fluctuation is more gentle.
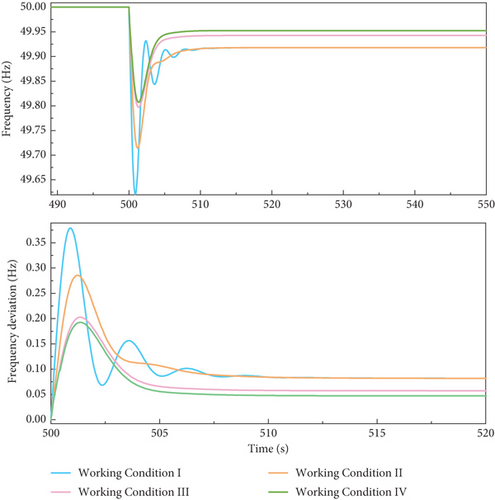
As shown in Figures 8 and 9, the integration of the energy storage system significantly improves the frequency response characteristics of the power system. Specifically, the frequency recovery time under Condition IV is reduced to 10.788 s, which is substantially shorter than that of Condition I (23.5813 s). The energy storage system compensates for the power required by the rotor inertia of the wind turbine and variable pitch control, thereby effectively meeting the system’s frequency regulation demands. The wind–storage joint frequency regulation not only elevates the lowest point of the system frequency but also reduces the rate of frequency change and minimizes frequency deviation, significantly enhancing the stability of the power system. Furthermore, the energy storage system enables peak-shaving and valley-filling, which reduces frequency volatility. Compared to Conditions I and II, the frequency curve under Condition IV is smoother, indicating a more effective reduction in storage capacity requirements.
4. Discussion
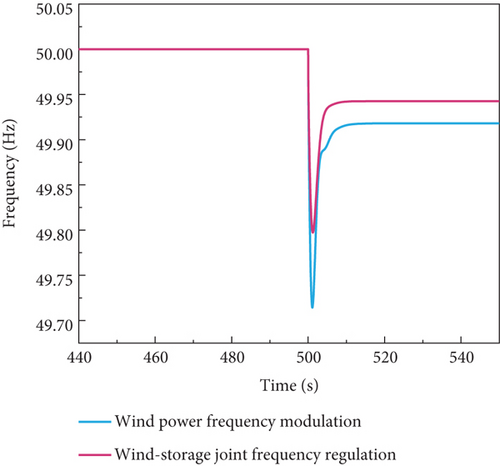
The frequency response process is a dynamic process. This paper introduces the dynamic characteristic index to further analyze the frequency characteristics of the proposed model. Frequency recovery time tr refers to the time required from the frequency fluctuation to the frequency to restore the steady state and is a measure of the system response speed; from what can be seen in Figure 8, the traditional power supply once the frequency recovery time tr1 for 23.5813 s, wind power to participate in the frequency adjustment frequency recovery time tr2 for 16.899 s, the wind and storage of the joint frequency adjustment frequency recovery time tr3 for 14.264 s, and the storage battery state of the wind and storage of the joint frequency adjustment time tr4 for 10.788 s can be considered The frequency recovery time tr4 is 10.788 s for wind–storage joint FM when the storage battery state is considered; it can be seen that the frequency recovery time of the system is reduced by 3.476 s when the internal state of the storage battery is considered comprehensively, and the response speed is faster.
Based on the aforementioned equations, Table 2 summarizes the key frequency characteristics under different operating conditions, including frequency overshoot (Mp), frequency recovery time (tr), and steady-state frequency error (ess). The results demonstrate that the wind–storage joint frequency regulation system, especially when considering the state of the storage battery (Condition IV), significantly improves system performance by reducing frequency overshoot by 6.01%, shortening the recovery time by 3.476 s, and decreasing the steady-state error by 0.004 compared to traditional power supply (Condition I).
| Condition | Description | Mp | tr | ess |
|---|---|---|---|---|
| I | Traditional power supply | 10.04% | 23.5813 s | 0.245 |
| II | Wind power participation | 8.02% | 16.899 s | 0.238 |
| III | Wind–storage joint FM (without battery state) | 6.63% | 14.264 s | 0.232 |
| IV | Wind–storage joint FM (with battery state) | 0.62% | 10.788 s | 0.228 |
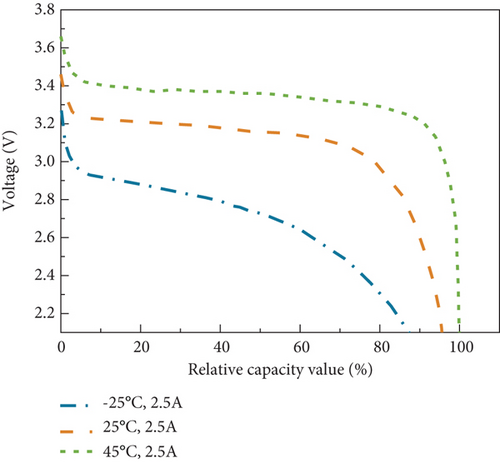
The variation in environmental temperature can directly affect the capacity of the battery. In high-temperature environments, the battery capacity increases, while in low-temperature environments, the battery capacity decreases, as shown in Figure 10. To assess the feasibility of practical application scenarios and considering the unique characteristics of high-temperature deserts or low-temperature polar regions, this study has simulated high-temperature conditions at 45°C and low-temperature conditions at −25°C. As shown in Figure 11, the frequency recovery time in low-temperature environments increases by 5.216 s compared to the standard temperature (25°C), while in high-temperature environments, the frequency recovery time increases by 3.316 s compared to the standard temperature (25°C). The specific frequency stability index calculation results are shown in Table 3.

| Temperature (°C) | Damping ratio ξ | Frequency overshoot MP |
|---|---|---|
| 45 | 0.2 | 16.30% |
| −25 | 0.5 | 52.66% |
In addition to the operating conditions discussed above, the performance of the proposed wind–storage joint frequency regulation system was further evaluated under different wind speeds to assess its robustness in real-world scenarios. Three wind speed conditions were considered: low wind speed (5 m/s), rated wind speed (10 m/s), and high wind speed (15 m/s).
Figure 12 shows the frequency response curves under low wind speed (5 m/s), rated wind speed (10 m/s), and high wind speed (15 m/s). The results indicate that the system maintains stable frequency regulation performance across a wide range of wind speeds. The frequency recovery time is shortest under rated wind speed (10.2 s), while low wind speed (5 m/s) results in a slightly longer recovery time (12.5 s) due to reduced power output. High wind speed (15 m/s) also shows a relatively short recovery time (11.0 s) but with a slightly higher frequency overshoot (0.624%) compared to rated wind speed (0.532%). These findings are summarized in Table 4.

| Wind speed (m/s) | Frequency lowest point (Hz) | Frequency recovery time (s) | Frequency overshoot (%) |
|---|---|---|---|
| 5 | 49.6 | 12.5 | 0.811 |
| 10 | 49.8 | 10.2 | 0.532 |
| 15 | 49.7 | 11.0 | 0.624 |
These experimental results demonstrate that the proposed system is robust to variations in wind speed and can effectively stabilize frequency under different operating conditions. This further supports the practical applicability of the wind–storage joint frequency regulation system in real-world power systems with fluctuating wind resources.
5. Conclusions
- 1.
The wind–storage joint frequency regulation method makes full use of the superiority of energy storage, to make up for the rotor inertia of the wind turbine and the power required for pitch control, and improves the lowest point of the system frequency by 0.084 Hz.
- 2.
The charge state of the storage battery decreases with time, and the internal temperature of the battery increases; when considering the state of the storage battery, the maximum frequency deviation of the system frequency can be reduced by 0.01 Hz, the frequency steady-state error value ess is reduced by 0.004, the frequency recovery time tr is reduced by 3.476 s, and the overshoot in frequency is reduced by 6.01%.
- 3.
The change in ambient temperature will directly affect battery capacity. Under high-temperature conditions of 45°C, the frequency recovery time increases by 3.316 s, while under low-temperature conditions of −25°C, the frequency recovery time increases by 5.216 s. Moreover, under low-temperature conditions, the frequency overshoot reaches 52.665%, whereas under high-temperature conditions, the frequency overshoot is 16.30%.
- 4.
Furthermore, the proposed wind–storage joint frequency regulation system demonstrates strong robustness under varying wind speeds (low wind speed: 5 m/s; rated wind speed: 10 m/s; and high wind speed: 15 m/s). Experimental results show that the system performs optimally at rated wind speed, with the shortest frequency recovery time (10.2 s). Under low wind speed, the frequency recovery time increases to 12.5 s due to reduced power output from the wind turbine, but the system still maintains stable frequency regulation. Under high wind speed, the frequency recovery time is slightly longer (11.0 s) with a minor overshoot (0.624%), indicating that the system can effectively handle excess wind power without significant instability.
Although the proposed model demonstrates significant improvements in frequency stability, this study has certain limitations. Specifically, the impact of energy storage capacity on the frequency performance of the model has not been fully explored. Further research could investigate the effects of energy storage capacity on system frequency and propose strategies to mitigate its impact on system frequency stability. Future work will focus on optimizing energy storage capacity, combining experimental and algorithmic studies to further analyze the extent to which the internal state of the battery affects system frequency, and conduct an economic analysis of the system.
Conflicts of Interest
The authors declare no conflicts of interest.
Funding
Research is supported by the Foundation for Innovative Research Groups of the National Natural Science Foundation of China (10.13039/501100001809) (52465008), the Basic Scientific Research Fund Projects of Universities Affiliated with Inner Mongolia Autonomous Region (2024QNJS012, 2024QNJS075, 0406082203), and the Natural Science Foundation of Inner Mongolia (2022LHMS05023).
Acknowledgments
The research work presented in this paper is financially supported by a Grant (52465008) of the National Natural Science Foundation of China and a Grant (2022LHMS05023) of the Natural Science Foundation of Inner Mongolia. The authors also acknowledge support from the Basic Scientific Research Fund Project of Universities Directly Under the Jurisdiction of the Inner Mongolia Autonomous Region through grants 0406082203, 2024QNJS075, and 2024QNJS012.
Open Research
Data Availability Statement
The datasets generated during and/or analyzed during the current study are available from the corresponding author on reasonable request.


