Performance Analysis and Optimisation During Machining of Al-ZrB2 Reinforcement-Based Metal Matrix Nanocomposites Using Coated and Uncoated Insert
Abstract
Lightweight and high-strength composites attract attention towards the different industrial applications. Reinforcement in base material makes composite operate at high working temperatures. The continuous pursuit of improving machining processes in the manufacturing industry has led to the development of these advanced materials and innovative tooling techniques. In this present research, focus is on the experimental study of the performance enhancement during machining operations on the fabricated different aluminium-based metal matrix nanocomposites (Al-MMNC) by employing temperature sensors and a dynamometer to monitor the material behaviours. The investigation involves a comparative analysis of cutting force (CF) and temperature at the tool tip to understand their respective effects on machining performance. Through comprehensive experimental trials conducted, the CF, material removal rate (MRR), temperature and surface roughness (Ra) values are quantified to determine the performance between both coated and uncoated inserts. Enhancement of these characteristics depends on factors like alloy grade, reinforcement type and its wt.%, speed and feed applied during machining. Main aim of the present work is to obtain the optimum combination of factors and their levels. Al 7075, Al6082 and Al 6063 are selected alloy levels, while zirconium diboride (ZrB2) reinforcement levels are set at 6, 9 and 12 wt.%. Speed levels are set at 112, 180 and 280 rpm, and feed rates are set at 0.15, 0.20 and 0.25 mm/rev. Al 7075 alloy with 12% ZrB2 reinforcement set at speed rate 280 rpm and feed rate at 0.20 mm/rev at constant depth of cut of 0.5 mm using uncoated insert gave the optimum values of response variables at the composite desirability of 0.69 from the Taguchi statistical analysis. The effects of CF, MMR, Ra and temperature on machining analysis of nanocomposites are provided in the article.
1. Introduction
Machinability is a significant factor to be considered while machining of any materials which gets affected by the chemical composition of the workpiece material microstructure, hardness, its grain size, the tensile strength, yield and tool materials used for machining. Generally, machinability is controlled by means of Ra, tool life, chip morphology, power consumption, cutting fluid, cutting force (CF) and material removal rate (MRR). Machining parameters such as cutting velocity, feed rate and depth of cut play a vital role in achieving a superior quality of the machined surface finish. Increased CF, tool wear and poor surface finish result when the interface temperatures at the tool tip and the workpiece material are high.
A study was conducted to review how heat treatment influenced the enhancement of machinability of steel alloy. The factors considered were Ra, chip morphology, terms of tool life and CF [1].
CF generated during machining is the most effective way of understanding the machinability characteristics since it directly affects the machined workpiece surface, tool life, power consumption and dimensional accuracy. So, the machinability study may include the study of properties like CF and temperature, surface condition, tool wear, etc. [2].
Results in deterioration of fatigue life and increase in residual stress, deflection, unstable vibrations and excessive temperature are due to higher CF. Figuring out the cause for this and avoiding excessive distortion are the challenges that every researcher faces [3].
During the cutting process, the CF will act between the tool and the workpiece. CF generated during machining mainly depends upon a combination of the tool and the work material [4].
Research was done on cutting tool materials for machining of titanium alloy. Machado and Wallbank suggested that the selection of a proper tool material would improve the machining process and the life of the tool, minimise the CF and give a good surface finish [5]. Shunmugesh et al. in their study found that Ra was most significantly affected by the feed rate rather than the cutting speed and the depth of the cut [6]. Francis et al. found that the cutting speed was the most significant factor affecting the MRR and feed was the most significant factor for Ra during optimisation of the cutting parameters that affect Ra [7]. Tanikic et al. used fuzzy logic and response surface methodology (RSM) for the prediction of cutting temperature under dry machining of AISI410 steel. The models developed showed that by selecting proper cutting conditions, it was possible to obtain minimum cutting temperature [8].
Even though MMNCs are known to have superior characteristics as compared to pure alloys and microcomposites, their commercial use has limitations because of evolving developments in this domain [9].
Figure 1 enumerates some potential applications of MMNCs. Microcomposites exhibit reduced ductility because of the larger size of particles used as reinforcement. On the other hand, the base metal becomes stronger with the addition of nanoparticles with the ductility being significantly unchanged. Hence, it is possible to utilise nanocomposites to replace the traditionally used microparticle materials to enhance ductility and toughness of the machine component [10–13]. Nanocomposites are harder, highly wear-resistant and have lower coefficient of friction (COF). Therefore, it is possible to use them as coating material in order to reduce the wear and tear of machine components [14–17]. A coating of nanocomposite material also makes the substrate more resistant to corrosion [18–21]. Recent work on magnesium nanocomposite suggests that it is potential orthopaedic application in the biomedical field due to its biodegradability and elastic modulus being similar to bones [22–24]. As the temperature of alloys and pure metals is raised, degeneration of mechanical characteristics of the metals and alloys sets in. Since nanocomposites are stable when exposed to high temperatures, they can be used to a larger extent in components that have to be exposed to higher temperatures [25, 26].
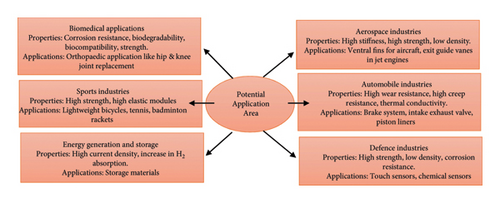
Various sectors such as aerospace, marine, automobile and industrial have felt the positive impact of the huge scope for the hybrid MMNCs for the past few decades [23]. The automobile industry has been consistently involved in designing and producing vehicles that are smaller in size, lighter in weight and are more efficient in terms of space as well as fuel [27]. Materials that are self-lubricants do not require to be lubricated externally and have many applications like pistons, gears, cylinder liners, constant velocity joints and sliding surfaces where many problems crop up due to creep, friction and wear between parts that are in relative motion [28]. Given the evolving aerospace industry, the power systems of the future will definitely require lifetimes that span seven to 10 years with sustained exposure to high temperatures, high loads and being subject to very severe environments [29]. The development of newer metal matrix composites (MMCs) should be such that they have the characteristics of self-cleaning and self-healing which are akin in concept to the properties of biological systems [28]. There are benefits to using the MMCs in future applications in the HVAC domain also. The evolution of the processing and manufacturing methods is required in parallel with a reduction in the cost of production which can lead to a boom in the use of MMCs [30]. There is potential for hybrid structures and materials with the use of foam architectures [31]. Scrap material should be segregated and recycled, while the MMCs are being processed [32].
The properties of any metal or alloy can be enhanced by introducing small fractions of nanoparticles in the metal. Most of the MMCs have improved significantly in terms of some important characteristics such as wear resistance, strength, creep resistance and thermal conductivity. The importance of MMNCs is further increased in applications that demand high strength along with good ductility and high thermal stability. This combination of properties can only be achieved by using metal composite. Several varying techniques are available for fabrication of nanocomposites. A suitable method of fabrication is selected based on specific design requirements and the type of matrix and reinforcement material. Fabrication methods are also continuously being modified based on specific requirements. Along with the above-mentioned advantages of MMNCs, there are certain critical issues which need to be taken care of like machinability, CF, MRR, temperature, particle agglomeration, nonuniform distribution of reinforcement and poor bonding between the matrix and reinforcement which deteriorates the properties of the nanocomposite. This indicates that the field of MMNC is still evolving. Thus, more research work should be conducted to accurately exploit the unique properties of MMNCs.
2. Methodology
2.1. Materials
2.1.1. Base Materials
Aluminium is the most popular engineering material for the aerospace industry. It contributes to approximately 60%–80% of airframe weight in modern space vehicles, helicopters and aircraft. Different aluminium alloy grades enhance different properties, and hence, they have different applications. Al 6063 is most widely used in automotive parts, architectural extrusion and other machine parts. Al 7075 is used in high-strength aircraft parts, while Al 6082 is used in cranes, trusses and cargo containers. These three aluminium alloys were selected for nanocomposite fabrication due to the above-mentioned application areas. The composition of the selected aluminium alloys is summarised in Table 1.
| Al alloy | Composition (%) | ||||||||
|---|---|---|---|---|---|---|---|---|---|
| Si | Fe | Cu | Mn | Mg | Cr | Zn | Ti | Al | |
| 6063 | 0.60 | 0.35 | 0.10 | 0.10 | 0.9 | 0.10 | 0.10 | 0.10 | 97.65 |
| 6082 | 1.30 | 0.50 | 0.10 | 1.00 | 1.2 | 0.25 | 0.20 | 0.10 | 95.35 |
| 7075 | 0.40 | 0.50 | 2.00 | 0.30 | 2.9 | 0.28 | 6.10 | 0.20 | 87.32 |
2.1.2. Reinforcement Material
ZrB2 is one of the ultra-high-temperature ceramic materials which has melting temperature exceeding 3000°C. The properties of ZrB2 particles (purchased at Vijay Commercial House, Mumbai) are listed in Table 2.
| Properties of ZrB2 | |
|---|---|
| Crystal system space group | Hexagonal |
| Density (g/cm3) | 6.119 |
| Melting point (°C) | 3245 |
| Hardness (GPa) | 23 |
| Young’s modulus (GPa) | 489 |
| Coefficient of thermal expansion (K−1) | 5.9 × 10⁻⁶ |
| Thermal conductivity (W/m·K) | 60 |
| Bulk modulus (GPa) | 215 |
| Heat capacity (J/(mol·K)−1) | 48.2 |
2.2. Fabrication of Nanocomposites by Stir Casting Method
Nanocomposites can be fabricated by different processing methods which includes solid-state processing, semi-solid-state processing, liquid-state processing and gaseous-state processing.
Stir casting is the most widely used cost-effective method of nanocomposite fabrication which is also called vortex casting. In this method, a stirrer rotating at high-speed draws and distributes the nanoparticles in the molten matrix [33–35].
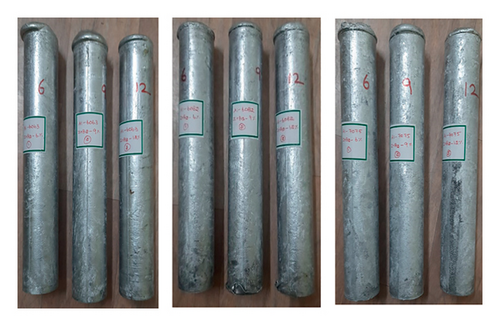
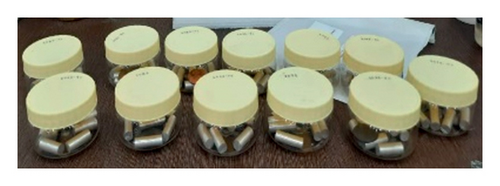
The schematic layout of the stir casting setup used to fabricate nanocomposites is shown in Figure 2(a). Casted billets are shown in Figure 2(b), and the samples are shown in Figure 2(c).
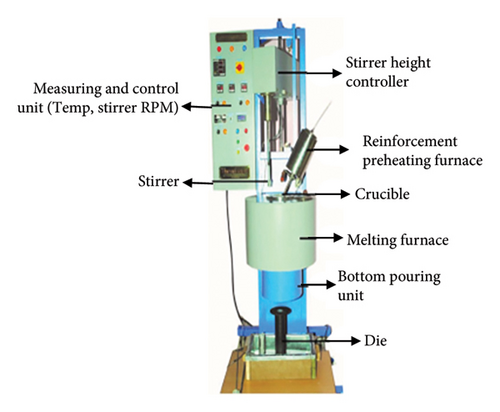
It consists of an electronically controlled mechanical stirrer, a melting furnace, reinforcement preheating furnace and a reinforcement feeder. The base metal is heated to molten state by using a melting furnace.
Preheating furnace also heats the reinforcement material to a specific temperature to eliminate moisture and to enhance the wettability of the reinforcement material. Then, the preheated reinforcement powder (APS: 43 nm) is added to the molten metal by using a feeder. This mixture of molten metal and reinforcement particles is stirred by operating the stirrer. To avoid the settling of the nanoparticles at the bottom of mould, bottom taping technique was adapted. To achieve uniform distribution of nanoparticles, two-step filler feeding method is used in which half volume of the mould is first filled with molten alloy and corresponding weight fraction of reinforcement is added, after mixing with stirrer the remaining part of the mould is filled with reinforcement and base metal, and then, the whole mixture is stirred by using stirrer. After sufficient stirring, the molten nanocomposite is allowed to cool slowly in a preheated die.
The following process parameters are used:
Stirring speed: 100–1500 rpm, reinforcement preheat temperature: 400°C and mould preheat temperature: 250°C.
2.3. Scanning Electron Microscopy (SEM) and Energy-Dispersive X-Ray Spectroscopy EDX Analysis
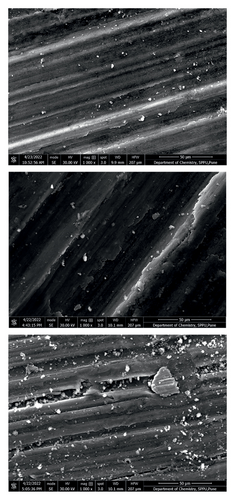
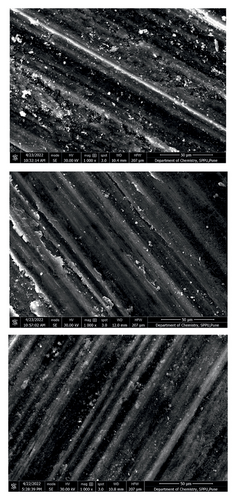
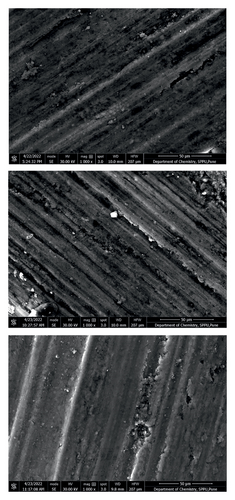
To analyse the effect of reinforcement on aluminium alloys, SEM was performed on the worn surface at a room temperature by keeping the other parameters like the load and speed constant for all the samples. Figures 2(d), 2(e) and 2(f) show SEM images of Al 6063, Al6082 and Al7075 with reinforcement content varying from 6% to 12%. These SEM images are analysed to find the dominating wear mechanisms in each alloy. Significant plastic deformation and ploughing of the surface were observed for Al 6063 nanocomposites. The decrease in groove size is observed with the increase in the weight fraction of ZrB2 from 6% to 12%. This may be due to the higher ductility of base alloy and lower hardness values of Al 6063 nanocomposites. The presence of grooves along with the flow of the materials indicates the presence of adhesive wear mechanism in the nanocomposites. Figure 2(d) shows higher surface damage for Al 6063–12% ZrB2 nanocomposite. This may be due to the combined effect of adhesive and abrasive wear mechanisms. The effect of abrasive wear mechanism dominates for nanocomposites with higher reinforcement content. As the effects of abrasive wear mechanism start dominating over the adhesive wear mechanism, wear debris on the surface of nanocomposites increases. Surface cracks and the flake-like debris increase with the increase in reinforcement content. This increase in the surface cracks and flake-like debris indicates the presence of delamination wear mechanism.
Similar to Al 6063 nanocomposites, the width of the grooves and the plastic flow of the material in the case of Al 6082 nanocomposites decreased with the reinforcement weight fraction (Figure 2(e)) which indicate the decrease in the effects of adhesive wear mechanism with the increase in reinforcing weight fraction. The overall damage to the surface was reduced as the reinforcement weight fraction increased from 6% to 12% ZrB2. The overall content of wear debris and flake-like debris also decreased with the increase in reinforcement content. This reduction in wear debris and subsurface cracks shows the declining surface damaging effects of abrasive and delamination wear mechanisms. Thus, it is concluded that the addition of nanoparticles in Al 6082 alloy enhances its wear property.
SEM images of Al 7075 nanocomposites showed reduction in surface damage with the increase in the weight fraction of nanoreinforcement (Figure 2(f)).
The size of the grooves along with the plastic flow of the material decreases with the increase in reinforcement weight fraction, which indicate decrease in the adhesive wear mechanism. Wear debris and surface cracks are also decreased with the increase in ZrB2 reinforcement weight fraction. This decrease indicates reduction in the surface damaging effects of abrasive wear mechanism and delamination wear mechanism.
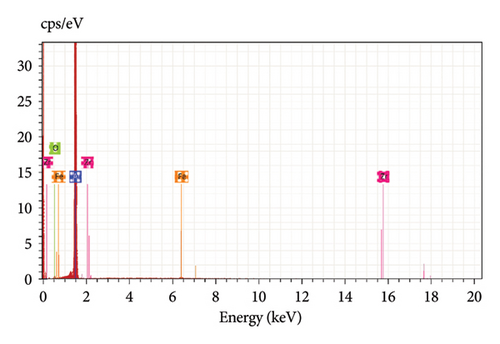
EDX was performed to know the composition of various constituents of the worn surface. Al 6063 with 12% ZrB2 was selected for EDX analysis since Figure 2(d) showed higher surface damage for Al 6063–12% ZrB2 nanocomposite. Figure 2(g) shows the composition of the surface. The formation of the oxide layer is confirmed from the EDX analysis which shows a peak corresponding to oxygen (O) (Figure 2(g)). This oxide layer is formed due to the heat that is generated from friction between the disk and pin surface. The formation of the oxide layer helps to reduce the wear rate of the nanocomposite. A transfer of some material from disk to the pin surface was observed from the peak corresponding to iron (Fe). Some traces of zirconium (Zr) were also detected due to the presence of reinforcement in the aluminium matrix.
2.4. CF and Temperature Test on Conventional Lathe Setup
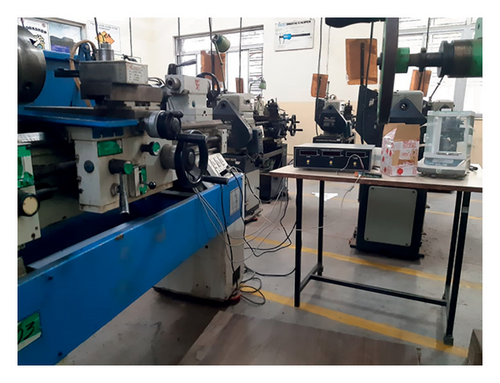
A conventional lathe machine with a setup of lathe tool dynamometer which could be directly fixed on to the tool post by the hole provided was used to obtain the CF data as shown in Figure 3(a).
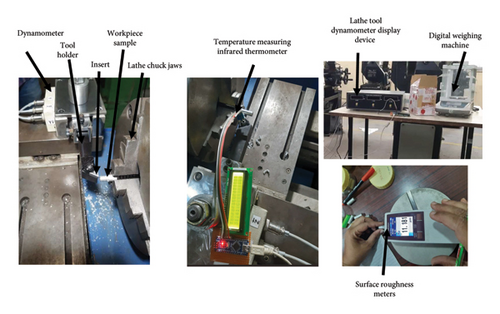
The apparatus consisted of microcontroller design-based RMS control lathe tool dynamometer provided with 3 connector sockets. One end of the sockets was connected to the dynamometer and the other end to the display device. 20–20 right hand tool holder (MTJNR2020K16) was used to hold the triangle turning coated insert (an advanced PVD grade WS25PT-TNMG-coated AlTiN carbide) and THM-uncoated carbide inserts. To measure the temperature at the tool tip and workpiece interface, an infrared thermometer was used which was assembled with K-type thermocouple temperature sensor and display. The temperature measuring capacity of this thermometer ranged from 0°C to 800°C (Figure 3(b)).
Machining was carried out using uncoated and coated inserts individually on the samples by varying the speed and feed as per the orthogonal array keeping the depth of cut constant at 0.5 mm. The trial was carried out in a number of passes on all the three Al alloys (6063, 6082 and 7075) with different weight percentages (6%, 9% and 12%) with different combinations of input parameters.
Force and temperature readings displayed on the devices were noted down. During each trial, the initial and final diameter of the sample was measured, and the response variable MRR was calculated. The samples were even placed below the surface metre for measuring the Ra.
3. Results and Discussion
The Taguchi DOE was adapted to analyse the CF and temperature. Table 3 shows the selected factors, their levels and values. An L18 orthogonal array was chosen as shown in Table 4. To study the impact of each factor, the S/N ratio was calculated as shown in Table 5.
| Factor | Levels | Values |
|---|---|---|
| Insert type | 2 | Uncoated (1), coated (2) |
| Alloys | 3 | 6063 (1), 6082 (2), 7075 (3) |
| ZrB2 reinforcement (%) | 3 | 6 (1), 9 (2), 12 (3) |
| Speed (rpm) | 3 | 112 (1), 180 (2), 280 (3) |
| Feed (mm/rev) | 3 | 0.15 (1), 0.20 (2), 0.25 (3) |
| S.No. | Insert type | Alloy | Reinforcement (%) | Speed (rpm) | Feed (mm/rev) |
|---|---|---|---|---|---|
| 1 | 1 | 1 | 1 | 1 | 1 |
| 2 | 1 | 1 | 2 | 2 | 2 |
| 3 | 1 | 1 | 3 | 3 | 3 |
| 4 | 1 | 2 | 1 | 1 | 2 |
| 5 | 1 | 2 | 2 | 2 | 3 |
| 6 | 1 | 2 | 3 | 3 | 1 |
| 7 | 1 | 3 | 1 | 2 | 1 |
| 8 | 1 | 3 | 2 | 3 | 2 |
| 9 | 1 | 3 | 3 | 1 | 3 |
| 10 | 2 | 1 | 1 | 3 | 3 |
| 11 | 2 | 1 | 2 | 1 | 1 |
| 12 | 2 | 1 | 3 | 2 | 2 |
| 13 | 2 | 2 | 1 | 2 | 3 |
| 14 | 2 | 2 | 2 | 3 | 1 |
| 15 | 2 | 2 | 3 | 1 | 2 |
| 16 | 2 | 3 | 1 | 3 | 2 |
| 17 | 2 | 3 | 2 | 1 | 3 |
| 18 | 2 | 3 | 3 | 2 | 1 |
| Insert type | Alloy | Reinforcement (%) | Speed (rpm) | Feed (mm/rev) | Cutting force (CF) in (N) | Material removal rate (MRR) in (mm3/min) | Surface roughness (Ra) in (μm) | Temperature (T) in (°C) | SNRA (CF) | SNRA (MRR) | SNRA (Ra) | SNRA (T) |
|---|---|---|---|---|---|---|---|---|---|---|---|---|
| 1 | 6063 | 6 | 112 | 0.15 | 73.55 | 373.14 | 12.009 | 31.83 | −37.331 | 51.437 | −21.590 | −30.056 |
| 1 | 6063 | 9 | 180 | 0.20 | 98.07 | 1205.67 | 12.009 | 32.05 | −39.830 | 61.624 | −21.590 | −30.116 |
| 1 | 6063 | 12 | 280 | 0.25 | 44.13 | 1812.07 | 12.009 | 37.47 | −32.894 | 65.163 | −21.590 | −31.473 |
| 1 | 6082 | 6 | 112 | 0.20 | 44.13 | 507.38 | 7.032 | 34.07 | −32.894 | 54.106 | −16.941 | −30.647 |
| 1 | 6082 | 9 | 180 | 0.25 | 44.13 | 1061.31 | 11.343 | 36.87 | −32.894 | 60.516 | −21.094 | −31.333 |
| 1 | 6082 | 12 | 280 | 0.15 | 49.04 | 1019.29 | 9.267 | 34.09 | −33.811 | 60.165 | −19.338 | −30.652 |
| 1 | 7075 | 6 | 180 | 0.15 | 44.13 | 508.94 | 1.523 | 33.09 | −32.894 | 54.133 | −3.653 | −30.393 |
| 1 | 7075 | 9 | 280 | 0.20 | 39.23 | 879.64 | 1.021 | 37.03 | −31.872 | 58.886 | −0.180 | −31.371 |
| 1 | 7075 | 12 | 112 | 0.25 | 49.06 | 613.02 | 1.674 | 33.87 | −33.814 | 55.749 | −4.475 | −30.596 |
| 2 | 6063 | 6 | 280 | 0.25 | 49.03 | 1341.37 | 17.385 | 37.97 | −33.809 | 62.550 | −24.803 | −31.588 |
| 2 | 6063 | 9 | 112 | 0.15 | 49.03 | 373.14 | 6.214 | 34.73 | −33.809 | 51.437 | −15.867 | −30.814 |
| 2 | 6063 | 12 | 180 | 0.20 | 44.13 | 931.92 | 11.234 | 36.57 | −32.894 | 59.387 | −21.010 | −31.262 |
| 2 | 6082 | 6 | 180 | 0.25 | 58.84 | 1153.59 | 12.723 | 38.79 | −35.393 | 61.241 | −22.091 | −31.774 |
| 2 | 6082 | 9 | 280 | 0.15 | 73.55 | 1087.24 | 9.492 | 39.09 | −37.331 | 60.726 | −19.547 | −31.841 |
| 2 | 6082 | 12 | 112 | 0.20 | 68.65 | 430.67 | 12.365 | 35.03 | −36.732 | 52.682 | −21.843 | −30.888 |
| 2 | 7075 | 6 | 280 | 0.20 | 34.32 | 1055.58 | 1.182 | 34.77 | −30.710 | 60.469 | −1.452 | −30.824 |
| 2 | 7075 | 9 | 112 | 0.25 | 34.32 | 689.64 | 0.913 | 33.23 | −30.710 | 56.772 | 0.790 | −30.430 |
| 2 | 7075 | 12 | 180 | 0.15 | 24.51 | 599.70 | 1.19 | 36.49 | −27.786 | 55.558 | −1.510 | −31.243 |
3.1. CF
Based on the Taguchi statistical analysis, it was concluded that the base alloy composition had the most significant role followed by reinforcement weight fraction, type of insert used and applied feed and speed in controlling the CF of the nanocomposite. Figure 4 depicts the changes in the S/N ratios of the selected factors.
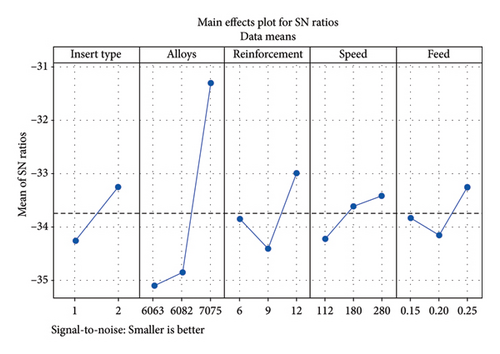
The composition of base alloys has a significant role in deciding the resistance of the material against the intrusion of the cutting tool. Here, the CF provides the ability to understand the behaviour of the alloy composition during the machining. Figure 4 shows the highest value of the S/N ratio for the Al 7075 alloy followed by the Al 6082 and Al 6063 alloys. Since there was a steep increase in the S/N ratio from alloy Al 6082 to Al 7075, it could be said that the CF was strongly influenced by the composition of different aluminium grades which could be correlated to its higher hardness values. Due to a drastic reduction in the hardness property of Al 7075 after the heat treatment, the CF for Al 7075 is minimum during machining.
Similar to the base alloys, the type and weight fraction of the nanoparticles also affects the CF of the nanocomposites [36]. Figure 4 shows that there is a decrease in the value of the S/N ratio of the CF for the increase in reinforcement percentage. With a further increase in the reinforcement, it was seen during the experimentation that the values of S/N ratio had drastically increased. This increase in the S/N ratio indicated that a rise in the reinforcement weight fraction brought about a decline in the CF of the nanocomposites. Thus, it was concluded that a significant decrease in CF could be achieved by increasing the ZrB2 nanoparticle weight fraction from 9% to 12% instead of increasing from 6% to 9%.
Similar to the base alloys and reinforcement, the cutting tool insert also affects the CF of the nanocomposites [37]. Mainly the CF decreases with the coated insert due to the better antifriction effect of the deposited coating. Again, as per literature, it is observed that machining of the MMNCs using a coated insert showed a decrease in the CF. A similar conclusion can be drawn by observing the S/N ratio plot for the CF as seen in Figure 4.
Generally, CFs tend to rise when the feed rate for all cutting speeds and depths of cuts rises [38]. Again, as per literature, an increase in the feed rate from 0.15 mm/rev to 0.20 mm/rev increased the CF. But a further increase in the feed rate at 0.25 mm/rev brought about a drastic decrease in the CF because at a higher feed rate, the frictional conditions reduce due to the minimised tool chip contact [38]. A similar conclusion could be drawn by observing Figure 4 that there was an initial decrease in the values of the S/N ratio and a further sudden increase in the S/N ratio value as the feed rate was increased from 0.20 to 0.25 mm/rev.
An increase in the cutting speed increases the cutting temperature, softens the cutting materials and leads to a reduction of flow stress affecting the tool and also brings about a decline in the CF [39]. A similar conclusion can be drawn by observing the S/N ratio plot for the CF as seen in Figure 4.
From the above analysis, it was observed that the combination of Al 7075 as base alloy with 12 wt.% ZrB2 as reinforcement at the higher spindle speed and feed rate of 280 rpm and 0.25 mm/rev when machined, using a coated insert gave the optimum CF. A confirmation test for predicted value and actual value of the CF is compared which shows a small error of 8.46%.
The ANOVA test was conducted on the S/N data of the CF with the insert type, alloys, reinforcement, speed and feed. The conclusions based on the comparison of the p value showed alloys as the most significant factor followed by the insert type, reinforcement weight fraction, feed rate and speed as shown in Table 6. The residual plot for the CF is represented in Figure 5.
| Source | DF | Adj SS | Adj MS | F value | p value |
|---|---|---|---|---|---|
| Insert type | 1 | 133.88 | 133.88 | 0.38 | 0.556 |
| Alloys | 2 | 1701.28 | 850.64 | 2.40 | 0.152 |
| Reinforcement | 2 | 290.91 | 145.46 | 0.41 | 0.676 |
| Speed | 2 | 82.88 | 41.44 | 0.12 | 0.891 |
| Feed | 2 | 210.90 | 105.45 | 0.30 | 0.750 |
| Error | 8 | 2832.96 | 354.12 | ||
| Total | 17 | 5252.80 |
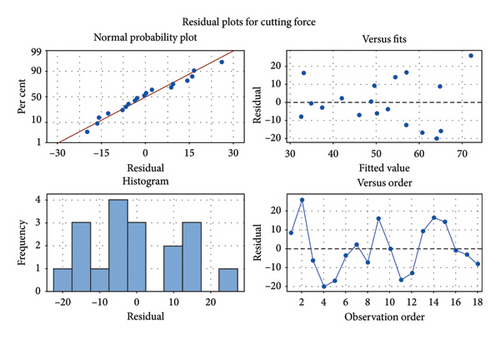
The histogram suggests normal distribution of residuals. A normal distribution of residual can also be observed from normal probability.
The interaction between the input parameters was significant during the analysis. The interaction plot for the CF is shown in Figure 6.
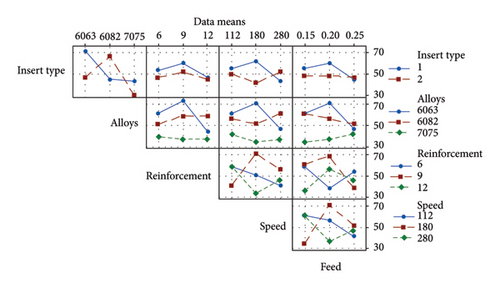
The implication here is that the impact of any one factor depends upon another factor and the confirmation of this is found in the ANOVA.
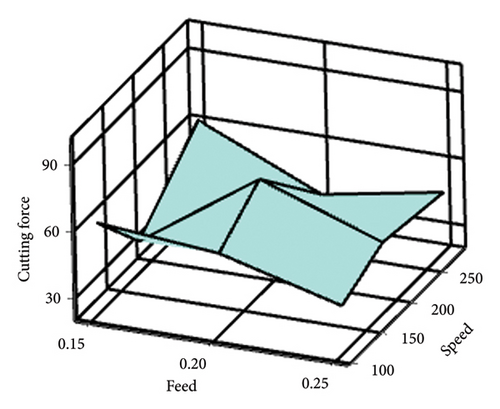
Figure 7 shows the surface plot for the CF vs. the variable input parameters like speed and feed rates showing the decreasing CF with an increased feed rate at lower and higher speeds.
3.2. MRR
MRR was calculated based on measurements of the initial and final diameter of the samples after turning and after they were analysed using the Taguchi statistical technique.
Based on the test results, speed and feed were the most significant factors. The alloys selected and reinforcement wt.% added to the alloys also strongly affected the MRR value. The insert type used for machining had a minimal effect on the MRR. Figure 8 shows the variation of the S/N ratios for the factors considered.
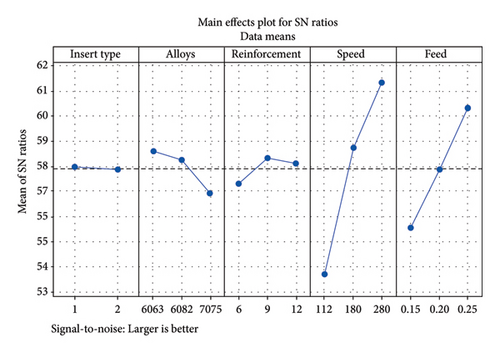
The MRR considered is the factor that directly affects the cost of machining and the machining hour rate [40]. The feed rate and speed are the most significant factors affecting the MRR [41]. However, similar results can be observed from the S/N ratio plot. This indicated that the maximum MRR could be obtained at higher speed values.
The MRR is also strongly influenced by the feed rate as shown in Figure 8. The maximum value of the MRR is obtained at a higher feed rate as the tool moves forwards faster towards the workpiece and removes more material. This can be observed in the S/N ratio plot which shows that the values of the S/N ratio increase when the feed rate is increased.
The MRR is also strongly influenced by the material composition [42]. Figure 8 shows a decrease in the S/N ratio value of the MRR as the base alloy composition is changed from Al6063 to Al7075. This indicates that the MRR is decreasing for Al7075 when compared to an increase in the MRR for Al6063 which can be correlated to the corresponding hardness values and wear behaviour of the alloys considered.
Similar to base alloys, the type and weight fraction of nanoparticles also affects the MRR of nanocomposites. An increase in the reinforcement percentage decreases the MRR [43]. Based on the experimentation and results obtained from the S/N ratio plot, it was observed that an increase in the reinforcement from 6% to 9% brought about an increase in the MRR. Furthermore, an increase in the reinforcement from 9% to 12% brought about a slight decline in the MRR. Thus, it could be concluded that the MRR could be increased by adding nanoparticles in the base alloys.
If there is a change in the type of insert from uncoated to coated insert, there will be an increase in the MRR [44]. Based on the experimentation and results obtained from the S/N ratio plot, it was observed that there was not much of a change in the MRR when we switched from an uncoated insert to a coated insert.
From the above analysis, it was observed that the combination of Al 6063 as base alloy with 9 wt.% ZrB2 as reinforcement along with the speed of 280 rpm and feed rate of 0.25 mm/rev using an uncoated insert gave the optimum MRR. A confirmation test for predicted value and actual value of MRR shows a small error of 2.41%.
The outcome of the ANOVA test for the MRR shows that the factors considered for testing include speed, feed and alloy composition which are most significant as their p values are less than 0.05 as shown in Table 7. The residual plot for the MRR is represented in Figure 9.
| Source | DF | Adj SS | Adj MS | F value | p value |
|---|---|---|---|---|---|
| Insert type | 1 | 5604 | 5604 | 0.24 | 0.640 |
| Alloys | 2 | 238,738 | 119,369 | 5.02 | 0.039 |
| Reinforcement | 2 | 19,838 | 9919 | 0.42 | 0.672 |
| Speed | 2 | 1,490,960 | 745,480 | 31.36 | 0.001 |
| Feed | 2 | 622,166 | 311,083 | 13.09 | 0.003 |
| Error | 8 | 190,148 | 23,768 | ||
| Total | 17 | 2,567,454 |
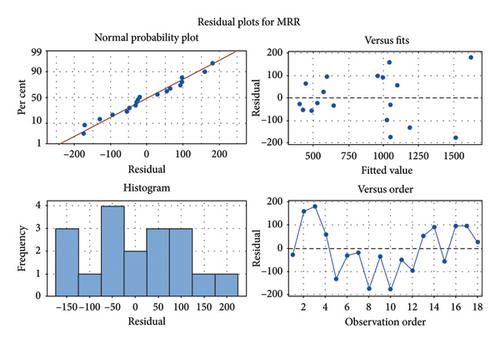
The interaction plot for MRR is depicted in Figure 10.
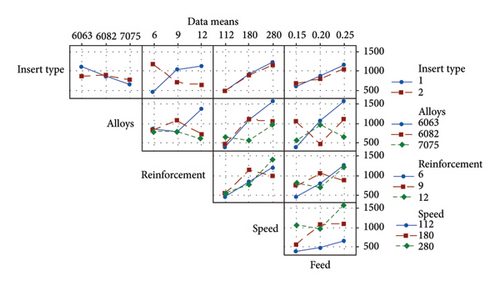
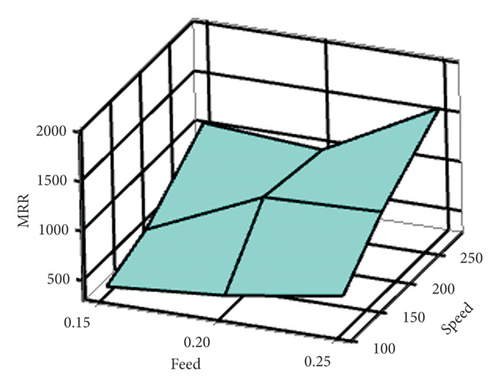
Figure 11 shows the surface plot for the MRR vs. variable input parameters like speed and feed rates showing the increasing MRR with higher speed and feed rates. The MRR is minimum at lower speed and feed rates.
3.3. Surface Roughness (Ra)
Depending on the Taguchi statistical analysis, it is concluded that the base alloy composition had the most crucial role in controlling the Ra of the samples. The reinforcement weight percentage of ZrB2 added in base alloys, feed rate applied and speed provided during machining also played a major role in influencing the Ra of the samples. Figure 12 shows the variation of S/N ratio for the selected factors.
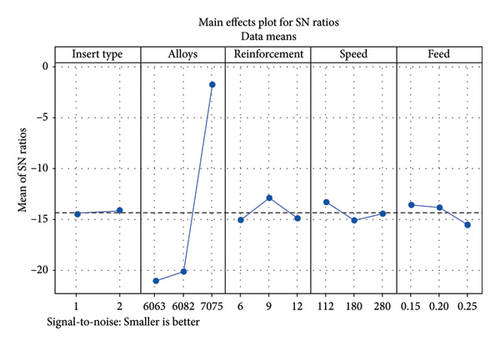
Figure 12 shows the highest value of S/N ratio for Al 7075 alloy composition followed by Al 6082 and Al 6063. One could say that the Ra was strongly influenced by the composition of different aluminium grades which could be correlated with their hardness values.
Figure 12 shows the highest value of the S/N ratio for 9% reinforcement followed by 12% and 6%. Since there was a gradual increase in the values of S/N ratio initially with a rise in the weight fraction of the reinforcement from 6% to 9% in the nanocomposites, one could say that Ra was strongly influenced by the reinforcement weight fraction reducing the roughness of the materials on the surface and giving a better finish and accuracy in its dimensions. Furthermore, an increase in the reinforcement from 9% to 12% brought about a sudden decrease in the S/N ratio values which indicated that extra reinforcement ratios reduced the Ra because of the problem of cutting hard particles and how negatively the smoothness of the surface was affected [45].
It is a known fact that for an enhanced surface finish, a lower feed rate is preferable [46]. Similar results are obtained for the Ra from the S/N ratio plot, indicating that a rise in the feed rate increases the roughness of the material.
Rise in the speed of the spindle decreases the roughness [47]. Similar results were obtained from the analysis of the effect of speed on the Ra. With a further increase in speed to 280 rpm, the S/N ratio values increase indicating a better finish on the materials.
When coated inserts are used under identical machining conditions, Ra marginally reduces [48]. From Figure 12, it can be seen that there was not much variation in the increase in the values of the S/N ratio when we changed the uncoated insert to a coated insert during machining. But higher values of the S/N ratio were noted for a change in the insert type which indicated that a better surface finish could be obtained from coated inserts rather than from the uncoated inserts.
From the above analysis, it was observed that the combination of Al 7075 as base alloy with 9 wt.% ZrB2 as reinforcement along with the speed at 112 rpm and feed rate of 0.15 mm/rev using a coated insert gave the optimum Ra. A confirmation test for predicted value and actual value of Ra shows a small error of 1.86%.
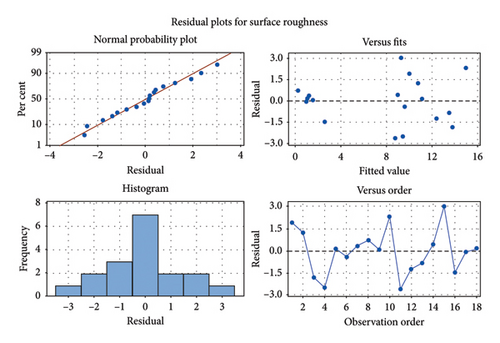
The outcome of the ANOVA test shows the factors considered for testing including alloy composition which is a most significant factor as the p value is less than 0.05 as shown in Table 8. The residual plot for Ra is represented in Figure 13.
| Source | DF | Adj SS | Adj MS | F value | p value |
|---|---|---|---|---|---|
| Insert type | 1 | 1.286 | 1.286 | 0.25 | 0.631 |
| Alloys | 2 | 393.494 | 196.747 | 38.23 | 0.001 |
| Reinforcement | 2 | 10.024 | 5.012 | 0.97 | 0.418 |
| Speed | 2 | 11.080 | 5.540 | 1.08 | 0.385 |
| Feed | 2 | 23.301 | 11.651 | 2.26 | 0.166 |
| Error | 8 | 41.176 | 5.147 | ||
| Total | 17 | 480.362 |
The interaction between input parameters is significant during analysis. The interaction plot for Ra is depicted in Figure 14.
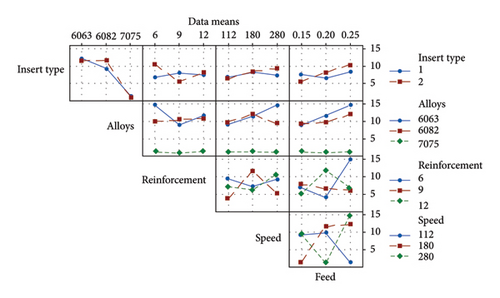
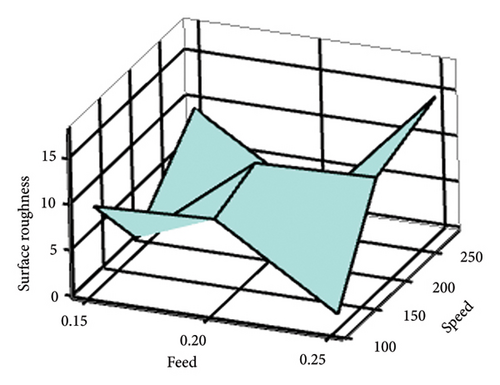
Figure 15 shows the surface plot for Ra Vs variable input parameters like speed and feed rates showing the minimum Ra with lower speed and feed rates. Ra is maximum at higher speed and feed rates.
3.4. Temperature
The process becomes unstable when there is a rise in the temperature at the tool and workpiece interface which will affect the tribological and metallurgical properties of the work surfaces. So, it is necessary to analyse the factors affecting the rise in the temperature at the tool-tip interface.
Based on the Taguchi statistical analysis, a conclusion could be arrived is that speed had the most crucial role in controlling the temperature at the tool and workpiece interface. The type of insert used during machining, the base alloy composition and feed rate also played a major role. Reinforcement weight percentage of ZrB2 added to the base alloys also played a minor role for influencing the temperature. Figure 16 shows the changes in the S/N ratio for the chosen factors.

Temperature is the most significant parameter in the analysis as it has great control over the machining process. It affects the shear deformation and tool wear. When compared to all factors, speed is the one crucial factor that affects temperature at the tool tip [49]. Similar results were obtained after experimentation and analysis from the S/N ratio plot. This led to the conclusion that an increase in speed rate increased the temperature at the interface of the tool and the workpiece.
Temperature at the tool-tip interface increased by using coated inserts which also get affected by the applied speed and feed rate [50]. Similar results were obtained from the S/N ratio plot. So, using a coated insert, an increase in the temperature at the point of the tool–workpiece interface was observed.
The impact of hardness, the mechanical strength of the machined alloy, cutting parameters and cutting conditions have a great influence on the cutting temperature [51, 52]. An increase in the hardness increases the temperature [53]. Similar results were obtained based on the analysis. A steep decrease in the values of the S/N ratio was observed from the base alloys Al 6063–Al 6082 due to the increase in their hardness after reinforcing which resulted in an increased temperature at the interface of the tool and the workpiece. Furthermore, by changing the base alloy from Al 6082 to Al 7075, it was observed that there was a steep increase in the values of the S/N ratio due to its reduced hardness after reinforcing resulted in a decreasing temperature at the tool–workpiece interface.
Feed is another significant factor along with speed in affecting the temperature at the tool tip [49]. Similar results were obtained after experimentation and analysis from the plotted S/N ratios. A steep decrease in the values of S/N ratios was observed when the feed was increased from 0.20 to 0.25 mm/rev. This resulted in the conclusion that an increase in the feed rate increased the temperature at the interface of the tool and the workpiece. A higher temperature was observed at the higher feed rate.
Conditions at maximum tool-tip interface temperature require a higher CF during the machining process as the weight % of the reinforcement in the base alloys will go up [54]. Similar results were seen from the S/N ratio plot. A sudden decrease in the S/N ratio values was observed by an increase in the reinforcement from 6% to 9%. A further increase in the volume fraction from 9% to 12% brought about a bigger decrease in the value of the S/N ratio. This led to the conclusion that an increase in the volume fraction of the reinforcement increases the temperature at the tool tip during machining.
From the above analysis, it was observed that the combination of Al 7075 as base alloy with 6 wt.% ZrB2 as reinforcement along with the speed at 112 rpm and the feed rate of 0.15 mm/rev using an uncoated insert gave the optimum temperature at the tool–workpiece interface. A confirmation test for predicted value and actual value of temperature shows a small error of 3.62%.
The results of the ANOVA test for temperature show that the factors considered for testing include speed as most significant factor as the p value is less than 0.05 as shown in Table 9.
| Source | DF | Adj SS | Adj MS | F value | p value |
|---|---|---|---|---|---|
| Insert type | 1 | 14.7606 | 14.7606 | 4.68 | 0.063 |
| Alloys | 2 | 8.2030 | 4.1015 | 1.30 | 0.324 |
| Reinforcement | 2 | 0.8567 | 0.4284 | 0.14 | 0.875 |
| Speed | 2 | 26.5622 | 13.2811 | 4.21 | 0.056 |
| Feed | 2 | 8.5687 | 4.2844 | 1.36 | 0.311 |
| Error | 8 | 25.2412 | 3.1552 | ||
| Total | 17 | 84.1924 |
The residual plot for temperature is represented in Figure 17.
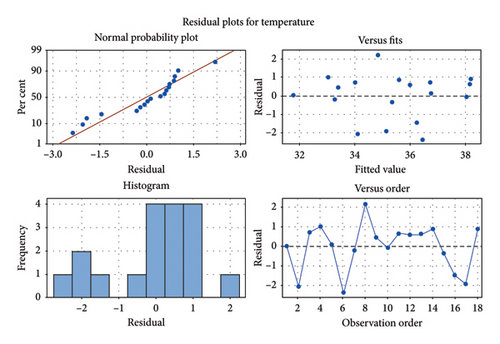
The interaction between the input parameters was significant during analysis. The interaction plot for cutting temperature is shown in Figure 18.
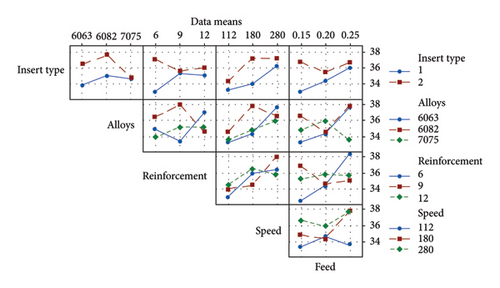
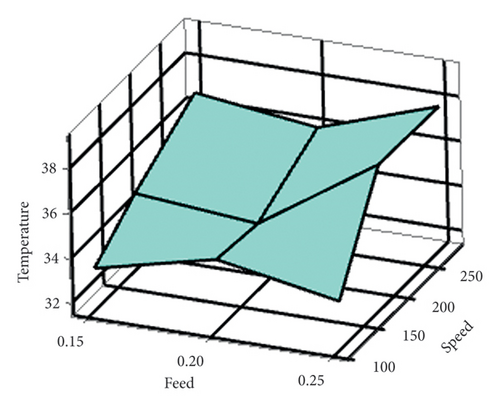
Figure 19 shows the surface plot for temperature vs. variables. Input parameters like speed and feed rates show the minimum temperature with a lower speed and feed rates. Temperature is maximum at higher speed and feed rates.
3.5. Multiobjective Optimisation
When many response variables are studied during the experimental analysis, you need to optimise many objective functions simultaneously if you need to balance all the competitive objective functions without neglecting any of the response variables. However, it is difficult to bring a narrow solution when each function has its own feasibility for the solution space and problem space which cannot be altered. Multiobjective optimization is one such way to analyse the solution space and make an optimal choice without neglecting the problem space.
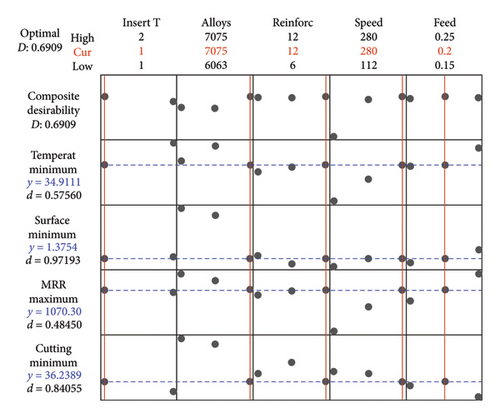
The parameters were set for minimising response variables like CF, temperature, Ra and maximising the MRR. All the input variable ranges were considered, and the goal was set. Solution for the multiple response prediction is shown in Table 10.
| Variable settings | Insert type | 1 | ||
|---|---|---|---|---|
| Alloys | 7075 | |||
| Reinforcement | 12 | |||
| Speed | 280 | |||
| Feed | 0.20 | Experimental values | Error % | |
| Response fit | Temperature fit | 34.9111 | 37.02 | 6.04 |
| Ra fit | 1.37539 | 1.436 | 4.43 | |
| MRR fit | 1070.3 | 1055.575 | 1.37 | |
| CF fit | 36.2389 | 39.23 | 8.25 | |
| Composite desirability | 0.690883 | Overall, error % | 5.02% |
Figure 20 shows the multiple response plot with a composite desirability value of 0.69 which is considered near to ideal.
4. Conclusions
The primary goal of this work is to procure an optimum combination of Al alloys (fabricated Al-MMNCs), reinforcement, load, type of insert, speed and feed rates from their selected levels. The Taguchi DOE along with its statistical technique is adapted to find the optimum combination of factor levels. The effect of each input variable on the response variables during the machining test conducted for all aluminium alloys based on data collection after experimentations carried out on lathe machine is studied by carrying out the analysis.
- 1.
The combination of Al 7075 with 12 wt.% ZrB2 at the higher spindle speed and feed rates of 280 rpm and 0.25 mm/rev using a coated insert gives the optimum CF. The predicted value and actual value of the CF are compared, which shows a small error of 8.46%.
- 2.
A combination of Al 6063 with 9 wt.% ZrB2 with the speed at 280 rpm and feed rate of 0.25 mm/rev using an uncoated insert gives the optimum MRR. The predicted value and actual value of the MRR are compared, which show a small error of 2.41%.
- 3.
A combination of Al 7075 with 9 wt.% ZrB2 with the speed at 112 rpm and feed rate of 0.15 mm/rev using a coated insert gives the optimum Ra. The predicted value and actual value of Ra are compared, which show a small error of 1.86%.
- 4.
A combination of Al 7075 with 6 wt.% ZrB2 with the speed at 112 rpm and feed rate of 0.15 mm/rev using an uncoated insert gives the optimum temperature at the tool–workpiece interface. The predicted value and actual value of temperature noted are compared, which show a small error of 3.62%.
- 5.
From the multiobjective optimisation, it is concluded that aluminium 7075 alloy reinforced with 12% ZrB2 with speed at 280 rpm and feed rate at 0.20 mm/rev using uncoated insert gives the optimum values of response variables at the composite desirability of 0.69.
Conflicts of Interest
The authors declare no conflicts of interest.
Funding
No funding was received for this research work, paper writing, editing and publication.
Open Research
Data Availability Statement
Data sharing is not applicable to this article as no additional datasets were generated. The data that support the findings of this study are available in the supporting information of this article. Even after this, if any additional information is required about the research, it will be provided by the author upon the reasonable request.


