Network Design and Route Analysis Using Outside Plant
Abstract
Outside plant (OSP) is essential for telecommunications, internet, and other communication services that require connectivity beyond indoor spaces. These networks often involve the installation of cables, conduits, cabinets, poles, and other infrastructure elements to connect various locations. However, different service channels such as water pipelines, network cables, and electric cables make the implementation of these installations very challenging. This research presents an investigation into the route design and analysis of fiber architectures, taking into account aerial and underground installations. In this research, a novel safe route that will enable safe, undeterred, and cost-effective OSP fiber optic installation was implemented. A high-level design was produced to realize the optimum structural design and implementation of the backend framework of the fiber system. This method helped to tidy the utility corridors and tackle the problem associated with improper planning and design of passive OSP routes. The area to be worked on was demarcated and specification of the boundaries under consideration was noted. A key position for setting up the fiber distribution terminals (FDTs) was determined after which the area being considered is divided into sections, with each distribution line from the FDT serving one section. This was followed by a low-level design which was more detailed. In this stage, the area under consideration was divided into sections with which different distribution lines to serve each section. This was achieved through the identification of residential clusters. To demonstrate our methodology, we provided fiber to the home (FTTP) to an apartment located in the capital city of Ghana. Estimation of parameters, gathering of information, implementation, testing, and analyses were made, followed by adjustments where necessary. Losses from distances of 0.15–5 km were observed. Individual components in the OSP architecture contributed to fixed losses of 0.7, 10.5, and 10.6 in the optical line terminal (OLT), FDT, and fiber access terminal (FAT), respectively. Actual losses from cable length and the nature of the route ranged from 1.04 to 2.24 dB. A slope of 0.24 dB/km was obtained and this is within the required route loss of less than 1 dB/km in fiber optic transmissions. From the research, it was observed that there was a loss in signal power as distance increased. Also, signal loss at a wavelength of 1550 nm was better than signal loss at 1310 nm. Our research revealed a balanced loss of 0.35 dB/km for 1310 nm wavelengths and 0.25 dB/km for 1550 nm. The total distribution length loss for core cables 1, 2, 3, and 4 at wavelengths of 1310 nm were 1.0307, 0.76556, 1.1719 dB, and 1.1322 dB, respectively. The total distribution length loss for core cables 1, 2, 3, and 4 at wavelengths of 1550 nm were 0.7362, 0.5468, 0.837, and 0.8087 dB, respectively. FAT Power (dBm) for feeder lines 1, 2, 3, and 4 and distribution lines 1, 2, 3, and 4, respectively, were all within the acceptable range. The design will help to reduce the cost of repairing damaged cables drastically. Also, the design methodology helped us to develop a backbone network to get closer to the various homes and premises. The architecture was also designed to prioritize the bandwidth demand by clients at the premises. The significance and impact of the research are essential in enhancing efficiency, reducing costs, improving reliability, and ensuring scalability in network design and route analysis. The integration of novel technologies and innovative methodologies makes them relevant in today’s fast-evolving technologies.
1. Introduction
Communication has become part of our lives for many years and it is still an integral part of our lives. In the olden days, fiber optics was reserved for very short-distance transmissions due to a significant path loss. However, in 1964, Charles K. Kao made a crucial innovation by employing fused silica in the cladding of fiber optic cables. This enabled the suitable loss of 1 dB per kilometer. This achievement led to the advancement in long-haul fiber optic communication and transmission [1–4]. Current research and development of fiber optic transmission systems are motivated by two things: increasing fiber capacity and expanding transmission distance. The greater bandwidth and longer distance capability of fiber optics have made it the most economical method of transmitting information worldwide. To encourage the next-generation applications based on the Internet of Things (IoT), 5G, artificial intelligence (AI), smart eHealth, smart homes, etc. require larger bandwidth [5–8]. Many technologies have been adopted to meet the need for high bandwidth. Further advancements in fiber optic technologies have made long-haul communication possible.
Outside plant (OSP) network design refers to the planning, layout, and implementation of the physical infrastructure required to establish communication networks in outdoor environments. This comprises the cables, conduits, cabinets, towers, poles, and other equipment located outside of buildings. The term includes both the passive and active components necessary for transmitting signals across various distances and environments. OSP infrastructure transmits various types of signals, including voice, data, and video from the central office or service provider center to the end users. OSP allows for the expansion and scaling of telecommunications networks to reach more users and support increased data traffic [9–13]. It is essential for telecommunications, internet, and other communication services that require connectivity beyond indoor spaces. Maintenance is also critical to the continued operation of the fiber optic network. Confliction of pathways with other service conduits such as water pipelines, electricity lines, and other networks is a major hurdle for most fiber optic service providers [14–16]. These services can interfere with one another as they mostly use the same utility corridor for their operations. The number of fiber cuts in the industry has seen an exponential increase over the last decade. According to the Ghana Telecoms Chamber, mobile telecommunication companies have spent over GHC80 million over the last 3 years to repair damaged fiber cables [17–19]. Planning and design are very important in OSP as weather conditions, natural disasters, and other environmental factors can lead to service interruptions due to damage to infrastructure [20–23]. Cables and equipment must be able to withstand various weather conditions and the infrastructure should be easily scaled to accommodate growing demand without significant extra costs. The motivation behind this research is to optimize connectivity, minimize downtime, and maximize performance to create a structured and scalable framework that will meet current and future communication needs. Kepaptsoglou and Karlaftis [24] reviewed a paper on the transit route network design problem (TRNDP). They systematically presented and reviewed research on the transit route network design problem based on the three distinctive parts of the TRNDP setup: design objectives, operating environment parameters, and solution approach.
Despite existing research in optimizing OSP deployments, challenges remain in addressing network performance, durability, and cost-efficiency across varied geographical areas. This research builds on prior work by offering an enhanced framework for OSP management, using optimization techniques. The study setup, which involved the deployment of fiber-optic cables across a demarcated area will provide new insights into the trade-offs between cost and performance in diverse environments. This structure offers a clear pathway from the foundational context of the research to the specific methodological details and contributions, ensuring the study’s advancements. Most of the previous works and literature reviews have only provided suggestions or simulation results. In our research, we implemented our design with results to authenticate our designed system. The research aims to develop optimized methodologies for network design and route analysis in OSP telecommunications infrastructure. It will focus on creating efficient design frameworks that enhance network performance, minimize costs, and ensure scalability and resilience for future technological advancements. The objectives of this research are to design a novel safe route that will enable safe, undeterred, cost-effective, and enhance network reliability by incorporating factors such as geographical constraints, right-of-way issues, and environmental factors [25]. Second, to integrate emerging technologies such as fiber to the home (FTTH) and 5G backhaul into OSP design strategies, ensuring that the proposed network solutions are adaptable to next-generation communication needs. This novel method will help to reduce the maintenance cost of backhaul fiber systems, allow easy fiber system upgrades of outside plants, and tidy the utility corridors. Our approach will tackle the problem associated with improper planning and design of passive OSP routes on utility corridors. A high-level design will be presented to showcase the planned routes for the OSP network. The high-level design will be planned by considering the demarcation and specification of the boundaries under consideration and finding a key position for setting up the fiber distribution terminal (FDT). This will be followed by a low-level design which will be more detailed. The central switching center (CSC) will be positioned to determine the appropriate route for incoming server requests. The low-level backhaul route design is initiated from the optical line terminal. We will focus on a method of utilizing the utility pathways or corridors available for service providers. The high-level design for the area to be worked on was planned while taking into consideration some key steps. We aim to decrease the mean deviation across all fiber access terminals (FATs). We demonstrated our work by providing services to an apartment located in the capital city of Ghana. This research has been structured into five main sections. Section 1 is the introduction. It provides a brief history of fiber optic systems. It also presents a statement on the problems associated with the installation of outside plant fiber cables in Ghana. Section 2 presents the literature review of some articles that are of relevance to the study. It further points out the limitations of some of these articles. Section 3 describes the system design and methodology of the proposed system. The hardware and software design are considered in this section. Section 4 focuses on the implementation and testing of the system to authenticate its functionality. It also analyses the results obtained from the tests and performance evaluation. Section 5 is the conclusion part of the paper. It highlights the key accomplishments of the work and possible recommendations for further work to enhance the performance of the system.
2. Literature Review
In this section, a literature review of existing related work is discussed in detail. It took into consideration areas of interest such as pathways, spaces, cable bonding, grounding, right of way, and financial constraints. It provides a guide to fiber network designers on things to be considered when mapping out fiber pathways. Furthermore, we highlight the strengths and limitations of the available proposed approaches. The following summary and critical examination of the available literature focuses on topology management for maintaining connectivity.
Ben and Teddy [26] investigated the most serious impacts that result from frequent fiber cuts and the negative effects such as the increase of operational expenditure, and the decline of the revenue by the telecom service providers in Ghana was analyzed. They conducted the research using MTN Ghana (Western and Central Region) as a case study. A purposive survey was administered to obtain information about the impacts. Based on the primary data evaluated, it was established that the total network unavailability attributed to fiber cut for the period under study, that is, from 2014 to 2016 was about 540 h equivalent to about 22 and one-half days. It was established that fiber cut incidences have had negative impacts on the organization’s revenue generation ability, increased its operational expenditure exponentially as well, and dwindled its commercial fortunes in strategic marketplaces within the strategic business unit. Again, it was concluded that the organization lost a tremendous amount of revenue to this fiber-cut menace concerning the operational cost incurred to restore and relocate the damaged fiber cut. The research obtained its objective concerning the impact of the fiber cut on service delivery. However, there was no suggestion on how to properly use and manage the utility corridor.
Gulzar [27] addressed the issue of an efficient QoS-based multipath routing scheme for smart healthcare monitoring in wireless body area networks (WBANs). They proposed an efficient QoS-based multipath routing (MPR) scheme for WBAN. In MPR, incoming traffic is categorized into normal and emergency. Furthermore, the available paths in the network are also divided into the best and alternate paths to be used for critical and normal traffic. Emergency traffic was given high priority and routed on the best path within the network improving the reliability and throughput of a WBAN. The proposed scheme outperforms state-of-the-art approaches in terms of energy efficiency, network throughput, packet drop ratio, packet delivery ratio, and end-to-end delay. A fuzzy logic-based evaluation of the proposed scheme further testifies that the proposed work outperforms state-of-the-art approaches. Although the analysis testifies that the proposed scheme is efficient in terms of residual energy, network throughput, packet drop, delivery ratio, and at last end-to-end delay, the results were based on simulation. The limitation of the proposed work is that the security testbed implementation was not performed. Also, fiber was not considered as the backbone to ensure high bandwidth utilization.
Owusu et al. [28] researched the challenges in fiber cable deployment in Ghana, with emphasis on the technical, regulatory, and managerial challenges and recommended the appropriate solutions. They realized that fiber cable cuts have become the single most significant cause of transmission failure or disruption to telecommunication services in Ghana with an enormous impact on the subscriber’s experience. This was due to a lack of regulatory guidelines and policies on fiber deployment and management. Findings from this research point to the fact that the majority of failures are due to external factors such as dig-ups, activities of excavators, road construction, lack of regulatory guidelines and policies on fiber deployment and management, and lack of fiber engineers with the requisite technical expertise are virtually none exists. However, there was no suggestion on how to regulate or use the utility corridor.
Muhammad et al. [29] proposed a protocol named an adaptive topology management scheme to maintain network connectivity in wireless sensor networks. In this research, they proposed a new topology management and connectivity maintenance scheme called tolerating fault and maintaining network connectivity using an array antenna (ToMaCAA) for WSNs. They also incorporated a phase array antenna into the existing topology management technologies, proving ToMaCAA to be a novel contribution. This new approach allows a node to connect to the farthest node in the network while conserving resources and energy. Moreover, data transmission is restricted to one route, reducing overheads, and conserving energy in various other nodes’ idle listening states. The output results were compared with the benchmark schemes. The output results revealed that the ToMaCAA outperformed the other schemes in terms of maintaining network connectivity during link failures and made the network more fault-tolerant and reliable. Their research did not implement ToMaCAA for mobile sensor networks. They did not develop Cluster Heads from the nodes to further conserve energy. Fiber was not used as the backbone to ensure adequate utilization of the bandwidth.
Leonardo et al. [30] presented research on the evolutionary strategy for the practical design of passive optical networks by using the genetic algorithm technique. This metaheuristic is capable of elaborating fast, automatic, and efficient solutions for the design and planning of PONs. Their proposal was developed using real maps, aiming to minimize deployment costs and time spent to carry out PON projects, achieving predefined quality criteria. In their simulation, they considered two scenarios (nondense and dense), four possible topologies, and two regions of interest. Based on the obtained results, the potential of their proposal is quite clear, as well as its relevance from a technical, economic, and commercial point of view. Based on the obtained results, the potential of their proposal was quite clear, as well as its relevance from a technical, economic, and commercial point of view. The distributed topology type 1 (DTT1) presented the lowest implantation cost, followed closely by the distributed topology type 2 (DTT2). This fact is justified due to the greater number of splitters used in the network, reducing the number of last-mile cables. It was noted that there is a clear relationship between the subscriber’s location, splitters, PON ports, and optical cables. Regarding the optical power link budget, all the solutions were found by the genetic algorithm (GA) technique. There was no actual implementation of the system.
Asgarirad and Nejati Jahromi [31] investigated a taxonomy-based comparison of FTTH network implementation costs. In their research, a review and classification of the most relevant approaches to cost reduction of FTTH implementation is done based on a novel taxonomy. In this research, optical access technology is discussed for broadband services in the form of the GPON system, installation technology, and wireless access technology. Some solutions are presented to reduce costs in implementing FTTH networks. A detailed FTTH design approach was provided for an intelligent network planning system, which minimizes the cost of network design while considering practical scenarios. Such an approach would be employed to automate the design process and produce optimal results that cannot be achieved manually. A general cost function in this study was determined as an objective function that is derived from the difference between Capital Expenditure (CAPEX) and Operational Expenditure (OPEX), respectively, and the revenues. The capital cost of the FTTH rollout was dominated by the cost of installing fiber in the distribution areas to the homes. There was no evaluation of different aspects of dual-purpose (fixed and mobile) fiber access deployment. In addition to technical and economic issues, considering marketing indicators can increase the efficiency of models. Also, there was no actual implementation of the system.
3. System Design and Methodology
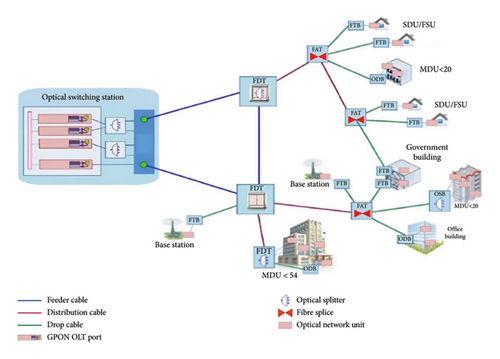
A high-level design is presented showcasing the planned routes for the OSP network and factors that will contribute to decisions making. This is followed by a low-level design, which is more detailed. The structure of the system from the OLT (source) to the optical network unit (destination) is shown in Figure 1. The nodes in between are comprised of components that will aid in the access and distribution of the fiber lines. The central switching center (CSC) is the first point in the OSP backhaul network. This center is responsible for determining the appropriate route for incoming server requests. An OLT is located here. This device is responsible for converting standard signals into the frequency and frame used by the OSP network system. Also, it is there that voice and data are multiplexed with video feed before it is sent out. Multiple feeder cables are sent out from here to FDT. The FDT is responsible for transitioning feeder cables into distribution cables. FDTs also contain a compartment at the bottom that houses buffer distribution cables for extensions and maintenance. FATs will serve as the termination point of feeder cables and the initiation point of drop cables which are then sent to the optical network units. Splitters are also installed in this system as an option considering the number of units to be served. Here, distribution cables are split before being spliced with drop cables. As an alternative to splicing, subscriber connectors can be introduced in this node, with each being the starting point of a drop cable. A fiber termination box (FTB) is used to mark the point of entry of OSP network systems into the premises of the users. For larger structures such as mid-rise, high-rise, and enterprise buildings, optical distribution frames (ODFs) will be employed.
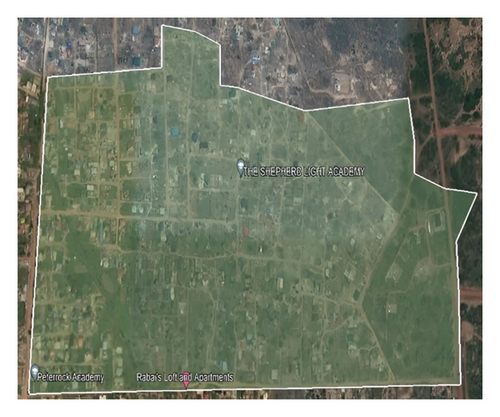
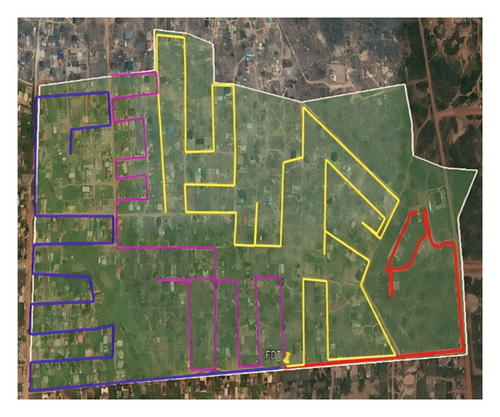
The high-level design for the area to be worked on was planned while considering some key steps. The first step was the demarcation and specification of the boundaries under consideration. The next stage was finding a key position for setting up the FDT after which the area being considered is divided into sections, with each distribution line from the FDT serving one section. This was done using the Google Earth geographical information system. The area under consideration was outlined clearly to ascertain its boundaries. In addition, existing maps of related areas were also cross-referenced to ensure close approximation. The perimeter is seen in Figure 2(a). An ideally placed FDT will minimize the workload in the routing of distribution lines while providing a smooth and safe path for the backhaul entry. The FDT was placed on the boundary opposite the OLT as shortening backhaul distance was prioritized. This is shown in Figure 2(b). Depending on the network topology and design, an FDT can have different configurations and capacities.
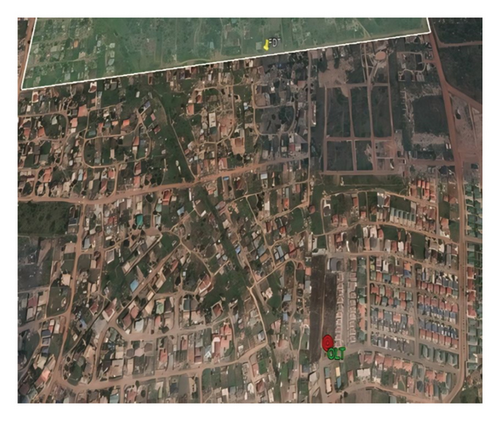
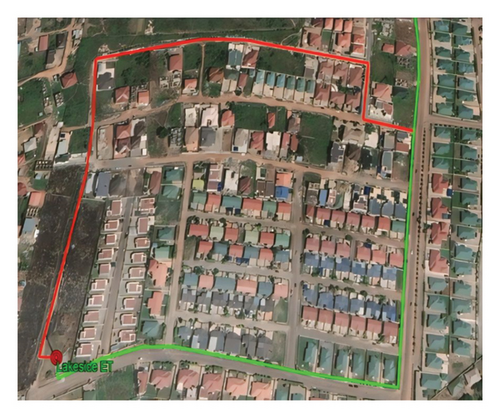
The low-level backhaul route design is initiated from the optical line terminal. Two routes were deliberated on. The first one would go out of the OLT through the eastern side of the block and up across an unsettled landscape. The other alternative was a route using the utility corridors along the main roads as shown in Figure 3(a). In the next stage, the area under consideration is divided into sections with which different distribution lines shall serve each section. This was achieved through the identification of residential clusters. After this, the distances between these clusters were found, and their mean proximity to the FDT was determined [32–34]. This will facilitate the laying and routing of cables. The final design of the low-level backhaul route design is shown in Figure 3(b).
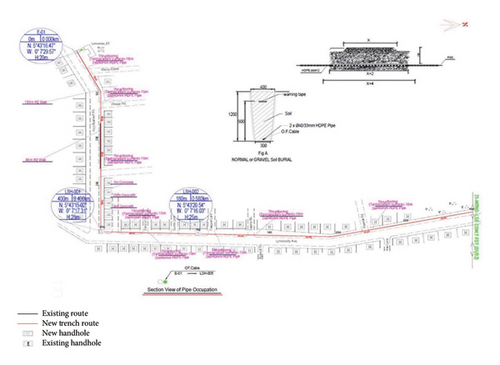
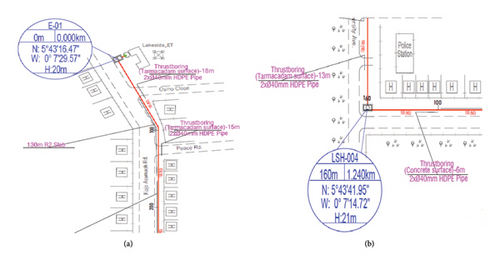
A more detailed route representation of the OSP system is shown in Figure 4. Here, the design was drawn to scale and the techniques to be used were decided. In addition, specific parameters for installations were estimated. The overall backhaul of the low-level design is shown in the Figure. The low-level design for the backhaul was done by adhering to certain general procedures, which are shown in the following. Thrustboring is done when crossing smaller intersecting roads. A low-level design (Thrustboring parameters) is shown in Figure 5(a). Handholes (vaults) were created when we came across sharp curves and at midpoint to long routes. This is shown in Figure 5(b). Trenches were also dug along the route path. Since OSP applications often use significant lengths of cables, the cables were made to order, allowing optimization for that particular installation. The cables used were designed to withstand the rigors of pressure when they are buried underground.
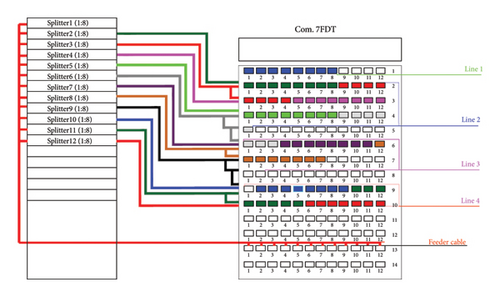
The FDT connects the optical fiber cable from the central office or the OLT to the optical network terminal (ONT) or the customer premises equipment (CPE). In selecting the right FDT and splitter for the network, we considered the network topology and layout, the capacity and demand, the budget, as well as the technical specifications and standards. The FDT’s primary function was to split feeder (backhaul) cable into 4 different distribution lines to serve the various sections of the area. However, in the event of possible future extensions, 12 cables were split and only 4 were sent out. To avoid the complexity that comes with this, splitters were arranged orderly. The feeder cable comes with 12 cores, each being served unto one (1 × 8) splitter. This divides each core into 8 cables, making up a total of 96 cores. A number of these are then bundled together to make one distribution line. The number of strands that form one distribution line is dependent on the extent of distribution, as certain areas would have a higher occupancy than others [35–37]. In an outdoor environment, the outdoor FDT is designed for the termination, splicing, and interconnection of optical cables. The enclosure is mounted to the exterior surface and connects the distribution cable and drops. The cables meet at a central connector field that includes termination for the distribution cable and drop cables. Cables are secured with standard grip clamps to provide the required pull-out strength. This is shown in Figure 6.
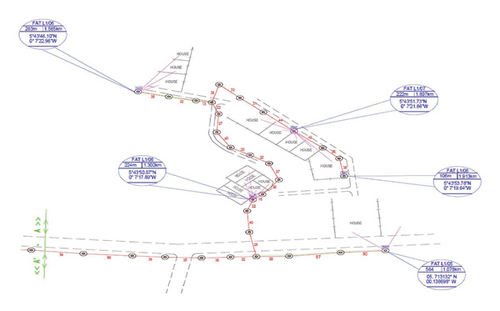
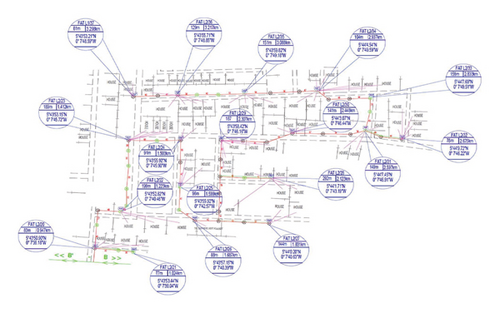
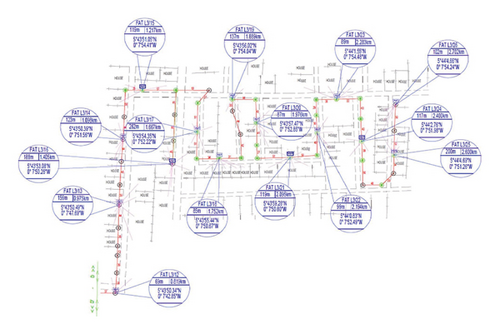
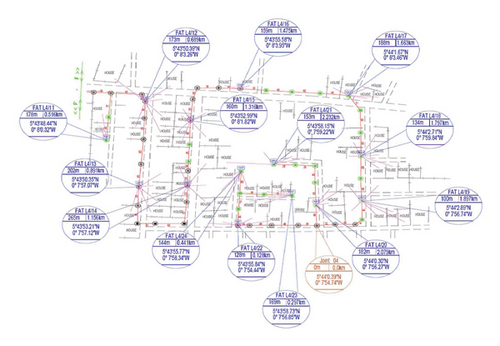
In the low-level diagram of the distribution routes, distances from each intermediate pole were measured and drawn to scale. These were not to exceed the 100 m threshold. Also, considering that the chosen route type for distribution was mainly aerial, existing poles were used to carry out this route while additional poles were mounted where needed. FATs were placed at vantage points to the residence so that termination could end there. The method for determining the locations of these FATs was through the identification of even smaller clusters in each distribution area [38–45]. This is shown in Figures 7, 8, 9, and 10.
4. System Implementation and Testing
The type of cable chosen was compatible with the installation environment and the installation process. The fibers used were protected in tubes with a water-blocking compound for protection against moisture. Surrounding the fibers are aramid strength members which provide the high pulling tension. The research was implemented in an apartment at Adregano, a suburb in Accra-Ghana as seen in Figure 8. It had 118 rooms, which were categorized into offices and guestroom facilities. Voice and data broadband services were provided by Vodafone Telecommunications Company through an extension of its network. To do this, extensive measurements were made. A workflow was designed detailing processes and subprocesses needed for the implementation of the research work. These were followed through in the administration and operational deployment of the network. With the required measurements made and various parameters collected, the core cable was relayed from the initiating pole to the utility corridors that are in line with the midrise unit. The route used was aerial. The core cable was then transitioned from aerial to underground. Beginning from the initiating pole, the first point of entry into the ground was dug. Before proceeding to other sections of the work, the backhaul cable was properly placed.
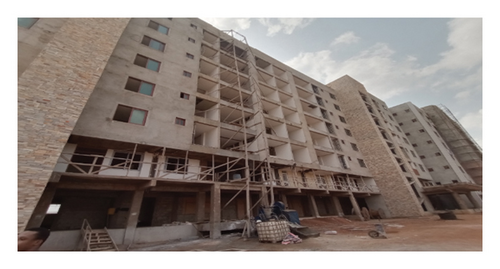
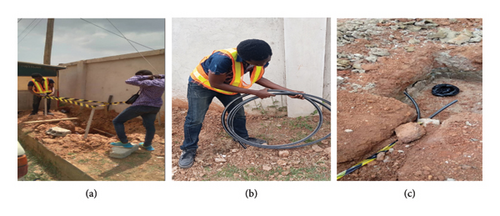
The first entry point to the ground is a chamber which serves as an entry point. Two separate splitting chambers were created. The first splitting chamber was kept for further extension. The second splitting chamber was where the actual splitting of cables in the mid-rise unit was done. The cables were further divided into two groups, the first group was sent to the residential rooms on the upper floors of the unit and the second group was sent to the office spaces located on the lower floors using optical distribution frames. The 6 core cables coming from the splitting chamber are divided into two sets, one with 4 cables and the other with 2 cables. The set of 4 core cables is then split into 4 series of 1 × 8 cables, making a total of 32. Each 1 × 8 set is placed as a joint closure into a single cable jacket. These 4 jackets are scaled up along the wall of the mid-rise unit into the server room on the upper floor. The cables in these jackets are then unveiled and placed into a set of 4 ODFs with 8 ports each, making a total of 32 ports. The server room has optical distribution frames where feeder cables are sent via trunking. Distribution and termination to the various rooms were done. In addition, results and subsequent analyses gained from the implementation phase of the project were gathered. It provides individual losses from various intermediary processes and in different feeder distribution and drop cable lines as they traverse the different components in the OSP architecture. Testing, examination, and evaluation were done to observe the extent to which certain parameters were affected. Figure 11 shows an apartment building categorized into a guestroom and offices where our cables will be installed. Figures 12(a), 12(b), and 12(c) show the dug-out of the first chamber, the coiling of the backhaul cable, and the distribution cables in the second chamber, respectively.
5. Results and Analyses
5.1. OLT Loss
5.2. FDT Loss
One can observe the order of magnitude of losses based on the optical procedure being performed; splitting has the highest effect, followed by the use of adapter connectors and then splicing. The loss of 10.5 dB in these components is within the acceptable range of typical FDT losses, which usually range between 10 and 15 dB.
5.3. Feeder Length Loss
The feeder length is the distance between the OLT and the FDT. The loss at this interval is measured in dB/km. The factor affecting this is the wavelength of propagation of the light pulses. For this research, wavelengths of 1310 and 1550 nm were used with their respective losses per kilometer being 0.35 and 0.25 dB, respectively. The loss in dB/km at a wavelength of 1550 nm was better than the loss at 1310 nm. Table 1 shows the feeder length loss at wavelengths of 1310 nm and 1550 nm respectively.
| Wavelength (nm) | Loss per kilometer (dB/km) | Measured feeder length (km) | Feeder length loss (dB) |
|---|---|---|---|
| 1310 | 0.35 | 0.080 | 0.028 |
| 1550 | 0.25 | 0.080 | 0.020 |
5.4. Total Loss From the Feeder Section
5.5. FAT Loss
5.6. Distribution Length Loss
The distribution length loss was calculated using the loss per kilometer of the two wavelengths used and the measured length of each individual distribution cable. The product is then taken as the distribution length of that line. Tables 2, 3, 4, and 5 show the distribution length losses for the first, second, third, and fourth feeder cables, which were divided into 19, 18, 21, and 22 distribution lines, respectively, with each feeding into different FATs.
| Distribution cable no. | Length (km) | Distribution length loss (1310 nm) (dB) | Distribution length loss (1550 nm) (dB) |
|---|---|---|---|
| 1 | 0.075 | 0.0263 | 0.0188 |
| 2 | 0.264 | 0.0924 | 0.0660 |
| 3 | 0.315 | 0.1103 | 0.0788 |
| 4 | 0.403 | 0.1411 | 0.1008 |
| 5 | 0.545 | 0.1908 | 0.1363 |
| 6 | 0.677 | 0.2370 | 0.1693 |
| 7 | 0.823 | 0.2881 | 0.2058 |
| 8 | 1.044 | 0.3654 | 0.2610 |
| 9 | 1.217 | 0.4260 | 0.3043 |
| 10 | 1.413 | 0.4946 | 0.3533 |
| 11 | 1.573 | 0.5506 | 0.3933 |
| 12 | 1.828 | 0.6398 | 0.4570 |
| 13 | 1.987 | 0.6955 | 0.4968 |
| 14 | 2.123 | 0.7431 | 0.5308 |
| 15 | 2.300 | 0.8050 | 0.5750 |
| 16 | 2.449 | 0.8572 | 0.6123 |
| 17 | 2.640 | 0.9240 | 0.6600 |
| 18 | 2.820 | 0.9870 | 0.7050 |
| 19 | 3.020 | 1.0570 | 0.7550 |
| Distribution cable no. | Length (km) | Distribution length loss (1310 nm) (dB) | Distribution length loss (1550 nm) (dB) |
|---|---|---|---|
| 1 | 0.158 | 0.0554 | 0.0396 |
| 2 | 0.375 | 0.1311 | 0.0937 |
| 3 | 0.532 | 0.1862 | 0.1330 |
| 4 | 0.616 | 0.2157 | 0.1541 |
| 5 | 0.705 | 0.2468 | 0.1763 |
| 6 | 0.856 | 0.2994 | 0.2139 |
| 7 | 0.963 | 0.3370 | 0.2407 |
| 8 | 1.125 | 0.3937 | 0.2812 |
| 9 | 1.273 | 0.4454 | 0.3181 |
| 10 | 1.438 | 0.5031 | 0.3594 |
| 11 | 1.545 | 0.5407 | 0.3862 |
| 12 | 1.660 | 0.5811 | 0.4151 |
| 13 | 1.778 | 0.6224 | 0.4446 |
| 14 | 1.890 | 0.6616 | 0.4726 |
| 15 | 2.003 | 0.7011 | 0.5008 |
| 16 | 2.091 | 0.7317 | 0.5227 |
| 17 | 2.249 | 0.7870 | 0.5621 |
| 18 | 2.346 | 0.8210 | 0.5864 |
| Distribution cable no. | Length (km) | Distribution length loss (1310 nm) (dB) | Distribution length loss (1550 nm) (km) |
|---|---|---|---|
| 1 | 0.802 | 0.2806 | 0.2004 |
| 2 | 0.960 | 0.3359 | 0.2399 |
| 3 | 1.128 | 0.3949 | 0.2821 |
| 4 | 1.308 | 0.4577 | 0.3269 |
| 5 | 1.435 | 0.5021 | 0.3586 |
| 6 | 1.558 | 0.5452 | 0.3894 |
| 7 | 1.742 | 0.6097 | 0.4355 |
| 8 | 2.051 | 0.7180 | 0.5128 |
| 9 | 2.240 | 0.7841 | 0.5601 |
| 10 | 2.389 | 0.8360 | 0.5972 |
| 11 | 2.654 | 0.9290 | 0.6636 |
| 12 | 2.843 | 0.9950 | 0.7107 |
| 13 | 2.981 | 1.0433 | 0.7452 |
| 14 | 3.108 | 1.0878 | 0.7770 |
| 15 | 3.220 | 1.1270 | 0.8050 |
| 16 | 3.415 | 1.1951 | 0.8537 |
| 17 | 3.569 | 1.2490 | 0.8921 |
| 18 | 3.708 | 1.2976 | 0.9269 |
| 19 | 3.812 | 1.3341 | 0.9530 |
| 20 | 3.960 | 1.3858 | 0.9899 |
| 21 | 4.150 | 1.4525 | 1.0375 |
| Distribution cable no. | Length (km) | Distribution length loss (1310 nm) (dB) | Distribution length loss (1550 nm) (km) |
|---|---|---|---|
| 1 | 1.509 | 0.5280 | 0.3772 |
| 2 | 1.597 | 0.5590 | 0.3993 |
| 3 | 1.720 | 0.6020 | 0.4300 |
| 4 | 1.895 | 0.6634 | 0.4739 |
| 5 | 2.028 | 0.7099 | 0.5071 |
| 6 | 2.154 | 0.7537 | 0.5384 |
| 7 | 2.225 | 0.7788 | 0.5563 |
| 8 | 2.398 | 0.8394 | 0.5996 |
| 9 | 2.573 | 0.9004 | 0.6431 |
| 10 | 2.721 | 0.9522 | 0.6802 |
| 11 | 2.894 | 1.0127 | 0.7234 |
| 12 | 3.072 | 1.0751 | 0.7680 |
| 13 | 3.174 | 1.1109 | 0.7935 |
| 14 | 3.363 | 1.1771 | 0.8408 |
| 15 | 3.530 | 1.2356 | 0.8826 |
| 16 | 3.702 | 1.2957 | 0.9255 |
| 17 | 3.831 | 1.3409 | 0.9578 |
| 18 | 4.048 | 1.4169 | 1.0121 |
| 19 | 4.252 | 1.4883 | 1.0631 |
| 20 | 4.345 | 1.5209 | 1.0863 |
| 21 | 4.521 | 1.5822 | 1.1302 |
| 22 | 4.743 | 1.6602 | 1.1859 |
Figure 13 displays the loss for both 1310 nm and 1550 nm given the length of distribution cables. As seen from the graph, the relation is linear, with increase in loss being proportional to distance. It was observed that the total distribution loss between the shortest and the longest length in kilometers for the distribution cable lines was 1.0307 dB at 1310 nm wavelength and 0.7362 dB at a wavelength of 1550 nm, respectively. Total loss at different distribution lengths at a wavelength of 1550 nm was better than the total loss at a wavelength of 1310 nm.
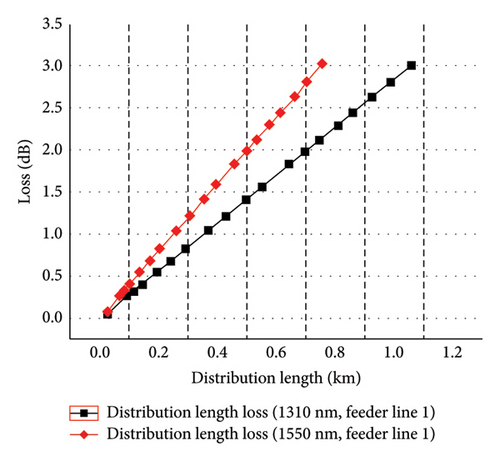
Figure 14 displays the loss for both 1310 and 1550 nm given the length of distribution cables. The graph shows that the relation is linear, with an increase in loss proportional to distance. It was observed that the total distribution loss between the shortest and the longest length in kilometers for the distribution cable lines was 0.7656 dB at a 1310 nm wavelength and 0.5468 dB at a wavelength of 1550 nm, respectively. Total loss at different distribution lengths at a wavelength of 1550 nm was better than the total loss at a wavelength of 1310 nm.
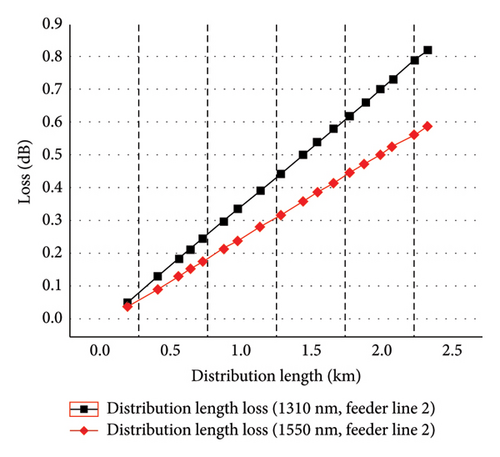
Figure 15 displays the loss for both 1310 and 1550 nm given the length of distribution cables. As seen from the graph, the relation is linear, with an increase in loss being proportional to distance. It was observed that the total distribution loss between the shortest and the longest length in kilometers for the distribution cable lines was 1.1719 dB at a 1310 nm wavelength and 0.8371 dB at a wavelength of 1550 nm, respectively. Total loss at different distribution lengths at a wavelength of 1550 nm was better than the total loss at a wavelength of 1310 nm.
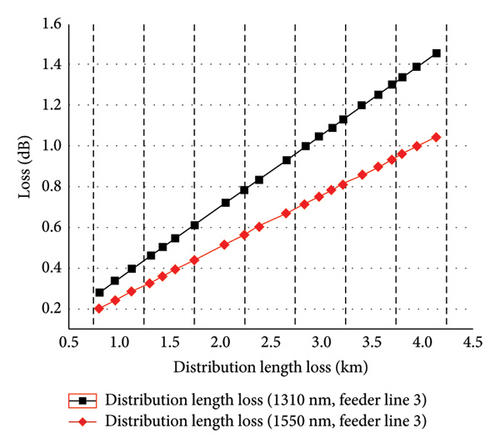
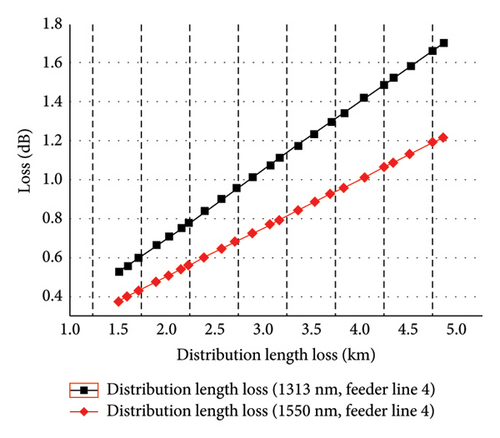
Figure 16 displays the loss for both 1310 and 1550 nm given the length of distribution cables. As seen from the graph, the relation is linear, with an increase in loss being proportional to distance. It was observed that the total distribution loss between the shortest and the longest length in kilometers for the distribution cable lines was 1.1322 dB at 1310 nm wavelength and 0.8087 dB at a wavelength of 1550 nm, respectively. Total loss at different distribution lengths at a wavelength of 1550 nm was better than the total loss at a wavelength of 1310 nm.
5.7. Total Loss From Feeder and Distribution Section
| Distribution cable no. | Total length (km) | Feeder and distribution loss (1310 nm) (dB) | Feeder and distribution loss (1550 nm) (dB) |
|---|---|---|---|
| 1 | 0.155 | 22.85 | 22.84 |
| 2 | 0.344 | 22.92 | 22.89 |
| 3 | 0.395 | 22.94 | 22.90 |
| 4 | 0.483 | 22.97 | 22.92 |
| 5 | 0.625 | 23.02 | 22.96 |
| 6 | 0.757 | 23.06 | 22.99 |
| 7 | 0.903 | 23.12 | 23.03 |
| 8 | 1.124 | 23.19 | 23.08 |
| 9 | 1.297 | 23.25 | 23.12 |
| 10 | 1.493 | 23.32 | 23.17 |
| 11 | 1.653 | 23.38 | 23.21 |
| 12 | 1.908 | 23.47 | 23.28 |
| 13 | 2.067 | 23.52 | 23.32 |
| 14 | 2.203 | 23.57 | 23.35 |
| 15 | 2.38 | 23.63 | 23.39 |
| 16 | 2.529 | 23.69 | 23.43 |
| 17 | 2.72 | 23.75 | 23.48 |
| 18 | 2.9 | 23.82 | 23.53 |
| 19 | 3.1 | 23.88 | 23.57 |
| Distribution cable no. | Total length (km) | Feeder distribution loss (1310 nm) (dB) | Feeder distribution loss (1550 nm) (dB) |
|---|---|---|---|
| 1 | 0.2384 | 22.88 | 22.86 |
| 2 | 0.4546 | 22.96 | 22.91 |
| 3 | 0.612 | 23.01 | 22.95 |
| 4 | 0.6963 | 23.04 | 22.97 |
| 5 | 0.7852 | 23.07 | 23.00 |
| 6 | 0.9355 | 23.13 | 23.03 |
| 7 | 1.0428 | 23.16 | 23.06 |
| 8 | 1.2048 | 23.22 | 23.10 |
| 9 | 1.3525 | 23.27 | 23.14 |
| 10 | 1.5175 | 23.33 | 23.18 |
| 11 | 1.6249 | 23.37 | 23.21 |
| 12 | 1.7403 | 23.41 | 23.24 |
| 13 | 1.8584 | 23.45 | 23.26 |
| 14 | 1.9703 | 23.49 | 23.29 |
| 15 | 2.0832 | 23.53 | 23.32 |
| 16 | 2.1706 | 23.56 | 23.34 |
| 17 | 2.3285 | 23.61 | 23.38 |
| 18 | 2.4256 | 23.65 | 23.41 |
| Distribution cable no. | Total length (km) | Feeder distribution loss (1310 nm) (dB) | Feeder distribution loss (1550 nm) (dB) |
|---|---|---|---|
| 1 | 0.8816 | 23.11 | 23.02 |
| 2 | 1.0397 | 23.16 | 23.06 |
| 3 | 1.2084 | 23.22 | 23.10 |
| 4 | 1.3877 | 23.29 | 23.15 |
| 5 | 1.5145 | 23.33 | 23.18 |
| 6 | 1.6376 | 23.37 | 23.21 |
| 7 | 1.8221 | 23.44 | 23.26 |
| 8 | 2.1313 | 23.55 | 23.33 |
| 9 | 2.3204 | 23.61 | 23.38 |
| 10 | 2.4686 | 23.66 | 23.42 |
| 11 | 2.7343 | 23.76 | 23.48 |
| 12 | 2.9229 | 23.82 | 23.53 |
| 13 | 3.0609 | 23.87 | 23.57 |
| 14 | 3.1881 | 23.92 | 23.60 |
| 15 | 3.3 | 23.96 | 23.63 |
| 16 | 3.4947 | 24.02 | 23.67 |
| 17 | 3.6485 | 24.08 | 23.71 |
| 18 | 3.7875 | 24.13 | 23.75 |
| 19 | 3.8918 | 24.16 | 23.77 |
| 20 | 4.0395 | 24.21 | 23.81 |
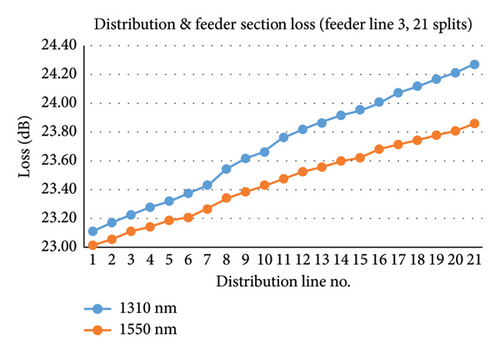
| 21 | 4.2301 | 24.28 | 23.86 |
| Distribution cable no. | Total length (km) | Feeder distribution loss (1310 nm) (dB) | Feeder distribution loss (1550 nm) (dB) |
|---|---|---|---|
| 1 | 1.589 | 23.36 | 23.20 |
| 2 | 1.677 | 23.39 | 23.22 |
| 3 | 1.8001 | 23.43 | 23.25 |
| 4 | 1.9754 | 23.49 | 23.29 |
| 5 | 2.1083 | 23.54 | 23.33 |
| 6 | 2.2335 | 23.58 | 23.36 |
| 7 | 2.305 | 23.61 | 23.38 |
| 8 | 2.4783 | 23.67 | 23.42 |
| 9 | 2.6525 | 23.73 | 23.46 |
| 10 | 2.8007 | 23.78 | 23.50 |
| 11 | 2.9735 | 23.84 | 23.54 |
| 12 | 3.1518 | 23.90 | 23.59 |
| 13 | 3.254 | 23.94 | 23.61 |
| 14 | 3.4431 | 24.01 | 23.66 |
| 15 | 3.6102 | 24.06 | 23.70 |
| 16 | 3.7819 | 24.12 | 23.75 |
| 17 | 3.9112 | 24.17 | 23.78 |
| 18 | 4.1284 | 24.24 | 23.83 |
| 19 | 4.3323 | 24.32 | 23.88 |
| 20 | 4.4253 | 24.35 | 23.91 |
| 21 | 4.6006 | 24.41 | 23.95 |
| 22 | 4.8234 | 24.49 | 24.01 |
| 23 | 4.9415 | 24.53 | 24.04 |
| 24 | 3.1953 | 23.92 | 23.60 |
| 25 | 3.3813 | 23.98 | 23.65 |
| 26 | 3.4998 | 24.02 | 23.67 |
| 27 | 3.5831 | 24.05 | 23.70 |
| 28 | 3.8141 | 24.13 | 23.75 |
| 29 | 4.804 | 24.48 | 24.00 |
| 30 | 4.1897 | 24.27 | 23.85 |
| 31 | 4.3073 | 24.31 | 23.88 |
| 32 | 5.2496 | 25.64 | 25.11 |
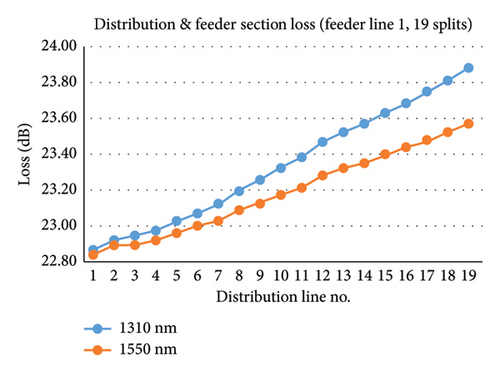
In Figure 17, we noticed a steady increase in loss from one distribution line to the next. This is due to the fact that these distribution lines were arranged in an increasing order of distance. Thus, an increase in distance reflects a corresponding increase in loss. It was observed that the total loss from the feeder line 1 and distribution section was 1.030 dB at 1310 nm wavelength and 0.73 dB at a wavelength of 1550 nm. Given that the two wavelengths have separate loss-to-distance ratios, it is seen that the 1550 nm wavelength experiences a lower loss as compared with the 1310 nm wavelength.
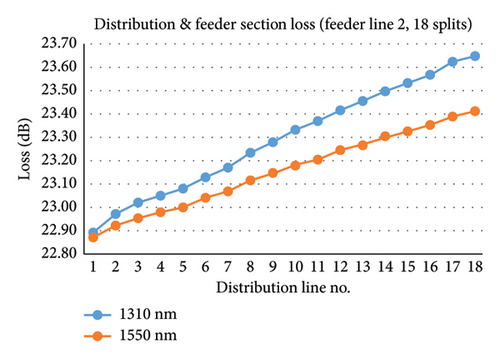
In Figure 18, one can notice the steady increase in loss from one distribution line to the next. This is due to the fact that these distribution lines were arranged in an increasing order of distance. Thus, an increase in distance reflects a corresponding increase in loss. It was observed that the total loss from the feeder line 2 and distribution section was 0.77 dB at 1310 nm wavelength and 0.55 dB at a wavelength of 1550 nm. Given that the two wavelengths have separate loss-to-distance ratios, it is seen that the 1550 nm wavelength experiences a lower loss as compared with the 1310 nm wavelength.
In Figure 19, one can notice the steady increase in loss from one distribution line to the next. This is due to the fact that these distribution lines were arranged in an increasing order of distance. Thus, an increase in distance reflects a corresponding increase in loss. It was observed that the total loss from the feeder line 3 and distribution section was 1.17 dB at 1310 nm wavelength and 0.84 dB at a wavelength of 1550 nm. Given that the two wavelengths have separate loss-to-distance ratios, it is seen that the 1550 nm wavelength experiences a lower loss as compared with the 1310 nm wavelength.
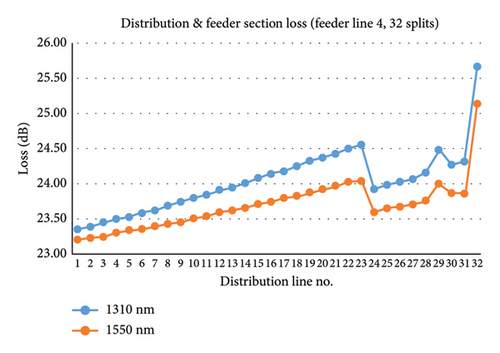
In Figure 20, one can notice a sharp slope in loss from distribution lines 23–24. This was due to the change in cable distance from 4.862 to 3.115 km. The somewhat linear relation is broken here and as distances approach the 5 km mark, there is a sharp increase in loss due to the redundancy factor as seen in distribution line 32. Given that the two wavelengths have separate loss-to-distance ratios, it is seen that the 1550 nm wavelength experiences a lower loss as compared with the 1310 nm wavelength. It was observed that the total loss from the feeder line 4 and distribution section was 2.28 dB at 1310 nm wavelength and 1.91 dB at a wavelength of 1550 nm.
5.8. Fiber Access Terminal Power Analyses
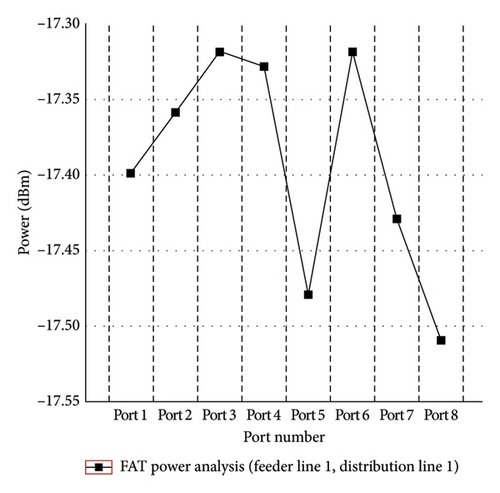
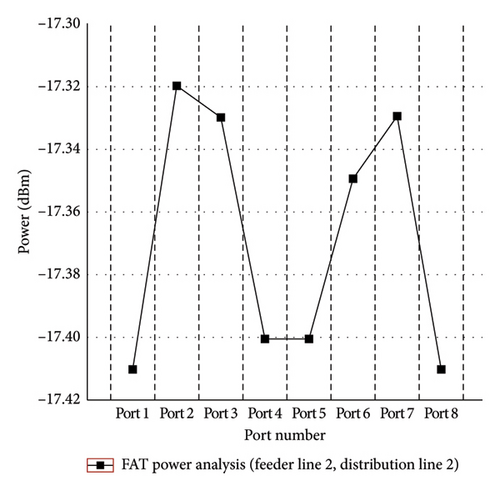
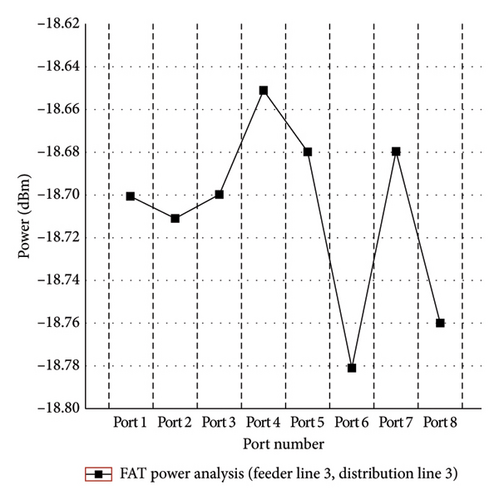
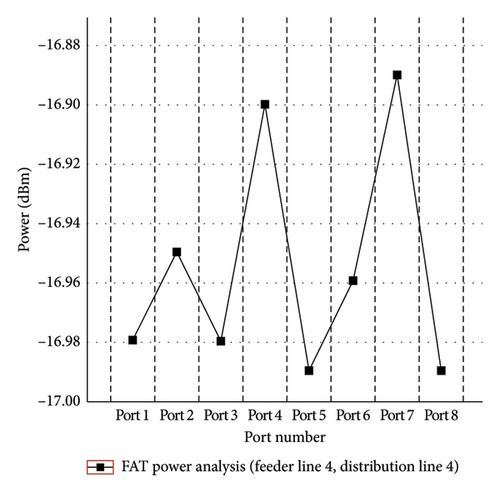
Splitting feeder cables into drop cables requires power measurements that correlate to the individual intensities of light from the ports into the drop cables. After a distribution cable is placed into the FAT input port via a fiber adapter, power from the output ports is measured. Table 10 shows the FAT power analyses for feeder lines 1, 2, 3, and 4 and distribution lines 1, 2, 3, and 4, respectively. FAT number 1 and FAT number 2 have no splice joint on the route between the OLT and the splitters (distribution point). The FAT numbers 1 and 2 (splitter) were installed 300 m away from the OLT point hence the required outputs (dB) power level was achieved at the customer’s end. The FAT number 3 was installed 650 km from the OLT. The lower power level is due to the distance and splice losses at the splice joint point. There was an improvement in the power level for FAT number 4. This is because FAT 4 (splitter) was installed 150 km from the OLT. This happened due to the late request for internet service by the customer. The variations in individual power levels (dBm) of FAT numbers 1, 2, 3, and 4 were due to the customer’s location. The power levels (dBm) obtained were all within the acceptable threshold.
| FAT number 1 | FAT number 2 | FAT number 3 | FAT number 4 | ||||
|---|---|---|---|---|---|---|---|
| Port number | Power (dBm) | Port number | Power (dBm) | Port number | Power (dBm) | Port number | Power (dBm) |
| Port 1 | −17.40 | Port 1 | −17.41 | Port 1 | −18.70 | Port 1 | −16.98 |
| Port 2 | −17.36 | Port 2 | −17.32 | Port 2 | −18.71 | Port 2 | −16.95 |
| Port 3 | −17.32 | Port 3 | −17.33 | Port 3 | −18.70 | Port 3 | −16.98 |
| Port 4 | −17.33 | Port 4 | −17.40 | Port 4 | −18.65 | Port 4 | −16.90 |
| Port 5 | −17.48 | Port 5 | −17.40 | Port 5 | −18.68 | Port 5 | −16.99 |
| Port 6 | −17.32 | Port 6 | −17.35 | Port 6 | −18.78 | Port 6 | −16.96 |
| Port 7 | −17.43 | Port 7 | −17.33 | Port 7 | −18.68 | Port 7 | −16.89 |
| Port 8 | −17.51 | Port 8 | −17.41 | Port 8 | −18.76 | Port 8 | −16.99 |
Figures 21(a), 21(b), 21(c), and 21(d) illustrate the FAT power analyses for feeder lines 1, 2, 3, and 4 and distribution lines 1, 2, 3, and 4, respectively.
The increasing demand for higher bandwidth will shape the future of fiber optic communication. This is because there is an increased demand for faster and more reliable internet connections. The continued expansion of 5G networks is one prediction for the future of fiber optic technology. Since fiber optic cables are used in 5G networks to transmit data at high speeds and with low latency, it is expected that more fiber optic cables will be deployed to support these networks. There are several emerging technologies and trends that will reshape the landscape of fiber optics in the near future. Space division multiplexing, quantum networks, multicore fibers, fiber-to-the-everything, etc. are some of the emerging technologies that are heavily reliant on fiber optics to provide the necessary backhaul for high-bandwidth, low-latency communications. The development of new fiber optic materials and technologies will also allow faster data transmission and promise a more advanced long-term future. These emerging trends highlight the fact that the future of OSP networks will be shaped by innovations aimed at increasing bandwidth, improving resilience, and reducing costs. As fiber optic technology continues to advance, OSP infrastructure will have to adapt to the data-driven world.
The environmental impacts and economic implications of implementing high-performance fiber networks through OSP installations are significant and must be carefully managed. Developing more energy-efficient transmission methods, recyclable fiber materials, and greener installation practices is a key focus as fiber optics installation is becoming increasingly concerned with environmental sustainability. The successful deployment of high-performance fiber networks through OSP infrastructure requires a balance between economic viability and environmental stewardship. Deploying fiber optic networks involves significant upfront capital expenditures, especially for OSP installations that require laying fiber underground, installing poles, and upgrading existing infrastructure. To overcome these challenges, it is suggested that the government should provide an innovative financing model. Also, there should be public–private partnerships to make fiber network deployments more economically feasible. High-performance fiber optic networks will drive economic growth by enabling faster internet access that will support industries, e-commerce, telemedicine, education, and remote work that will drive the economy. The deployment of OSP networks will create jobs for people. Maintaining and operating OSP infrastructure after the installation can be challenging due to both the complexity of the fiber optic networks and the environmental factors that can affect their performance. To ensure optimum performance of the system, regular inspection of vulnerable areas, regular inspection of OSP components, network monitoring, detection of faults, and upgrade of OSP infrastructure are required.
6. Conclusion and Recommendation
In this research, we proposed an approach to tackle the problem associated with improper planning and design of passive OSP routes on utility corridors. In our research, we focused on a method of utilizing the utility pathways or corridors available for service providers such as Vodafone, MTN, AirtelTigo, Ghana Electricity Company, and Ghana Water Company. We focus predominantly on a novel method of enabling safe, undeterred, and cost-effective OSP fiber optic installations that will allow easy fiber system upgrades and tidy the utility corridors. There was a high-level design to deal with the general survey of the area to be worked on. This helped to demarcate the boundaries and the location of the FDT. The low-level design was initiated from the optical line terminal. The area under consideration was divided into sections with which different distribution lines were served. The high-level design for the area to be worked on was planned while taking into consideration some key steps. To demonstrate our methodology, we provided FTTP to an apartment located in the capital city of Ghana. The fiber cables used for this implementation provided high bandwidth utilization. From the results of the research, it was observed that there was a loss in signal power as distance increased. Also, signal loss at a wavelength of 1550 nm was better than signal loss at 1310 nm. However, the steadiness of loss with respect to distance is to an extent influenced by the quality of the route. Our research revealed a balanced loss of 0.35 dB/km for 1310 nm wavelengths and 0.25 dB/km for 1550 nm. Also, losses across distances brought about by splitting and subsequent splicing of feeder cables into distribution cables were reduced significantly. This was done through the coherent organization of splitters in the FDT. The OLT loss was 0.7 dB, FDT loss was 10.5 dB, FAT loss was 10.6 dB, and total loss from feeder sections at wavelengths of 1310 and 1550 nm were 11.228 and 11.220 dB respectively. The total distribution length loss for core cables 1, 2, 3, and 4 at wavelengths of 1310 nm were 1.0307, 0.76556, 1.1719, and 1.1322 dB, respectively. The total distribution length loss for core cables 1, 2, 3, and 4 at wavelengths of 1550 nm were 0.7362, 0.5468, 0.837, and 0.8087 dB, respectively. The FAT power analyses for feeder lines 1, 2, 3, and 4 and distribution lines 1, 2, 3, and 4, respectively, were determined. The average power (dBm) for the FAT lines 1, 2, 3, and 4 were −17.39, −17.37, 18.71, and −16.96 dBm, respectively. The FAT power (dBm) for feeder lines 1, 2, 3, and 4 and distribution lines 1, 2, 3, and 4, respectively, were all within the acceptable range. We managed to decrease the mean deviation to 0.0845 dB across all FATs. The limitations of the research include high equipment and material costs, complexity of implementation, geographical challenges, and regulatory and permit issues. It is also recommended that for future research directions, there should be integration with emerging technologies, ensure compatibility and efficiency, deploy new fiber optic materials that will offer higher bandwidth and lower attenuation, utilize nanotechnology to create more efficient and durable cabling solutions, and provide more efficient, resilient, and cost-effective telecommunication solutions. Artificial intelligence could be used in the design process of the routes. Training a model with the needed amount of data would leverage human workload with computational capacity, accelerating the design process and overall operation of OSP installations.
Conflicts of Interest
The authors declare no conflicts of interest.
Funding
This research was self-funded.
Acknowledgments
Isaac Adjaye Aboagye is grateful to Mr. Emmanuel Baah Boadi of Stepworth Limited for his support and guidance.
Open Research
Data Availability Statement
All the data obtained from the research have been added to the paper.


