Sustainable Alternatives in Construction: Repurposed Waste LLDPE Plastic and Kaolin Clay Composites as Cementless Binders
Abstract
Cement is a prominent binder material in the construction industry. Its production releases harmful gases and is a major contributor to CO2 emissions. The rising global waste plastic generation has negative ecological and environmental impacts. Repurposing waste plastic and exploring its binding properties for construction products would reduce reliance on cement, promote the circular economy, and reduce waste. This study explores an innovative approach to utilize repurposed linear low-density polyethylene (LLDPE) waste plastics as a binding material for manufacturing novel composite blocks, promoting sustainable construction practices in alignment with circular economy principles. Through extrusion techniques, repurposed LLDPE waste plastic was combined with kaolin clay in varying mix proportions of 1:1, 1:2, and 1:3. Comparative blocks were also produced using similar cement and kaolin clay mix proportions. The research systematically examined the impact of different mix proportions on density, compressive strength, flexural strength, tensile strength, water absorption characteristics, and microstructure analysis of the resultant composites. Extensive comparisons were drawn between the properties of repurposed LLDPE waste plastic and kaolin clay composites against those of cement and kaolin clay composites. The result revealed that the repurposed LLDPE waste plastic composite exhibited optimal compressive strength when mixed in a ratio of 1:2, which was superior to the cement composite’s performance and demonstrated superior tensile splitting and flexural strength compared to the cement binder composite. The strength values of repurposed LLDPE waste plastic composites significantly met the stringent requirements for load-bearing blocks according to both BS EN 771-3:2011 and ASTM C90 standards. Furthermore, the water absorption properties were distinctly favorable for the repurposed LLDPE waste plastic composites, consistently registering less than 1%, while the cement composites exhibited values exceeding 2%. These results demonstrate the potential of using waste plastic as a binder in building materials and aid in creating creative and sustainable building materials.
1. Introduction
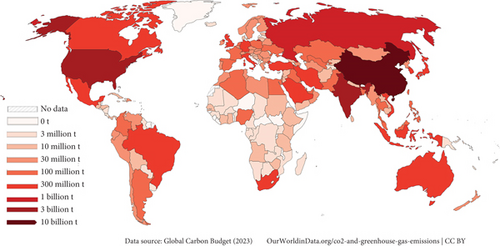
Concrete masonry units (CMUs), sometimes called concrete blocks, are among the most common building materials. They are typically employed in the walls and foundations of low-rise buildings. Concrete blocks come in various forms, such as pavement blocks, hollow concrete blocks, and solid concrete blocks. Nevertheless, cement is the primary binder for concrete block composites [1]. Between 2005 and 2020, cement production grew dramatically at an average annual growth rate of 2.5%, from 2.3 Giga tons (Gt) to 3.5 Gt. By 2050, experts predict that its production will range from 3.7 to 4.4 Gt [2]. Nevertheless, cement is the third-biggest energy consumer after aluminum and steel manufacturing [3]. One ton of cement is required to produce approximately 1.6 tons of raw materials, mainly limestone and clay, and 110 kWh of electrical energy [4, 5]. Furthermore, the cement industry surpasses the power generation sector as the second-highest contributor to carbon dioxide (CO2) emissions [6, 7]. There are predictions that between 800 and 1000 kg of CO2 will be released into the atmosphere in order to make 1 ton of cement [8, 9]. From the middle of the 18th century to the present, Figure 1 displays the total annual CO2 emissions, indicated in tons, from the use of fossil fuels and the production of cement. China is the world’s top producer, followed by the United States, Russia, and India.
Additionally, different binders are being examined when employing industrial and agricultural waste for environmentally acceptable and sustainable building materials like fly ash [11], bagasse ash and silica fume [12], palm kernel shell [13], rice husk ash [14], and kaolin clay [15]. Kaolin is a natural clay mineral in white or brown powdery form. Its major constituent is kaolinite, which contains hydrous aluminum silicate (Al2O3.2SiO2.H2O) [16]. Kaolin is a popular clay with several uses, including cracking catalysts, paint extenders, paper coating and fillers in composite manufacture, ceramics, rubber and plastic fillers [15], effluent water treatment, solid catalyst manufacture, and a partial replacement of cement in concrete [17, 18].
Despite this, efficient solid waste management is still a major and ongoing problem, particularly in the urban agglomerations of developing and poor nations across the globe. One kind of solid waste that has drawn attention on a national and international level is plastic waste. Reducing waste is essential to minimizing the impact on the environment and reaching goals related to sustainable development and the circular economy [19–21]. In order to address several concerns about socioeconomic development, the environment, and technological advancement, the UN created 17 sustainability goals in 2015 [22]. One of these objectives is Sustainable Development Goal 12 (SDG-12: Responsible Consumption and Production), which places a strong emphasis on minimizing, recycling, and reusing trash in addition to taking preventive action [23, 24].
Several events throughout the 20th and early 21st centuries, together with compilations of waste research, demonstrate that waste, in all its forms, whether solid, liquid, or toxic, has emerged as a significant consequence of modernization and economic development [25]. The World Bank states that cities worldwide generated an astonishing 2.01 billion tons of solid waste in 2016. Moreover, a significant increase of 70% in annual waste production over the 2016 figure is expected to be achieved, reaching an astonishing 3.40 billion tons by 2050 [26]. Specifically, in 1960, global plastic production was approximately 7000 tons, which increased to 300 million tons by 2015 [27].
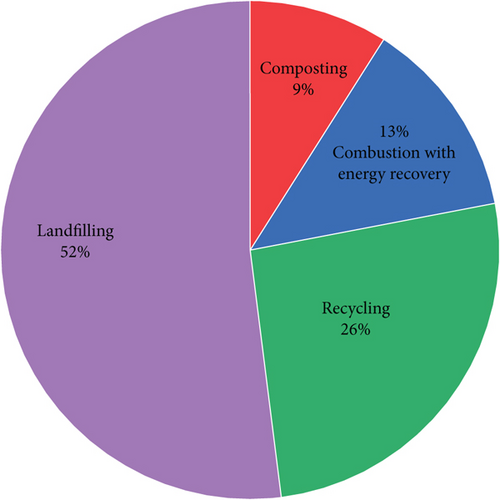
Managing solid waste effectively is still a significant and ongoing concern, particularly in the urban agglomerations of emerging and poor nations across the globe. One kind of solid waste that has drawn attention on a national and international level is plastic waste. Industrial trash made of plastic has nonbiodegradable qualities and takes hundreds of years to degrade fully [28]. Linear low-density polyethylene (LLDPE) is one of the different types of plastic. It is commonly used for aluminum packaging, water packaging, trays, jars, pun nets, plastic bags, garbage, plastic beverage bottles, bags, carry-out bags, agricultural and commercial films, industrial sheeting, toys, housewares, pipes, etc. [28–31]. However, the widespread disposal and ineffective management of the produced plastic waste have become a global issue [32–34]; this is especially true in developing nations, where ineffective waste management systems, low collection rates, and inadequate recycling infrastructure exacerbate the problem [35, 36]. There is a growing attention among researchers to using plastic waste as construction materials. Figure 2 shows a scenario of plastic waste management, which shows that more than half of the plastic waste is disposed of in landfilling.
Several research studies have used waste plastic to partially replace fine and coarse aggregate in concrete and modify bitumen binder in asphalt. For example, Ahmad and Ahmad [38] modified bitumen binder with waste polyethylene terephthalate (PET) plastic. They reported that the modified bitumen containing waste PET plastic showed improved crack resistance and permanent deformation. The research was carried out by Olofinnade et al. [35] using waste plastics made of LLDPE and high-impact polystyrene (HIPS) as aggregates in concrete mixes. The sand was replaced with waste plastic components at proportions of 0%, 10%, 30%, and 50%. The results showed that as the amount of waste plastic in the concrete mixture increased, the concrete’s density decreased. Despite this, used plastic has a density of about 70% lower than sand, significantly reducing the concrete mix’s overall density. Although adding waste plastic reduces hardened concrete, the mixes are still suitable for lightweight structural concrete construction.
Using plastic waste from polypropylene (PP) and LLDPE, experimental research on the concrete characteristics was conducted by Visweswara Sastry Dhara and Kumar [39]. The results showed a reduction in the flexural strength of the concrete mix at all replacement levels due to the incorporation of plastic waste. However, concrete containing waste PP exhibited superior flexural strength compared to that with waste LLDPE. This performance difference is attributed to the higher tensile strength of PP plastic relative to LLDPE plastic. A mix with 5% PP replacing fine aggregates demonstrated an 18% decrease in flexural strength compared to the control. Despite this, the standard mix was significantly outperformed by concrete containing 5% and 10% PP plastic waste and 5% LLDPE plastic waste, achieving increased flexural strength of 18%, 38%, and 41%, respectively. The flexural strength decreased as the proportion of plastic waste increased, accompanied by reduced fine aggregate content [39]. A similar trend with compressive strength was observed, as the flexural strength of the concrete mix was reduced by adding plastic waste aggregate to the concrete. However, an eco-friendly concrete mix with 10% PET plastic waste as sand replacement indicated lesser variation from conventional concrete. Beyond the 20% replacement level, a 10% decline in flexural strength was recorded. It was indicated that the decreasing trend was caused by a weaker plastic aggregate and inadequate adhesion between the surfaces of the plastic aggregate and the cement paste. Similarly, the incorporation of waste plastic into concrete reduces splitting tensile strength, mirroring the trends observed in compressive and flexural strength. As the proportion of plastic waste in the concrete mix increased, the splitting tensile strength progressively declined. This might be due to the differences in aggregate stiffness and shape. It was noted that sand has a stiff and round shape, while PET aggregate is a plane with an angular shape and smooth surface [40]. Research work was performed by Choi et al. [41] to enhance the strength properties of concrete incorporating PET plastic as a substitute for aggregate, and the PET plastic was pretreated with granulated blast furnace slag (GBFS), ensuring the plastic aggregate’s surface was adequately coated. The treated PET plastic was then used as a fine aggregate replacement in concrete mixes at substitution levels of 0%, 25%, 50%, and 75%. The study also examined different water–cement ratios of 0.45, 0.49, and 0.53. The results showed a consistent decrease in splitting tensile strength as the proportion of plastic aggregate increased, regardless of the water–cement ratio. However, the highest splitting tensile strength was achieved with a 25% plastic aggregate replacement and a water–cement ratio of 0.45. It was also noted that lower water–cement ratios yielded higher splitting tensile strength values [41]. Moreover, Tempa et al. [42] carried out an experimental study on paver blocks produced with plastic waste and river sand, whereby waste plastic acted as the binder. Different paver blocks containing 40%, 50%, 60%, and 70% of waste plastic were produced. The materials were melted and combined using open-air burning. Their results indicated an increased compressive strength as the waste plastic content increased. The paver block with 70% waste plastic content demonstrated the highest compressive strength, achieving a value of 33.24 MPa.
Although previous research has extensively explored waste plastic as a partial replacement for aggregates in concrete and as a modifier for bitumen binders in asphalt, there remains a significant gap in investigating its application as a binder in kaolin clay composites for construction. Most recent studies have concentrated on incorporating waste plastic into concrete and paver blocks, leaving the potential of this innovative approach underexplored. Nevertheless, research remains limited to using waste plastic as a binder in kaolin clay composites for developing building materials. This research gap warrants further investigation to ascertain the structural and mechanical characteristics and environmental impact of waste plastic and kaolin clay composites, thereby providing a more comprehensive understanding of their potential in sustainable construction practices.
This research explores the potential of repurposed LLDPE plastic when combined with kaolin clay in 1:1, 1:2, and 1:3 mixture proportions to create a cementless composite. Parallel mixing ratios will also be applied to develop a comparative composite of cement and kaolin clay. A comprehensive assessment of these composites was focused on their morphology, density, compressive strength, rigidity, resistance strength, and water absorption characteristics. This investigation will contribute to developing sustainable building materials by examining the mechanical and microstructural properties of waste kaolin clay and LLDPE plastic.
2. Materials and Methods
2.1. Materials
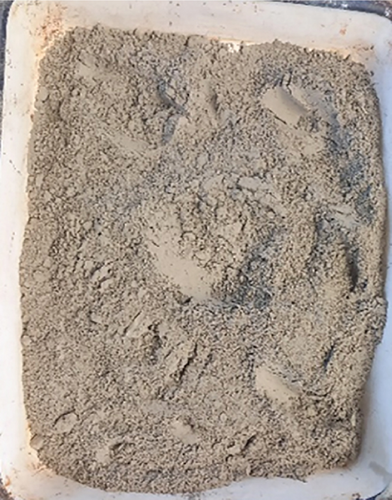
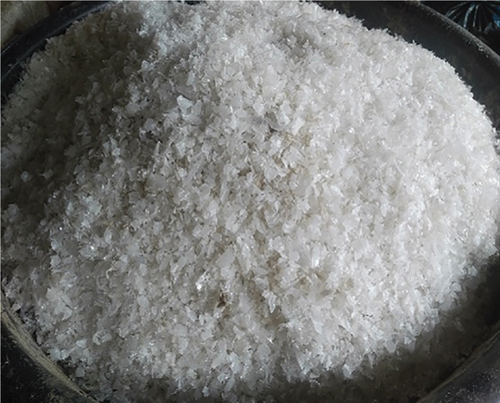
Recycled LLDPE plastic, kaolin clay, and cement were utilized as the primary components, all sourced locally. As illustrated in Figure 3a, the cement composite samples for the study were prepared using ordinary Portland cement (CEM I, 42.5R grade) as the binder. The recycled LLDPE plastic was collected, sorted, and cleaned to remove contaminants. Subsequently, as shown in Figure 3b, it was processed using an agglomerator to produce particles with a maximum size of 5 mm. Meanwhile, the kaolin clay was crushed into smaller fragments and sieved through a 1 mm mesh. Only the fraction passing through the sieve, as depicted in Figure 3c, was used in the investigation.

2.2. Preparation of Composite Samples
For the production of repurposed LLDPE plastic binder composites, kaolin clay and repurposed LLDPE plastic were mixed in ratios of 1:1, 1:2, 1:0, and 1:3. Similar kaolin clay and cement were combined to form cement binder composite. An extruder machine is employed to melt the repurposed LLDPE plastic and mix the molten plastic with kaolin clay. The extruder machine had three temperature control units, which controlled two heating plates on the steel barrel, and a total of six heating plates were on the hollow steel barrel. All the control temperature units were kept uniform. The control units were regulated to a suitable temperature that melted, mixed, and extruded a viscous homogenous composite. Table 1 shows the temperatures employed in producing the repurposed LLDPE plastic and kaolin clay at different mixes. As observed, the temperature was influenced by the mix ratios.
| S/N | Plastic type | Combination | Mix ratio | Designation | Production temperature (°C) |
|---|---|---|---|---|---|
| 1 | LLDPE | Plastic alone | 1:0 | LL only | 100 |
| 2 | LLDPE | Plastic and kaolin clay | 1:1 | LL and KA 1:1 | 80–100 |
| 3 | LLDPE | Plastic and kaolin clay | 1:2 | LL and KA 1:2 | 100–150 |
| 4 | LLDPE | Plastic and kaolin clay | 1:3 | LL and KA 1:3 | 200 |
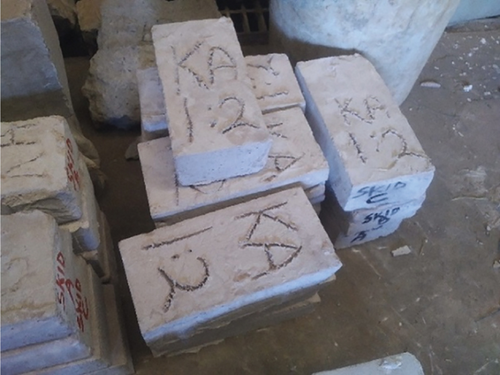
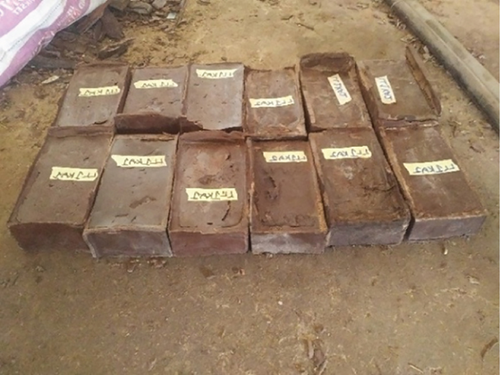
The extruded composite was filled into the 20 × 10 × 5 cm steel molds and pressed under a hydraulic pressing machine. The samples were kept under the pressing machine for 5 min for compaction and to prevent the expansion of the repurposed LLDPE plastic. Then, the samples were removed and allowed to cool. The samples of the repurposed LLDPE and cement binder composite are shown in Figure 4. The repurposed LLDPE plastic binder composite was combined with cement and kaolin clay at comparable mix ratios using a mortar mixer. The composite mixture was filled into a wooden 20 × 10 × 5 cm mold. Then, it was demolded after 24 h and cured in a water tank at room temperature. Table 2 shows the mix proportion for the cement binder composites.
| S/N | Combination | Mix ratio | Designation | Water/cement ratio |
|---|---|---|---|---|
| 1 | Cement alone | 1:0 | CE only | 0.5 |
| 2 | Cement and kaolin clay | 1:1 | CE and KA 1:1 | 0.5 |
| 3 | Cement and kaolin clay | 1:2 | CE and KA 1:2 | 0.6 |
| 4 | Cement and kaolin clay | 1:3 | CE and KA 1:3 | 0.8 |
2.3. Test Methods
2.3.1. Density
The density test followed ASTM C138/C138M-17a (2017) to estimate the impact of binders and mix ratios on the composites’ unit weight. The cement composite block specimens’ weights were noted at a 28-day curing period. Similarly, the samples of hardened composite blocks constructed of recycled LLDPE plastic and sand were conditioned for 24 h at room temperature before their weights were determined. Composite block samples of 20 × 10 × 5 cm were used in the test.
2.3.2. Strength Properties
The samples were tested using a universal compression testing machine with a 150 Mt load capacity. The compressive strength test was conducted at the specified age according to ASTM C39/C39M-18. Next, each sample was placed in the center of the battens of the compression testing apparatus. After making contact between the top batten and the sample’s top surface, the load was applied gradually until the sample was crushed. The highest load that was attained was reported. Simultaneously, a split tensile strength test following BS EN 1338 (2003) was conducted. The load was applied using a rigid bearer at a rate of 0.05 MPa/s, and the corresponding failure load was recorded. Furthermore, a flexural strength test was conducted on ASTM C78-02.3. Testing was performed on an average of the three specimens from each mix.
2.3.3. Water Absorption
A water absorption test was conducted at the specified age according to BS 1881-122 (2011). Three specimens from each mixture were tested, and the average result was recorded for the three specimens.
2.3.4. Thermal Conductivity
2.3.5. Microstructure Analysis
A benchtop JEOL JCM-7000 scanning electron microscope (SEM) was used to assess the morphological characteristics of the composite using NeoScope software. The specimens were coated with gold to prevent surface charging, to ensure surface uniformity for imaging and analysis, and to enhance visibility under electron microscopes; they were subsequently mounted on an aluminum specimen container and inserted into the device. Low vacuum conditions and a 15 kV acceleration voltage were used for the observation. For analysis, images were taken at various magnifications and speeds. An energy-dispersive X-ray (EDX) spectroscopy investigation was used to identify the elements.
3. Results and Discussion
3.1. Density
Figure 5 shows the density variations of the composite made of repurposed LLDPE plastic and kaolin clay, as well as the cement and kaolin clay composite at different mix ratios, which offer crucial insights into the structural characteristics of these materials. Interestingly, a clear pattern emerges: the densities of the reused LLDPE plastic binder composites increase as the dosage of kaolin particles rises. This relationship is due to the greater individual density of kaolin particles, which contribute to the composite’s overall mass and density. Equally, an increased kaolin particle content in cement binder composites leads to a decreased density. This phenomenon can be rationalized by considering the diminishing presence of finer cement particles within the composite. As the kaolin content rises, it displaces the finer cement particles, decreasing the overall composite density. This observation highlights the intricate interplay between the composition of the binder and the properties of the incorporated filler materials, shedding light on the dynamic nature of composite density as a function of mix ratio.

3.2. Compressive Strength
Figure 6 exhibits the compressive strengths of the recycled LLDPE plastic–kaolin clay composite and the cement–kaolin clay composite. As shown, cement alone at a 1:0 mix ratio achieved a compressive strength of 45.6 MPa. Compressive strengths for cement mixed with kaolin clay were 31.2, 21.9, and 18.3 MPa at mixture proportions of 1:1, 1:2, and 1:3, respectively. The findings indicate that the compressive strength decreased as the proportion of kaolin clay in the composite increased. This reduction may be ascribed to the progressive weakening of adhesive bonding strength with decreasing cement content.
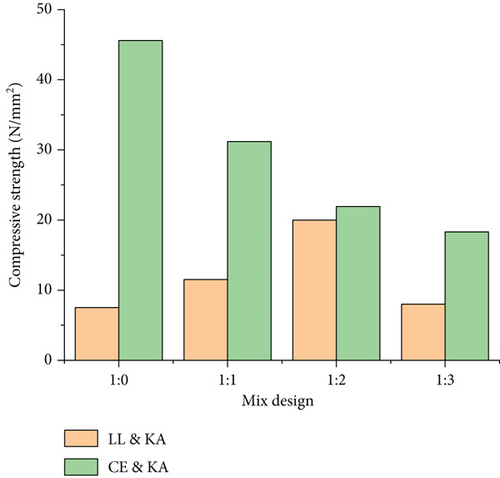
The results demonstrated that recycled LLDPE plastic can bind kaolin clay particles up to three times its weight. The compressive strengths of the composite material, consisting of repurposed LLDPE plastic and kaolin clay, were measured as 11.52, 20, and 8 MPa for mix ratios of 1:1, 1:2, and 1:3, respectively. The findings revealed that the compressive strength of the composite increased with the kaolin clay content, reaching a peak at the 1:2 mix ratio. However, a significant decline of 60% in compressive strength was observed beyond this optimal ratio. The decline in compressive strength at a higher mix ratio of 1:3 can be explained by insufficient repurposed LLDPE plastic to bind the kaolin clay particles. More binders will be required to wet the particles’ smooth surfaces and bond them together. However, all of the composite mixes that were considered had compressive strengths of more than 5 MPa, which is the bare minimum required by BS 3921:1985 for construction bricks. The results of the study align with findings reported by Babatunde et al. [44] who achieved an average compressive strength of 20.30 N/mm2, while studying the cementless composite at 1:3 plastic-to-sand ratio.
3.3. Flexural Strength
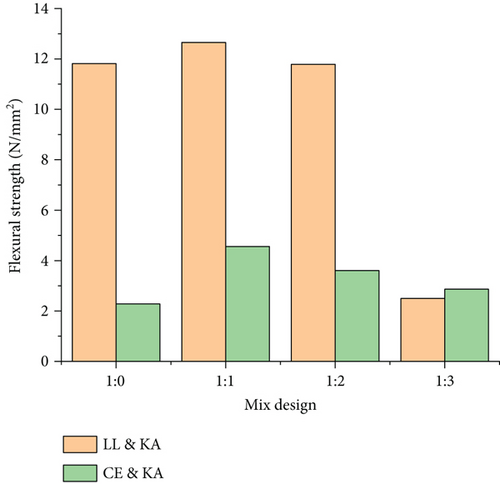
Figure 7 displays the densities of cement and kaolin clay composite and recycled LLDPE plastic and kaolin clay composite at different mixture proportions. At mix ratios of 1:0, 1:1, 1:2, and 1:3, the flexural strength values for recycled LLDPE plastic and kaolin clay were 11.82, 12.65, 11.79, and 2.50 MPa, respectively. The cement and kaolin clay composite, on the other hand, had flexural strength values of 2.28, 4.56, 3.60, and 2.87 MPa at mix ratios of 1:0, 1:1, 1:2, and 1:3. Interestingly, in every mix percentage, the recycled LLDPE plastic composite continuously demonstrated greater flexural strength than the cement composite. This observation aligns with plastics’ essential bending strength properties, emphasizing their effectiveness in providing enhanced flexural performance in composite materials. A particularly noteworthy finding is that the repurposed LLDPE plastic and kaolin clay composite at a mixture proportion of 1:1 yielded the greatest flexural strength values. This significant improvement can be attributed to the synergistic effect of the excellent bonding interaction between the constituent materials at this specific mix ratio, highlighting the critical role of optimal proportions in achieving superior mechanical properties.
3.4. Split Tensile Strength
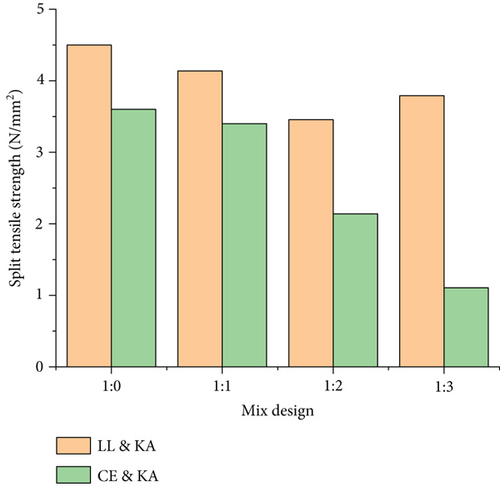
Figure 8 presents the tensile splitting strength of the repurposed LLDPE plastic and kaolin clay composite and cement and kaolin clay composite at different mix ratios. As shown, the tensile splitting strength of the composites decreased as the kaolin clay content rose. The cement and kaolin clay composite’s tensile strength was 3.6 MPa at a mixed proportion of 1:0. As the mix ratio grew to 1:1, 1:2, and 1:3, it progressively decreased by 5.6%, 40.6%, and 69.2%. The reduced cement paste dosage explains the drop, which limits the bond strength between the composite materials. Moreover, the cement composites exhibited brittle failure and lower resistance to tensile forces. In the same vein, the tensile splitting strength of repurposed LLDPE plastic and kaolin clay composite declined as the content of kaolin clay increased up to the mix ratio of 1:2. Afterwards, it increased when the quantity of the kaolin clay particles rose from 2 to 3. Nonetheless, the findings demonstrated that the kaolin clay and recycled LLDPE plastic composites had a greater tensile splitting strength than the cement binder composite. The recycled LLDPE plastic effectively bonds the particles, and the composite’s increased tensile strength resulted from the plastic’s favorable tensile characteristics. The paver block constituent materials’ water absorption and porosity properties affect the tensile splitting strength characteristics. The higher the water absorption and porosity of the paver block constituent materials, the lower the tensile splitting strength.
3.5. Water Absorption
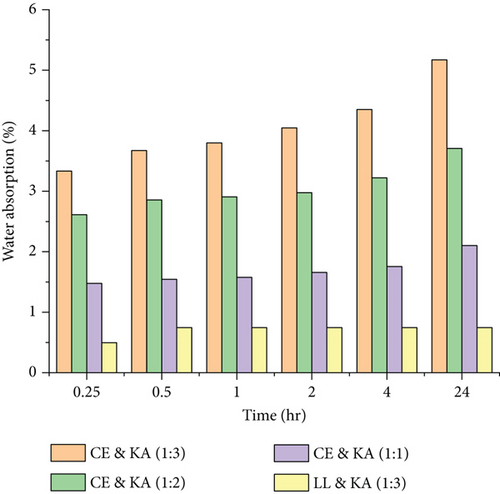
The waste plastic binder normally absorbs less than 1% of water, as seen in Figure 9. Zero water absorption characteristics were observed in the recycled LLDPE plastic and kaolin clay composite at mix ratios of 1:1 and 1:2. This can be attributed to the waste plastic that envelops the kaolin clay particles, thereby preventing its pores’ access to water. Plastic is a hydrophilic material that repels water on its surface. The water absorption of waste plastic and kaolin clay at a mixed ratio of 1:3 increased minimally after 0.25 h of presence in the water. Furthermore, water absorption rose to 0.75% after 0.5 h of immersion in the water. Beyond that, there was no further increase in water absorption. Water enters through the pores of the particles and gets saturated, but the neighboring particles cannot get in contact with water as the plastic has enveloped the particles. This confirms that the particles are evenly distributed and effectively dispersed throughout the waste plastic. The outcomes correlated with the findings reported by Tulashie et al. [45], Iftikhar et al. [46], and Saraswat and Singh [47], who obtained 2%–3%, 1.04%–1.86%, and 0.22%–1.00% water absorption, respectively, in their study on cementless paver blocks containing plastic and sand at 1:3 ratio. Nonetheless, it is evident that as the duration of the water samples grows, so does the cement and kaolin clay composite’s water absorption. The water ingresses into the composite samples through the pores on the surface of the cement paste and filler materials. Generally, the water absorption of all the cement and kaolin clay composite mixes is less than 6%, below the maximum specified by the Indian Standard, IS 15658:2006, and British Standards for concrete blocks. In contrast, the cement and kaolin clay composite are less water resistant than the recycled LLDPE plastic and kaolin clay composite. Waste plastic, which has a surface that repels water, is to blame for this.
3.6. Thermal Conductivity
Building utilization increases energy consumption and CO2 emissions compared to energy embodied in construction materials [48]. Building energy consumption is correlated with the thermal conductivity of building materials [49]. Utilizing materials with low specific heat and low thermal conductivity can reduce buildings’ energy consumption [50]. Thermal conductivity plays a crucial role in assessing the temperature of concrete and illustrating its ability to conduct heat [43, 51]. It plays an essential role in the design of heat-prone concrete pavements, dam structures, and mass foundations [52]. The thermal characteristics include the following aspects: (1) heat capacity, which represents the energy required to raise the temperature of a given mass of material by degree Celsius; (2) thermal conductivity, which reflects the material’s ability to transfer heat from hotter to cooler regions; (3) thermal expansion, referring to the change in a material’s volume due to temperature variations; and (4) thermal stress, resulting from differences in thermal expansion coefficients between materials. Thermal conductivity plays a crucial role in heat transfer, especially for insulating materials, as it governs the conduction, convection, and radiation of heat in granular materials [53].
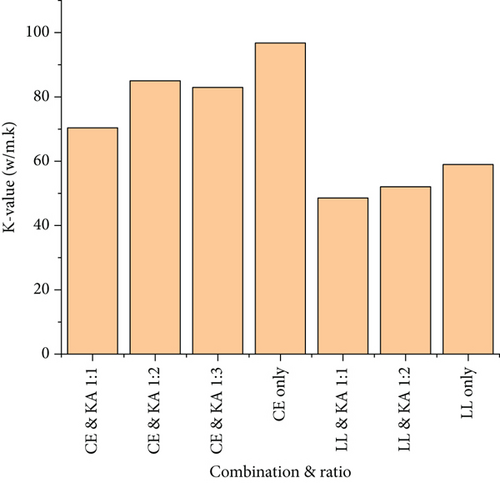
Figure 10 illustrates the thermal conductivity of cement and plastic composite materials. The figure compares the results for cement alone (CE) and cement combined with kaolin clay (KA) at various ratios (1:1, 1:2, and 1:3). Additionally, it includes data for plastic alone (LL) and plastic mixed with kaolin clay (KA) at different proportions (1:1 and 1:2). The average thermal conductivity varies from 48.6 to 96.8 w/m.k. The sample of plastic with KA of ratio (1:1) (LL & KA (1:1)) had the lowest thermal conductivity value. In contrast, the cement sample alone recorded the highest value after subjecting the materials to a temperature of 1050c for 2 h. Generally, the thermal conductivity (k) ranges from 0 to 84 w/m.k for exposed bricks. Materials with lower thermal conductivity are typically considered effective thermal insulators, providing enhanced building insulation. This suggests that the plastic composite exhibits superior insulation performance compared to the cement composite.
3.7. Microstructure Analysis
In materials science and engineering, microstructure analysis is essential because it offers important insights into the characteristics and functionality of materials. These insights can be used to design and optimize new composite materials for various applications, including manufacturing, infrastructure development, and construction. Previous studies have used various characterization approaches to examine the materials’ microstructure. A variety of analytical techniques are employed, such as differential scanning calorimetry (DSC), differential thermal analysis (DTA), energy-dispersive spectroscopy (EDS), EDX analysis, thermogravimetric analysis and DTA (TGA/DTA), SEM, X-ray diffraction (XRD), and Fourier transform infrared spectroscopy (FTIR).
3.7.1. EDS and SEM
The EDS and SEM images of the repurposed LLDPE plastic and kaolin clay composite at numerous mixture proportions are displayed in Figure 11.
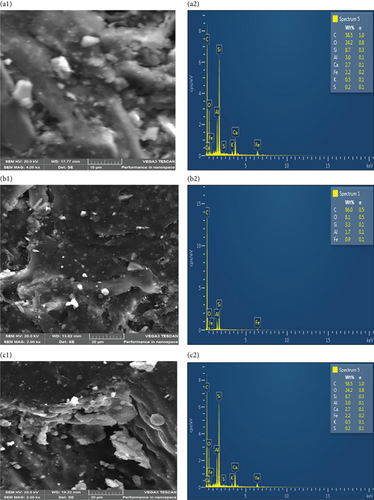
Figure 11 (a1, b1, and c1) illustrates kaolin clay particles’ spatial dispersion and distribution within the recycled LLDPE plastic matrix. Across all samples, no signs of particle agglomeration were detected, highlighting the effectiveness and reliability of the extruder machine in producing well-blended composites. Proper and uniform mixing of the components enables the kaolin clay particles to effectively reinforce the recycled plastic, improving its strength and other properties. The extent of this enhancement depends on the kaolin clay content and the quality of the interfacial bonding between the waste LLDPE plastic and the kaolin clay particles. The combination of properly sized kaolin clay, uniform distribution of kaolin clay, and formation of strong bonds between the waste LLDPE plastic and kaolin clay leads to better stress transfer, improved orientation, and less porosity. Good bonding between the materials is key for the overall strength and long-lasting performance of the composite [47]. Furthermore, EDS analysis reveals the elemental composition of the composite samples, with Figure 11(a2, b2, and c2), confirming the presence of elements such as carbon (C) and others. Similar studies on cementless composites by Babatunde et al. [54, 55] affirm that filler materials occupy the pores within the plastic in a molten state, thereby reinforcing it when hardened.
3.7.2. TGA and DTA
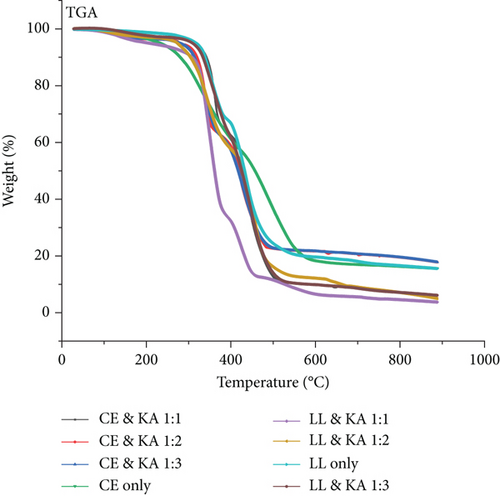
Figure 12 presents the TGA curves for cement and plastic composite material samples. The figure illustrates a comparison between cement (CE) and its mixtures with kaolin clay (KA) at different ratios (1:1, 1:2, and 1:3), alongside plastic (LL) and its corresponding blends with KA at the same proportions. The materials were analyzed under elevated temperatures up to 900°C to assess the effect of kaolin clay on their thermal performance and structural behavior. The results indicate that all samples follow a similar trend, with weight loss increasing progressively as the temperature rises. The graph highlights two distinct decomposition stages. The first stage, between 25°C and 250°C, corresponds to dehydration, contributing 3% to 10% of the total mass loss.
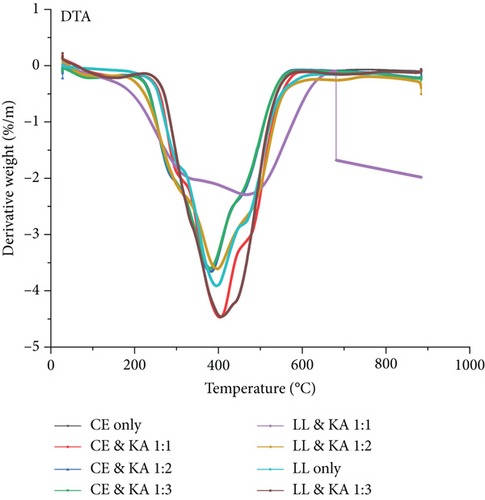
The results of the DTA of the cement and plastic composite samples are shown in Figure 13. The figures show a comparison of samples of cement (CE) and its mixtures with kaolin clay (KA) at different proportions (1:1, 1:2, and 1:3), as well as samples of plastic (LL) and its blends with KA at the same proportions. These specimens were exposed to progressively increasing temperatures, reaching up to 900°C, to evaluate the effect of kaolin clay on their thermal stability and overall performance under high-temperature conditions. By increasing selectivity, DTA curves help distinguish and separate thermal events more effectively. Furthermore, decompositions within one of the main mass loss peaks (apart from the dehydration event) may be seen in both cement composite and plastic composite samples, and they take place at temperatures between 200°C and 600°C.
3.7.3. DSC
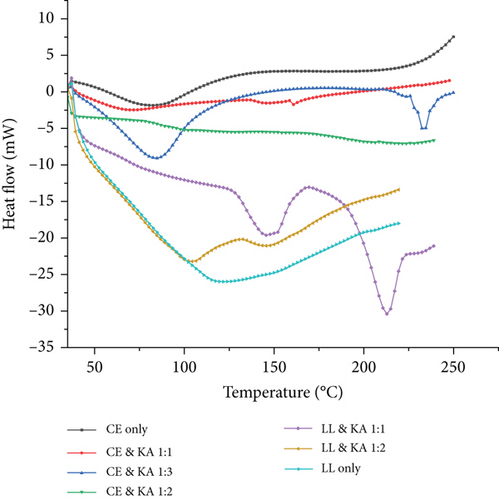
DSC analysis measures the variations in heat flow between samples and any interferences as a function of temperature and time. The DSC results for the cement and plastic composite materials are presented in Figure 14. This figure compares the thermal behavior of cement alone (CE) with cement mixed with kaolin clay (KA) in different ratios (1:1, 1:2, and 1:3), as well as plastic alone (LL) and plastic combined with KA in proportions (1:1) and (1:2). The analysis covers a temperature range up to 250°C, highlighting how the inclusion of kaolin clay impacts the thermal properties of both cement and plastic composite. Cement composite samples exhibit higher heat flow compared to plastic composite samples. For the cement composite samples, melting peaks are observed around 80°C in the twin heating cycle. In contrast, the plastic composite samples show melting peaks between 100°C and 160°C during the twin heating cycle. The melting point of the LLDPE sample is approximately 110°C, aligning with findings by Dalhat and Al-Abdul Wahhab [30], who advised a blending temperature exceeding 110°C for LLDPE-modified binders. To ensure optimal performance and avoid material degradation, a final blending temperature of 160°C was adopted for asphalt integration, as LLDPE remained stable and showed no signs of degradation within the tested temperature range.
3.8. Statistical Analysis
The relationship between the compressive strength was observed to be irregular for different levels of incorporation of kaolin clay. At first, increasing the ratio of waste plastic and kaolin clay from 1:0 to 1:1 enhanced the average strength from 7.53 to 11.52 N/mm2. A similar pattern was observed when the ratio increased from 1:1 to 1:2; the strength increased from 11.52 to 20.04 N/mm2, but further increment of the ratio from 1:2 to 1:3 significantly reduced the strength to 8.03 N/mm2. The fluctuation in the results trend makes it hard to analyze specific differences and their certain locations within the data. Meanwhile, the cement composites exhibit reducing trends as the content of kaolin clay increases. With a cement and kaolin clay ratio of 1:0, the average strength was 45.3, and the strength declined to 31.5, 21.5, and 18.7 N/mm2 as the ratio increased to 1:1, 1:2, and 1:3, respectively. To properly analyze the relationship, a statistical method using ANOVA followed by a post hoc Bonferroni with adjustments. The ANOVA test determines whether changing the proportion of kaolin clay has any significant impact on the overall compressive strength. The F-statistics obtained from ANOVA and the associated p-value indicate comprehensive evaluation and establish whether at least one ratio has a different impact.
The p-value is a statistical hypothesis approach to demonstrate that results can be considered statistically significant and whether to accept or reject the null hypothesis. A low p-value indicates strong statistical significance, and at least one of the ratios has a considerable different effect on compressive strength. But ANOVA only could not identify the specific combination ratios and sample groups exhibiting these differences. Thus, it becomes crucial to carry out post hoc analysis with Bonferroni adjustments. This technique effectively identifies exact pairings that demonstrate significant differences, efficiently providing information on whether Sample 1 at 1:0 ratio shows significant difference from Sample 2 at 1:2 ratio, and so forth. In addition, Bonferroni adjustment is integrated into the post hoc analysis to control the risk of false positives (Type I errors) that could occur when multiple pairwise comparisons are carried out. By adjusting the significance level for each comparison, Bonferroni approach minimizes the chance of incorrectly concluding a significant difference exists. This rigorous statistical approach ensures the observed differences are reliable and not due to chance, which is essential for making informed decisions, optimizing material use, and ensuring the reliability of the experimental results.
The analysis started by carrying out an initial ANOVA test, with the objective of assessing the relationship between the dependent variable, “compressive strength,” and an independent variable, “sample type.” Tables 3 and 4 present the ANOVA results, and the major interest lies in the p-value associated with “between groups.” The obtained p-values of 0.9866 and 0.9992 are far above the common threshold of 0.05, indicating a lack of statistical basis to reject the null hypothesis. Therefore, there is no substantial evidence to conclude that there is a significant difference between group means. In other terms, this analysis demonstrates no statistical significance for the different compressive strengths between Samples 1, 2, and 3 for both waste plastic composites and cement composite. Correspondingly, the ANOVA test does not reveal significant differences in compressive strength between the different samples; there is no need for post hoc analysis such as Bonferroni adjustments. The ANOVA results strongly suggest the samples are statistically similar in terms of compressive strength, meaning the manufacturing process appears consistent across different samples and ratios. The variation in compressive strength is probably due to natural variability or measurement error, rather than actual differences caused by the manufacturing process.
| (a) ANOVA summary | |||||||
|---|---|---|---|---|---|---|---|
| Groups | Count | Sum | Average | Variance | |||
| Sample 1 | 4 | 46.09 | 11.5225 | 33.936431 | |||
| Sample 2 | 4 | 46.608 | 11.652 | 35.82531667 | |||
| Sample 3 | 4 | 48.653 | 12.16325 | 32.52383225 | |||
| (b) ANOVA results | |||||||
| Source of variation | SS | Df | MS | F | p -value | F crit | |
| Between groups | 0.9182765 | 2 | 0.45913825 | 0.013466363 | 0.986643743 | 4.256494729 | |
| Within groups | 306.85674 | 9 | 34.09519331 | ||||
| Total | 307.775016 | 11 |
| (a) ANOVA summary | |||||||
|---|---|---|---|---|---|---|---|
| Groups | Count | Sum | Average | Variance | |||
| Sample 1 | 4 | 117.1167 | 29.279175 | 135.0147581 | |||
| Sample 2 | 4 | 117.7059 | 29.426475 | 157.1219677 | |||
| Sample 3 | 4 | 116.3242 | 29.08105 | 145.0113867 | |||
| (b) ANOVA results | |||||||
| Source of variation | SS | Df | MS | F | p -value | F crit | |
| Between groups | 0.24035898 | 2 | 0.120179491 | 0.000824751 | 0.999175664 | 4.256494729 | |
| Within groups | 1311.44434 | 9 | 145.7160375 | ||||
| Total | 1311.6847 | 11 |
Subsequently, a statistical analysis was performed to validate the effect of the changing ratios on compressive strength. From the ANOVA results presented in Tables 5 and 6, the main interest is the p-value of 4.39996e-07 and 9.22182e-10, which is far less than the standard threshold of 0.05. This provides strong evidence to reject the null hypothesis. In simpler terms, it is a rejection of the idea that there is no relationship between the ratios and compressive strength. In other words, the compressive strength varies significantly based on the ratio used, and at least one of the ratios produces a notably different compressive strength than the others.
| (a) ANOVA summary | |||||||
|---|---|---|---|---|---|---|---|
| Groups | Count | Sum | Average | Variance | |||
| 1:0 | 3 | 22.582 | 7.52733 | 0.491241333 | |||
| 1:1 | 3 | 34.567 | 11.52233 | 1.526721333 | |||
| 1:2 | 3 | 60.122 | 20.04066 | 0.017110333 | |||
| 1:3 | 3 | 24.08 | 8.02666 | 1.135902333 | |||
| (b) ANOVA results | |||||||
| Source of variation | SS | Df | MS | F | p -value | F crit | |
| Between groups | 301.433066 | 3 | 100.4776885 | 126.7467299 | 4.39996e-07 | 4.066180551 | |
| Within groups | 6.34195067 | 8 | 0.792743833 | ||||
| Total | 307.775016 | 11 |
| (a) ANOVA summary | |||||||
|---|---|---|---|---|---|---|---|
| Groups | Count | Sum | Average | Variance | |||
| 1:0 | 3 | 136.1478 | 45.38262 | 1.361979845 | |||
| 1:1 | 3 | 94.4837 | 31.49456 | 1.055350003 | |||
| 1:2 | 3 | 64.5019 | 21.50063 | 0.215893213 | |||
| 1:3 | 3 | 56.1242 | 18.70806 | 0.261418143 | |||
| (b) ANOVA results | |||||||
| Source of variation | SS | Df | MS | F | p -value | F crit | |
| Between groups | 1309.44833 | 3 | 436.4827772 | 603.159765 | 9.22182e-10 | 4.066180551 | |
| Within groups | 5.78928241 | 8 | 0.723660301 | ||||
| Total | 1315.23761 | 11 |
To identify which specific groups showed statistically significant differences, a post hoc analysis using t-tests with a Bonferroni correction was performed. Because there were four ratios under comparison (1:0, 1:1, 1:2, and 1:3), a total of six pairwise comparisons were necessary. With a standard significance level (alpha) of 0.05, the Bonferroni correction adjusted the significance level for individual comparison to 0.008 (0.05 divided by 6). With the t-test results presented in Tables 7 and 8, it can be observed that there exists a significant difference in average compressive strength between 1:0 and 1:1 ratios sample in Group I, 1:0 and 1:2 in Group II, 1:1 and 1:2 in Group IV, and 1:2 and 1:3 in Group VI for waste plastic composite. The t-statistics of −4.87, −30.39, and −11.87 vastly exceed the critical t-value of 2.13, and the p-values are notably smaller than 0.01. This outcome validates the statistical evidence of disparities among the compressive strength of samples in Groups I, II, IV, and VI. Practically, this divergence exemplifies the major influence of material ratio (1:0 vs. 1:1, 1:0 vs. 1:2, 1:1 vs. 1:2, and 1:2 vs. 1:3) on the compressive strength. Specifically, the 1:1 (waste plastics:kaolin clay) samples show significantly higher average compressive strength than 1:0 samples, while 1:2 ratio exhibited higher average compressive strength than 1:1 sample. Similarly, significant differences in average compressive strength between 1:0 and 1:1 ratios in Group 1, 1:0 and 1:2 ratios in Group II, 1:0 and 1:3 ratios in Group III, 1:1 and 1:2 ratios in Group IV, 1:1 and 1:3 ratios in Group V, and 1:2 and 1:3 ratios in Group VI were revealed. The t-statistics of 15.47, 32.93, 36.26, 19.30, and 7.00 are much higher than the critical t-value of 2.13, and the p-values are notably smaller than 0.01. This outcome validates the statistical evidence of disparities among the compressive strength of samples in Groups I, II, III, IV, V, and VI. Practically, this divergence exemplifies the major influence of material ratio on compressive strength. This finding has important implications for manufacturing and material selection decisions, as it highlights the pivotal role of the material ratio in achieving target compressive strength.
| Group | I | II | III | |||
|---|---|---|---|---|---|---|
| Ratios | 1:0 | 1:1 | 1:0 | 1:2 | 1:0 | 1:3 |
| Mean | 7.527333 | 11.522333 | 7.527333 | 20.04067 | 7.527333 | 8.026667 |
| Variance | 0.491241 | 1.5267213 | 0.491241 | 0.01711 | 0.491241 | 1.135902 |
| Observations | 3 | 3 | 3 | 3 | 3 | 3 |
| Pooled variance | 1.008981 | 0.254176 | 0.813572 | |||
| Hypothesized mean difference | 0 | 0 | 0 | |||
| Df | 4 | 4 | 4 | |||
| t Stat | −4.87103 | −30.3985 | −0.67801 | |||
| P(T ≤ t) one-tail | 0.004107 | 3.49e-06 | 0.267479 | |||
| t Critical one-tail | 2.131847 | 2.131847 | 2.131847 | |||
| P(T ≤ t) two-tail | 0.008214 | 6.98e-06 | 0.534958 | |||
| t Critical two-tail | 2.776445 | 2.776445 | 2.776445 | |||
| Bonferroni adjustment | 0.008 | 0.008 | 0.008 | |||
| Significant? | True | True | False | |||
| Group | IV | V | VI | |||
| Ratios | 1:1 | 1:2 | 1:1 | 1:3 | 1:2 | 1:3 |
| Mean | 11.52233 | 20.040667 | 11.52233 | 8.026667 | 20.04067 | 8.026667 |
| Variance | 1.526721 | 0.0171103 | 1.526721 | 1.135902 | 0.01711 | 1.135902 |
| Observations | 3 | 3 | 3 | 3 | 3 | 3 |
| Pooled variance | 0.771916 | 1.331312 | 0.576506 | |||
| Hypothesized mean difference | 0 | 0 | 0 | |||
| Df | 4 | 4 | 4 | |||
| t Stat | −11.8745 | 3.710528 | 19.37899 | |||
| P(T ≤ t) one-tail | 0.000144 | 0.010322 | 2.09e-05 | |||
| t Critical one-tail | 2.131847 | 2.131847 | 2.131847 | |||
| P(T ≤ t) two-tail | 0.000288 | 0.020645 | 4.18e-05 | |||
| t Critical two-tail | 2.776445 | 2.776445 | 2.776445 | |||
| Bonferroni adjustment | 0.008 | 0.008 | 0.008 | |||
| Significant? | True | False | True | |||
| Group | I | II | III | |||
|---|---|---|---|---|---|---|
| Ratios | 1:0 | 1:1 | 1:0 | 1:2 | 1:0 | 1:3 |
| Mean | 45.38262 | 31.494567 | 45.38262 | 21.50063 | 45.38262 | 18.70807 |
| Variance | 1.36198 | 1.05535 | 1.36198 | 0.215893 | 1.36198 | 0.261418 |
| Observations | 3 | 3 | 3 | 3 | 3 | 3 |
| Pooled variance | 1.208665 | 0.788937 | 0.811699 | |||
| Hypothesized mean difference | 0 | 0 | 0 | |||
| Df | 4 | 4 | 4 | |||
| t Stat | 15.47156 | 32.93025 | 36.26146 | |||
| P(T ≤ t) one-tail | 5.09e-05 | 2.54e-06 | 1.73e-06 | |||
| t Critical one-tail | 2.131847 | 2.131847 | 2.131847 | |||
| P(T ≤ t) two-tail | 0.000102 | 5.07e-06 | 3.45e-06 | |||
| t Critical two-tail | 2.776445 | 2.776445 | 2.776445 | |||
| Bonferroni adjustment | 0.008 | 0.008 | 0.008 | |||
| Significant? | True | True | True | |||
| Group | IV | V | VI | |||
| Ratios | 1:1 | 1:2 | 1:1 | 1:3 | 1:2 | 1:3 |
| Mean | 31.49457 | 21.500633 | 31.49457 | 18.70807 | 21.50063 | 18.70807 |
| Variance | 1.05535 | 0.2158932 | 1.05535 | 0.261418 | 0.215893 | 0.261418 |
| Observations | 3 | 3 | 3 | 3 | 3 | 3 |
| Pooled variance | 0.635622 | 0.658384 | 0.238656 | |||
| Hypothesized mean difference | 0 | 0 | 0 | |||
| Df | 4 | 4 | 4 | |||
| t Stat | 15.35263 | 19.30002 | 7.001052 | |||
| P(T ≤ t) one-tail | 5.25e-05 | 2.12e-05 | 0.001095 | |||
| t Critical one-tail | 2.131847 | 2.131847 | 2.131847 | |||
| P(T ≤ t) two-tail | 0.000105 | 4.25e-05 | 0.002191 | |||
| t Critical two-tail | 2.776445 | 2.776445 | 2.776445 | |||
| Bonferroni adjustment | 0.008 | 0.008 | 0.008 | |||
| Significant? | True | True | True | |||
4. Conclusions and Recommendations
4.1. Conclusions
- •
The study revealed that the repurposed LLDPE plastic and kaolin clay composite exhibited optimal compressive strength when mixed in a ratio of 1:2, surpassing the performance of the cement and kaolin clay composite, which achieved its optimum compressive strength at a mix ratio of 1:1.
- •
The repurposed LLDPE plastic and kaolin clay composites also demonstrated superior tensile splitting strength compared to the cement binder composite.
- •
The repurposed LLDPE plastic composite consistently outperformed the cement composite regarding flexural strength across all considered mix proportions. These findings highlight the potential of repurposed LLDPE plastic and kaolin clay composites as promising alternatives in construction materials, presenting improved mechanical properties in various aspects
- •
The repurposed LLDPE composites exhibited lower water absorption levels than the cement and kaolin clay composite across all mix proportions.
- •
ANOVA analysis supports the microstructural findings, indicating that the combination of waste LLDPE plastic and kaolin clay at a 1:2 ratio represents the optimal proportion of kaolin clay that can be bounded by the waste LLDPE plastic.
4.2. Recommendations
- •
Future research directions should involve more extensive exploration of the long-term durability of repurposed LLDPE plastic and kaolin clay composites in real-world applications.
- •
Life cycle assessments and environmental impact analyses can help quantify the ecological footprint of these materials compared to traditional alternatives.
Conflicts of Interest
The authors declare no conflicts of interest.
Author Contributions
Tareg Abdalla Abdalla and Yusuf Babatunde contributed to the conceptualization, methodology, validation, formal analysis, investigation, data collection, resource acquisition, experimental work, original draft writing, and visualization. Yinusa Jimoh, John Mwero, and Raphael Mutuku contributed critically through the manuscript review, editing, and supervision.
Funding
No funding was received for this research.
Acknowledgments
The authors extend their deepest appreciation to Pan African University; the Institute for Basic Science, Technology and Innovation; and the Department of Civil Engineering for their technical assistance in this research.
Open Research
Data Availability Statement
The data that support the findings of this study are available from the corresponding author upon reasonable request.


