Impact of Direct-Acting Antiviral Therapy on Tacrolimus Pharmacokinetics in Hepatitis C Virus Nucleic Acid Testing-Positive Transplant Recipients
Abstract
Purpose: Direct-acting antiviral agents (DAAs) against hepatitis C virus (HCV) such as sofosbuvir/velpatasvir (SOF/VEL) and glecaprevir/pibrentasvir (GLE/PIB) are effective in treating recipients of organs infected with HCV. The objective of this project is to identify changes in tacrolimus pharmacokinetics throughout DAA therapy in recipients of abdominal transplants from nucleic acid testing-positive (NAT+) donors.
Methods: Adult kidney or liver transplant recipients transplanted between 4/22/2019 and 6/23/2022 were included. Recipients of HCV NAT+ organs were treated with DAAs based on institutional protocol and insurance preference. Recipients of HCV NAT− organs from donors who fit Public Health Service (PHS) risk criteria for HCV transmission were included in the comparator group. Tacrolimus doses and concentrations were collected at DAA initiation and cessation and at the time of sustained virologic response assessment at 12 weeks after treatment completion (SVR12); these time points were matched in the NAT− control group. The primary outcome was difference in concentration-to-dose ratio (C/D) change (ΔC/D) over time between NAT+ and NAT− organ recipients.
Results: At DAA initiation, NAT+ organ recipients required a lower tacrolimus dose to reach goal than NAT− organ recipients (ΔC/D NAT+ = −0.41, ΔC/D NAT− 0.60, p = 0.01); however, a known tacrolimus interaction with fluconazole—administered to liver transplant recipients at high risk for invasive fungal infection (IFI)—represents a significant confounding factor. No differences in average C/D ratio between NAT+ and NAT− organ recipients were identified at any time point.
Conclusion: These results do not support empiric dose adjustments based on donor HCV NAT status or antiviral therapy.
1. Introduction
The current opioid epidemic has led to a rise in overdose deaths and higher rates of hepatitis C virus (HCV) infection in the United States [1]. Utilization of kidneys and livers from HCV nucleic acid test positive (NAT+) donors has become standard as a means to expand the donor pool. Pan-genotypic direct-acting antivirals (DAAs) such as sofosbuvir/velpatasvir (SOF/VEL) and glecaprevir-pibrentasvir (GLE/PIB) have been demonstrated to be safe and effective for the treatment of HCV infections in solid-organ transplant recipients of HCV NAT+ organs [2–6].
Prior studies show that tacrolimus area under the curve and serum trough concentrations are elevated in patients who are receiving DAA therapy compared to patients who are not [7, 8]. Of note, one study investigating this phenomenon enrolled only liver transplant recipients (LTRs), and therefore results may be skewed by the high nidus of infection in recipients of infected livers [8]. Studies have hypothesized that proinflammatory cytokines from active HCV are responsible for cytochrome P450 (CYP) inhibition, leading to increased tacrolimus serum levels, followed by reduction of those levels as the infection is cleared [9].
Given the narrow therapeutic index of tacrolimus and wide inter- and intrapatient variability in tacrolimus trough concentrations, concentration-to-dose (C/D) ratio may offer a more accurate assessment of metabolism. Previous studies have shown elevated C/D ratio during treatment with GLE/PIB, which has been shown to increase tacrolimus Cmax and AUC by 1.5 times and 1.45 times, respectively [7, 10]. Another study identified a significant decrease in tacrolimus C/D ratio by week 12 after treatment, in all nine transplant recipients treated with DAA therapy, although specific DAAs were not mentioned [11]. More research has demonstrated that C/D ratio correlates to renal outcomes; patients who require higher tacrolimus doses to reach therapeutic levels, and therefore a lower C/D ratio, are more likely to switch to another immunosuppressant due to CNI-induced nephrotoxicity [12, 13].
Data comparing changes in tacrolimus C/D ratio in solid organ transplant recipients of HCV NAT+ organs compared to transplant recipients of HCV nucleic acid test negative (NAT−) organs are lacking. We sought to further investigate changes in tacrolimus C/D ratio in kidney transplant recipients (KTRs) and/or LTRs of HCV NAT+ organs compared to HCV NAT− organs over time to assess the effects of HCV infection and DAAs on tacrolimus metabolism.
2. Methods
This was a single-center, Institutional Review Board approved (IRB# 2014-1072), retrospective review of adult KTRs and/or LTRs between April 12, 2019, and June 23, 2022, who received an HCV NAT+ organ (treatment group) or an HCV antibody-positive (Ab+) but HCV NAT− organ (control group). Patients who received HCV NAT+ organs were subsequently treated with 12 weeks of GLE/PIB or SOF/VEL based on insurance preference. The comparator group received organs from HCV Ab+, NAT− donors who fit Public Health Service (PHS) risk criteria for HCV transmission (Table 1) and were monitored for possible HCV transmission through 6 months post-transplant [14]. Patients were excluded if they passed away or were lost to follow-up. For data analysis, the single simultaneous liver-kidney transplant recipient was regarded as an LTR since our institutional immunosuppression protocols for simultaneous liver-kidney transplant recipients follow those of our LTRs.
| Sex (i.e., any method of sexual contact, including vaginal, anal, and oral) with a person known or suspected to have HIV, HBV, or HCV infection |
| Man who has had sex with another man |
| Sex in exchange for money or drugs |
| Sex with a person who had sex in exchange for money or drugs |
| Drug injection for nonmedical reasons |
| Sex with a person who injected drugs for nonmedical reasons |
| Incarceration (confinement in jail, prison, or juvenile correction facility) for 72 or more consecutive hours |
| Child breastfed by a mother with HIV infection |
| Child born to a mother with HIV, HBV, or HCV infection |
| Unknown medical or social history |
KTRs received induction immunosuppression with basiliximab, antithymocyte globulin, or alemtuzumab per institutional protocol. LTRs of donation after brain death (DBD) organs do not receive induction immunosuppression while LTRs of donation after cardiac death (DCD) organs receive induction immunosuppression with antithymocyte globulin. Maintenance immunosuppression consists of mycophenolate and tacrolimus, with or without steroids per institutional protocol. Goal tacrolimus trough concentrations in KTRs are 8–11 ng/mL, or a reduced goal of 7–9 ng/mL in patients with delayed graft function, for the first 3 months. Goal concentrations are reduced to 7–9 ng/mL from months 3–6, 6–8 ng/mL from months 6–12, and 5–7 ng/mL after 12 months. In LTRs, goal tacrolimus trough concentrations for the first 3 months are 8–10 ng/mL in recipients with autoimmune conditions leading to transplant or 5–7 ng/mL in recipients with non-autoimmune liver disease. In both KTRs and LTRs, tacrolimus trough concentrations are drawn daily during the index transplant hospitalization; in KTRs, outpatient troughs are drawn weekly for 12 weeks, then monthly until 9 months post-transplant, then every 3 months thereafter. In LTRs, tacrolimus troughs are drawn twice weekly for the first month, weekly from months 1–3, every other week from months 3–6, and monthly thereafter.
In LTRs at high risk for invasive fungal infections (IFIs), patients received fluconazole 400 mg daily for 14 days for IFI prophylaxis. Patients are considered high risk if they meet any one of the following criteria: operation time greater than 10 h in duration, any repeat operation within 30 days of transplant, retransplantation, dialysis requirement prior to transplant, high intraoperative transfusion requirement during transplant surgery (≥ 40 units of cellular blood products), history of choledochojejunostomy, Candida colonization in the perioperative period (one or more cultures positive for Candida within one month prior to transplant or active treatment for Candida infection at the time of transplant), physiologic MELD ≥ 35, hospital admission seven days or longer prior to liver transplant, ICU admission within seven days prior to transplant, or receipt of a living donor liver transplant.
In the treatment group, tacrolimus dose and trough concentration were collected at DAA initiation (time 1), DAA discontinuation (time 2), and 12 weeks after DAA discontinuation (time 3), when assessing for sustained virologic response 12 weeks after completion of treatment (SVR12). To match this timeframe as closely as possible within the control group, data were collected at the second outpatient trough draw (time 1) to promote steady-state concentration and at 12 weeks (time 2) and 24 weeks (time 3) from the second outpatient draw. Timing of collected tacrolimus troughs and doses is outlined in Figure 1.

The primary outcome was difference in C/D ratio change (ΔC/D) over time between NAT+ and NAT− organ recipients. Secondary outcomes included differences in ΔC/D over time between different organs and between different DAA agents. C/D ratios at varying time points were also compared between populations. Finally, C/D ratios were compared between NAT+ LTRs who were receiving prophylactic fluconazole at DAA initiation, and those who were not to assess the impact of the drug interaction between fluconazole and tacrolimus.
A standard t-test was used to compare changes in C/D ratio between populations when variances between groups appeared to be equal. In the case of unequal variances, a Satterthwaite approximation of the t-test method was used instead. Baseline patient characteristics were compared using t-tests and chi-squared tests. All analyses were performed using SAS statistical software, Version 9.4 (SAS Institute Inc., Cary, NC). p values less than 0.05 were considered as significant.
3. Results
A total of 37 KTRs and LTRs received HCV NAT+ organs and 155 received organs from HCV Ab+, NAT− donors who fit PHS risk criteria for HCV transmission. Five patients in the treatment group and six patients in the comparator group died prior to time 3 of data collection; an additional 26 patients in the comparator group were excluded due to incomplete data prior to time 3 of data collection. The final sample size was 32 patients in the treatment group and 123 in the comparator group. KTRs comprised 66% of the treatment group and 74% of the comparator group. Figure 2 depicts the experimental group assignments of analyzed patients.
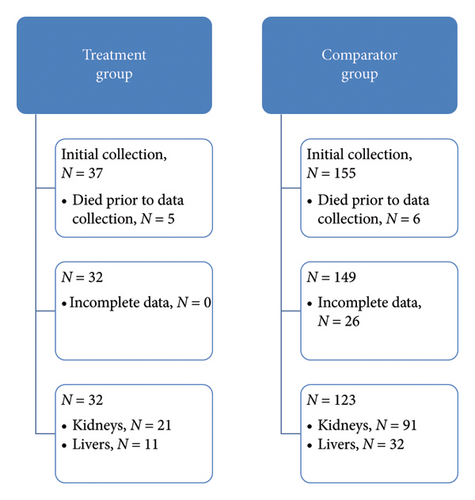
Baseline patient characteristics for treatment and comparator groups are summarized in Table 2. Patients in the treatment group were significantly older on average than those in the comparator group, and LTRs in the treatment group were more likely to meet high risk criteria for IFI and received 14 days of fluconazole prophylaxis than LTRs in the comparator group. Mean time from transplant to DAA initiation post-transplant was 19 ± 10.1 days.
| Characteristics | Treatment | Comparator | p value |
|---|---|---|---|
| Patients | 32 | 123 | |
| Average patient age (years) | 59.5 | 51 | < 0.001 |
| Males (%) | 21 (65.6) | 87 (70.7) | 0.58 |
| DBD (% patients) | 26 (81.3) | 98 (79.7) | 0.84 |
| Kidney transplants (% patients) | 21 (65.6) | 91 (74) | 0.35 |
| Liver transplants (% patients) | 11 (34.4) | 32 (26) | 0.35 |
| IFI risk livers (% livers) | 9 (81.8) | 15 (46.9) | 0.04 |
| IFI risk livers on fluconazole at time 1 (% IFI risk livers) | 7 (77.8) | 7 (46.7) | 0.14 |
| Average time to DAA initiation post-transplant (days) | 19 (SD 10.1) | N/A | |
| Alemtuzumab induction (% patients) | 2 (6.3) | 7 (5.7) | |
| Alemtuzumab induction (% kidneys) | 2 (9.5) | 7 (7.7) | |
| Antithymocyte globulin induction (% patients) | 13 (40.6) | 65 (52.8) | |
| Antithymocyte globulin induction (% kidneys) | 11 (52.4) | 60 (65.9) | |
| Antithymocyte globulin induction (% livers) | 2 (18.2) | 5 (15.6) | |
| Basiliximab induction (% patients) | 8 (25.0) | 24 (19.5) | |
| Basiliximab induction (% kidneys) | 8 (38.0) | 24 (26.4) | |
| Corticosteroid-only induction (% patients) | 9 (28.1) | 27 (22.0) | |
| Corticosteroid-only induction (% livers) | 9 (81.8) | 27 (84.4) | |
| Diabetes mellitus (% kidney recipients) | 8 (38.1) | 23 (25.3) | 0.43 |
| Hypertensive nephrosclerosis (% kidney recipients) | 4 (19.0) | 14 (15.4) | 0.86 |
| Focal glomerular sclerosis (% kidney recipients) | 1 (4.7) | 7 (7.7) | 0.89 |
| Polycystic kidneys (% kidney recipients) | 1 (4.7) | 7 (7.7) | 0.89 |
| IgA nephropathy (% kidney recipients) | 0 | 8 (8.8) | |
| Systemic lupus erythematosus (% kidney recipients) | 0 | 6 (6.6) | |
| Alcoholic cirrhosis (% liver recipients) | 5 (45.5) | 12 (37.5) | 0.34 |
| Nonalcoholic steatohepatitis (% liver recipients) | 1 (9.1) | 6 (18.8) | 0.67 |
| Acute alcoholic hepatitis (% liver recipients) | 1 (9.1) | 3 (9.4) | 0.83 |
| Primary liver malignancy (% liver recipients) | 0 | 4 (12.5) | |
| Autoimmune cirrhosis (% liver recipients) | 0 | 3 (9.4) |
- Note:p values < 0.05 were bolded to indicate significant differences.
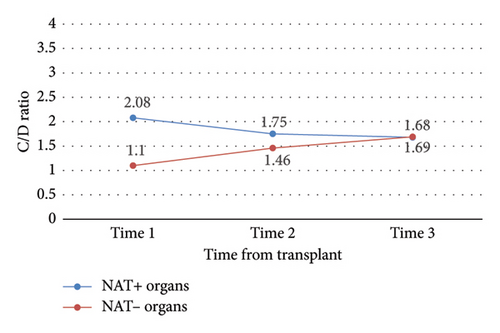
Between study start (time 0) and finish (time 3), the mean change in C/D ratio was significantly different between NAT+ and NAT− (ΔC/D −0.41 vs. 0.59, p = 0.01) organ recipients (Table 3 and Figure 3). By time 3, C/D ratios in the NAT+ group had converged with those of the NAT− group.
| Population | Time | Mean Δ | p value |
|---|---|---|---|
| NAT+ vs. NAT− (primary outcome) | 1 vs. 2 | 0.70 | 0.11 |
| NAT+ vs. NAT− (primary outcome) | 1 vs. 3 | 1.00 | 0.01 |
| NAT+ vs. NAT− (primary outcome) | 2 vs. 3 | 0.30 | 0.12 |
| NAT− all | 1 vs. 2 | 0.37 | < 0.0001 |
| NAT− all | 1 vs. 3 | 0.59 | < 0.0001 |
| NAT− all | 2 vs. 3 | 0.22 | 0.01 |
| NAT+ all | 1 vs. 2 | −0.33 | 0.44 |
| NAT+ all | 1 vs. 3 | −0.41 | 0.26 |
| NAT+ all | 2 vs. 3 | −0.07 | 0.69 |
| SOF/VEL vs. GLE/PIB | 1 vs. 2 | 1.04 | 0.32 |
| SOF/VEL vs. GLE/PIB | 1 vs. 3 | 1.37 | 0.12 |
| SOF/VEL vs. GLE/PIB | 2 vs. 3 | 0.33 | 0.47 |
| NAT+ kidney vs. liver | 1 vs. 2 | 1.45 | 0.10 |
| NAT+ kidney vs. liver | 1 vs. 3 | 1.54 | 0.04 |
| NAT+ kidney vs. liver | 2 vs. 3 | 0.09 | 0.82 |
| NAT− kidney vs. liver | 1 vs. 2 | 0.65 | 0.001 |
| NAT− kidney vs. liver | 1 vs. 3 | 0.71 | 0.004 |
| NAT− kidney vs. liver | 2 vs. 3 | 0.06 | 0.69 |
| NAT− kidney | 1 vs. 2 | 0.54 | < 0.001 |
| NAT− kidney | 1 vs. 3 | 0.77 | < 0.001 |
| NAT− kidney | 2 vs. 3 | 0.24 | 0.03 |
| NAT− liver | 1 vs. 2 | −0.11 | 0.56 |
| NAT− liver | 1 vs. 3 | 0.07 | 0.68 |
| NAT− liver | 2 vs. 3 | 0.18 | 0.13 |
| NAT+ kidney | 1 vs. 2 | 0.17 | 0.71 |
| NAT+ kidney | 1 vs. 3 | 0.12 | 0.73 |
| NAT+ kidney | 2 vs. 3 | −0.04 | 0.84 |
| NAT+ liver | 1 vs. 2 | −1.28 | 0.16 |
| NAT+ liver | 1 vs. 3 | −1.42 | 0.08 |
| NAT+ liver | 2 vs. 3 | −0.13 | 0.72 |
| NAT+ kidney, SOF/VEL vs. GLE/PIB | 1 vs. 2 | 0.45 | 0.66 |
| NAT+ kidney, SOF/VEL vs. GLE/PIB | 1 vs. 3 | 0.83 | 0.28 |
| NAT+ kidney, SOF/VEL vs. GLE/PIB | 2 vs. 3 | 0.38 | 0.41 |
| NAT+ liver, on vs. off fluconazole at time 1 | 1 vs. 2 | 3.44 | 0.04 |
| NAT+ liver, on vs. off fluconazole at time 1 | 1 vs. 3 | 2.73 | 0.07 |
| NAT+ liver, on vs. off fluconazole at time 1 | 2 vs. 3 | −0.72 | −0.59 |
| NAT+ vs. NAT− liver, on fluconazole at time 1 | 1 vs. 2 | 1.72 | 0.12 |
| NAT+ vs. NAT− liver, on fluconazole at time 1 | 1 vs. 3 | 1.74 | 0.12 |
| NAT+ vs. NAT− liver, on fluconazole at time 1 | 2 vs. 3 | 0.02 | 0.95 |
- Note:p values < 0.05 were bolded to indicate significant differences.
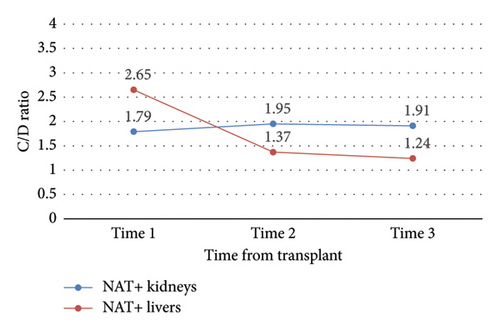
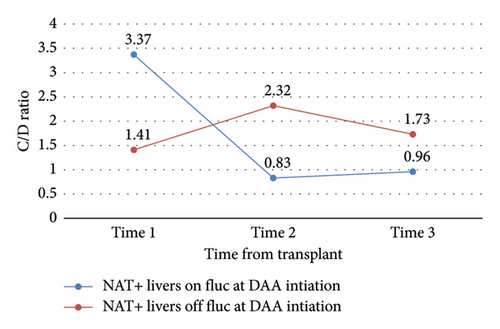
Change in C/D ratio was significantly different from study start to finish between NAT+ KTRs versus LTRs (ΔC/D = 0.12 vs. −1.42, p = 0.04) (Table 3 and Figure 4). NAT+ LTRs who were on prophylactic fluconazole at DAA initiation demonstrated a significant change in C/D ratio from time 1 to 2 (ΔC/D = −2.54, p = 0.04), whereas those who were not on fluconazole at DAA initiation did not (Figure 5). There were also statistically significant increases in C/D ratio from times 1 to 2 (ΔC/D = 0.37, p < 0.0001), 2 to 3 (ΔC/D = 0.22, p = 0.01), and 1 to 3 (ΔC/D = 0.59, p < 0.0001) in NAT− organ recipients (Table 3 and Figure 6). This trend was not detected in NAT− LTRs.
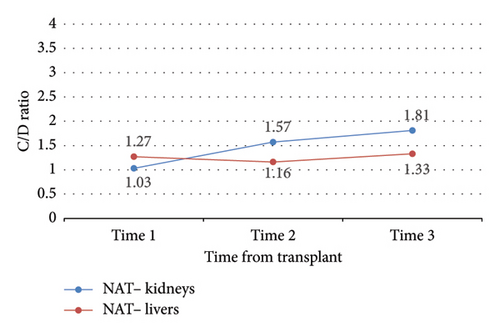
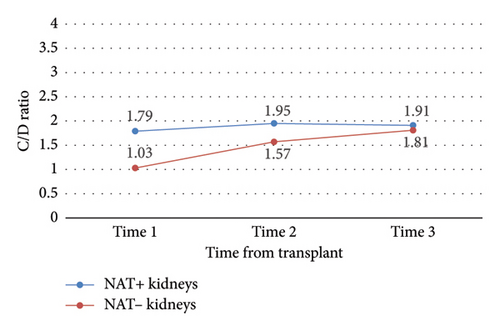
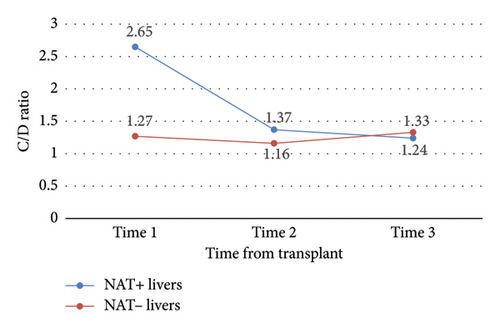
No other outcomes were statistically significant (Tables 3 and 4). Notably, there was no significant difference in C/D ratio changes, nor in mean C/D ratio between study time points, in NAT + KTRs versus NAT − KRTs (Figure 7), NAT + LTRs versus NAT − LTRs (Figure 8), or recipients of SOF/VEL versus GLE/PIB (Tables 3 and 4).
| Population | Time | Mean Δ | p value |
|---|---|---|---|
| NAT+ vs. NAT− kidney | 1 | −0.75 | 0.09 |
| NAT+ vs. NAT− kidney | 2 | −0.38 | 0.19 |
| NAT+ vs. NAT− kidney | 3 | −0.10 | 0.77 |
| NAT+ vs. NAT− liver | 1 | −1.39 | 0.07 |
| NAT+ vs. NAT− liver | 2 | −0.21 | 0.61 |
| NAT+ vs. NAT− liver | 3 | 0.10 | 0.70 |
| NAT+ kidney, SOF/VEL vs. GLE/PIB | 1 | −0.69 | 0.35 |
| NAT+ kidney, SOF/VEL vs. GLE/PIB | 2 | −0.24 | 0.67 |
| NAT+ kidney, SOF/VEL vs. GLE/PIB | 3 | 0.14 | 0.80 |
| NAT+ liver, on vs. off fluconazole at time 1 | 1 | −1.96 | 0.17 |
| NAT+ liver, on vs. off fluconazole at time 1 | 2 | 1.49 | 0.19 |
| NAT+ liver, on vs. off fluconazole at time 1 | 3 | 0.77 | 0.18 |
| NAT+ vs. NAT− liver, on fluconazole at time 1 | 1 | −1.31 | 0.25 |
| NAT+ vs. NAT− liver, on fluconazole at time 1 | 2 | 0.41 | 0.22 |
| NAT+ vs. NAT− liver, on fluconazole at time 1 | 3 | 0.43 | 0.27 |
4. Discussion
The current study showed a significant difference in change in tacrolimus C/D ratio over time in recipients of HCV NAT+ organs compared to recipients of HCV NAT− organs. During the study period, NAT− organ recipients required progressively less tacrolimus to reach a given concentration while NAT+ organ recipients required progressively more tacrolimus to reach a given concentration. However, this trend was not observed in NAT− LTRs.
Significant increases in C/D ratio over the entire study period in NAT− KTRs indicate that this population required significantly less tacrolimus over time to reach therapeutic goal. Of note, 15 out of 32 (47%) of analyzed LTRs received at least two weeks of fluconazole prophylaxis; therefore, C/D ratio predictably decreased over time as fluconazole was discontinued and the resulting interaction with tacrolimus resolved. Tacrolimus is also metabolized by the liver, and metabolic function may require up to 6 months to fully recover after transplant; as this occurs, rate of drug metabolism may vary [13]. Tacrolimus dose requirements therefore vary drastically between LTRs, validating our institution’s post-transplant tacrolimus concentration lab schedule. In fact, average changes in C/D ratio over time within NAT+ LTRs were the sharpest detected in this study (ΔC/D = −1.28 from time 1 to 2 and −1.42 from time 1–3), but high variability in this population led to a lack of statistical significance. NAT+ KTRs also yielded relatively high C/D ratio variability.
Significantly different changes in C/D ratio from study start to finish between NAT+ KTRs versus LTRs, as well as NAT− KTRs versus LTRs, imply that changes in tacrolimus metabolism were not similar between organ types. However, the authors were unable to fully adjust for confounding factors that may have influenced these findings. Given the retrospective design, tacrolimus troughs confounded by improper dosing or timing, as well as acute illness, were correctable via manual chart review, as these factors are often documented and easy to adjust. However, existing documentation is confounded by outpatient recall and truthfulness. Furthermore, drug–drug, drug–food, and drug–disease interactions are also common in tacrolimus recipients; fluconazole prophylaxis due to IFI risk, for example, is protocolized at our institution and always documented. Other CYP3A4, CYP3A5, and/or P-glycoprotein-mediated interactions as well as timing of medication administration with or without food are less precisely documented in charts and were not able to be accurately collected.
Further limitations include retrospective cohort study design and manual chart review, both of which may contribute to incomplete or low-quality data, especially with regard to confounding factors as discussed. It is also not yet known whether C/D ratio correlates with tacrolimus efficacy, although prior studies tell us that it does correlate with safety—low C/D ratios, which indicate that a patient requires a high dose of tacrolimus to reach goal, are associated with nephrotoxicity [12]. Tacrolimus is also affected by many interpopulation pharmacokinetic variabilities including age, genetic polymorphisms, diurnal variations, and various others for which clinicians cannot always empirically adjust [15].
Noting the high variance in our treatment population and relatively small study size, the results of this study do not validate empiric tacrolimus dose adjustments based on DAA agent or donor NAT status. Changes in tacrolimus metabolism do not appear to be similar between organ types; however, a high proportion of LTRs in the NAT+ group received a two-week course of fluconazole, a known CYP3A4 inhibitor, after transplant and remained on this medication through DAA initiation. This concurrent therapy presents a probable cause for comparatively low initial tacrolimus requirements seen in the affected population.
While the result of this study did detect differences in tacrolimus metabolism between NAT+ and NAT− organ recipients, the effects of confounding factors—especially drug–drug interactions with fluconazole—that could have contributed to these differences were shown to be statistically significant. Therefore, the authors cannot conclude that there is any statistically or clinically significant correlation between C/D ratio changes and DAA therapy, nor between C/D ratio and NAT status. However, given the numerous confounding factors at play, it is not surprising that interpatient trough variability was generally quite high, and a larger study may have been able to detect differences in tacrolimus pharmacokinetics where this study did not. This study reinforces the need for diligent personalization and close follow-up of tacrolimus therapy, especially in patients undergoing antiviral courses immediately post-transplant. Opportunities for future research include a larger multicenter study to reduce heterogeneity in C/D ratio (especially in NAT+ patients) and strengthen internal validity. A prospective cohort study initiated prior to planned therapy may also yield stronger conclusions. Omitting patients with known confounding interactions and performing a more extensive, data-driven chart search in these larger studies may unmask tacrolimus–DAA interactions that our study was not powered to detect. Finally, collecting additional data points before and after DAA initiation—wherein our most striking disparities in C/D ratio were seen—may help to elucidate exactly when these changes take place post-transplant, and what populations, if any, might require tacrolimus dose adjustments as a result.
Nomenclature
-
- AASLD
-
- American Association for the Study of Liver Diseases
-
- DAA
-
- Direct-acting antiviral agent
-
- SOF/VEL:
-
- Sofosbuvir/velpatasvir
-
- GLE/PIB
-
- Glecaprevir/pibrentasvir
-
- HCV
-
- Hepatitis C virus
-
- NAT
-
- Nucleic acid test
-
- NAT+
-
- Nucleic acid test positive
-
- NAT−
-
- Nucleic acid test negative
-
- SVR12
-
- Sustained virologic response at 12 weeks
-
- C/D
-
- Concentration-to-dose
-
- KTR
-
- Kidney transplant recipient
-
- LTR
-
- Liver transplant recipient
-
- DBD
-
- Donation after brain death
-
- DCD
-
- Donation after cardiac death
-
- IFI
-
- Invasive fungal infection
-
- ΔC/D
-
- Change in concentration-to-dose ratio
-
- PHS
-
- Public Health Service
Conflicts of Interest
The authors declare no conflicts of interest.
Author Contributions
Jared Walz: design, data collection, manuscript preparation, analysis, and editing; Glen Leverson: design, data collection, statistics, analysis, and editing; Lily Stalter: data collection, statistics, and analysis; John Rice and David Al-Adra: concept, design, analysis, and editing; and Joshua J. Wiegel: original concept, design, manuscript preparation, analysis, and editing.
Funding
The authors received no financial support for the research, authorship, and/or publication of this article.
Acknowledgments
The authors would like to thank Bridget Welch for her work related to this piece. This study was not funded.
Open Research
Data Availability Statement
The data that support the findings of this study are available on request from the corresponding author. The data are not publicly available due to privacy or ethical restrictions.


