Energy Detector–Based Spectrum Sensing in Cognitive Radios Over Fading Channel
Abstract
Cognitive radios (CRs) are envisioned as a potential solution, to provide spectrum-efficient communication for futuristic wireless communication systems like the Internet of Things (IoT) and others. This article examines the efficiency of CR’s detection performance over the fading channel. The fading model is a generalized fading model intended to collectively quantify channel nonlinearity and shadowing effects. Therefore, the effect of channel nonlinearity and shadowing together on CR detection performance has been studied. New analytical formulas for the average probability of detection (APOD) for a single user and cooperative detection are obtained for energy detection (ED)–based spectrum sensing (SS). Additionally, to provide a deeper understanding of detection characteristics, expression for the area under the receiver operating characteristics is also obtained. The effectiveness of CR detection under various nonlinearity and shadowing effects is investigated using the developed analytical expressions, and the results indicate that performance degrades as channel impairments increase. At last, Monte Carlo simulations are employed to demonstrate that the obtained analytical expressions are valid.
1. Introduction
Cognitive radio (CR)–based systems are a clear approach to the problem of increasing spectral demand as CRs are founded on the core principle of making the best possible use of the spectrum that is already in use. For a CR device to deliver improved quality of service without affecting existing communicating primary users (PUs), it is important to perform spectrum sensing (SS) or find spectrum holes accurately. The energy detection (ED)–based SS, which was first presented by Urkowitz [1], is still recognized as one of the most expedient SS strategies, due to its simple structure and speedy decision capacity without the requirement for any prior knowledge about PU signals. The efficacy of ED-based SS communication systems is degraded severely due to channel fading effects, and hence it is important to characterize these fading channels appropriately to compute the received signal accurately and to implement the CR technology effectively. The performance of communication systems under various short-term fading conditions, including Nakagami, Weibull, and Rayleigh, has been extensively studied in prior works [2–4] and their cited references. Furthermore, various studies have presented the impact of these conventional fading scenarios on the performance of ED; as an illustration, the authors in [5, 6] accounted for Rayleigh, Rician, and Nakagami channels with and without diversity reception.
Recent investigations indicate that traditional fading models do not adequately represent experimental data in certain futuristic communication having nontraditional communication venues like machine-to-machine (M2M), vehicle-to-vehicle (V2V), mobile-to-mobile communications, indoor-to-outdoor propagation in 5G and beyond networks, or communication inside confined areas like trains, buses, and airplanes [7, 8]. It has been observed that to underscore such propagation scenarios, there is a need for a comprehensive and flexible channel model that can capture the diverse fading behaviors and characterize them accurately. Consequently, significant research over the past few decades has focused on developing generalized channel fading models for robust analysis and to better predict the performance of modern communication technologies accounting for nonhomogeneity, nonlinearity, multipath, and shadowing. To account for the multipath and shadowing effects, few research studies have been presented; for instance, a unified technique for determining detection probability under fading conditions with diversity reception has been introduced in [9].
In addition to multipath effects, a wireless signal also experiences shadowing effects. The authors in [10, 11] evaluated ED performance over composite fading channels. Furthermore, line-of-sight (LOS) and non-LOS fading scenarios can be described by κ − μ and η − μ fading models, and the effectiveness of the ED in both scenarios has been studied in [12, 13]. A more generalized variant of the κ − μ and η − μ fading models is the fading α − η − κ − μ model introduced in [14], and ED performance for the channel has been investigated in [15]. Further, the approximation of the linearity and homogeneity in the channel model accounted for in the conventional fading distribution needs to be justified since the diffuse scattering field demonstrates spatial correlations at surfaces creating a nonlinear environment [16]. To investigate this nonhomogeneity, two fading distributions, the κ − μ distribution and η − μ distribution, were introduced in [17–19]. Additionally, the α − μ distribution was recently proposed to further explore the nonlinearity of the propagation medium [20]. The authors in [21] presented a unified model for the composite η − μ/gamma, κ − μ/gamma, and α − μ/gamma distributions based on a mixture gamma distribution mixture gamma distribution. The authors in [22] proposed the κ − μ shadowed fading distribution.
Further, the authors in [23] explored the use of the inverse gamma distribution for characterizing composite fading channels. The α − κ − μ shadowed fading distribution was later proposed as an extension of the κ − μ shadowed fading distribution [24]. The composite distributions introduced in this letter uniquely account for both shadowing effects and the nonlinearity of the propagation medium, offering greater flexibility by encompassing other well-known distributions such as κ − μ/inverse gamma and η − μ/inverse gamma distributions [25]. The authors in [26] presented the and composite fading distributions. The two distributions generalize the two well-known composite fading distributions, namely, the η − μ/inverse gamma and the κ − μ/inverse gamma distributions. The fading distribution is shown to present a versatile fading channel as various well-known fading channels in the literature can be obtained under its special cases. Since the new distributions jointly consider the nonlinearity of the propagation media and shadowing, it is expected that they can provide better flexibility to characterize wireless fading channels compared with other distributions in the literature, such as the α − η − μ [27], α − κ − μ [24, 27], η − μ/inverse gamma, and κ − μ/inverse gamma distributions [25].
- •
We first derive a novel mathematical expression for the average probability of detection (APOD) by considering the PDF expression for the fading.
- •
With the aid of a single SU APOD, the detection performance for a cooperative communication scenario is evaluated.
- •
Finally, to better understand how various parameters impact ED performance, we derive a novel analytical formulation for the average area under the receiver operating characteristics curve or AUC.
The subsequent sections are organized as follows.
The system model for the ED process and the fading model is described in Section 2. Two performance indicators, i.e., APOD and AUC over the specified fading environment, are deduced in Section 3. Section 4 presents numerical simulation and an associated discussion for different fading situations. Section 5 concludes by summarizing the major findings of the article.
2. System Model
The system model comprises energy detector–based CR SS. This process is sequentially carried out through multiple stages: Firstly, a bandpass filter (BPF) is employed to select the specific frequency band of interest from the received signal s(t) and serve as a prenoise filter. The filtered signal is then passed through a squaring device, where the signal undergoes squaring to emphasize the energy content. Following this, the squared signal is integrated over a predefined time period to compute the total energy within the selected frequency band. Finally, the computed energy Y is compared to a predefined threshold (λth) value using a decision device. If the energy exceeds the threshold, the presence of a PU signal is inferred; otherwise, the absence of a PU signal is concluded.
Figure 1 illustrates the procedure for ED-based SS. As shown in (1), the received signal s(t) is distinguished by hypothesis Ho or H1 corresponds to the received noise or received transmitted signal impaired with noise respectively. As illustrated in (1), the received signal s(t) can be classified into hypothesis H0 or H1 which corresponds to received noise or a received PU signal that has been corrupted by noise.

2.1. The Fading Model
3. ED Over Fading Channel
Multipath propagation through the wireless channel results in unpredictable amplitude fluctuations at the receiver terminal, weakening CR detection ability, and hence the receiver characteristics should be studied while taking adequate fading conditions into consideration. This section will analyze two ED-based SS performance metrics in the context of fading scenario: (i) APOD and (ii) average area under the ROC curve (AUC). Here, ROC refers to the receiver operating characteristic, an important performance metric used to evaluate the effectiveness of the ED process. It leads to reduced interference and improved sensing performance.
3.1. Single User Detection
Hence, the Q(.,.) function in (5) is rewritten as .
Now using ([30], eq (8.445)), we expand the modified Bessel function as and rewrite the function as .
3.2. Cooperative SS
3.3. Average Area Under the ROC ()
4. Results and Discussion
This segment evaluates the ED-based SS performance over α − κ − F fading channel, using various numerical simulations of derived mathematical expressions and Monte Carlo recreations. To show the analysis detection performance of various ROCs ( vs. pfa), vs. SNR and AUC curves are plotted and variants are presented for different channel-related parameters.
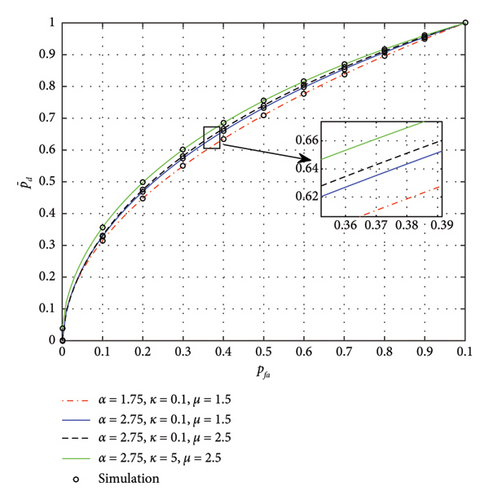
Figure 2 depicts the vs. pfa plots, i.e., ROC for ED-based SS with SNR = 0 dB, d = 1, and with light shadowing (ms = 50) conditions. An improved APOD is observed with a higher pfa, as higher pfa needs a lower detection threshold and therefore enhanced detection performance. APOD is also improved for the increased value of the parameters α, κ, and μ, whereas the relative impact of κ is lower than other parameters on detection probability.

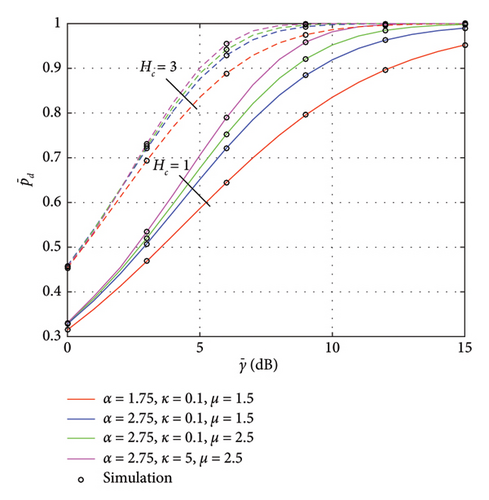
Figure 3 shows vs. SNR plots for collaborative SS over the α − κ − F fading with pfa = 0.1, ms = 50, and d = 1. Note that APOD improves with the involvement of collaborative users; however, the effectiveness of collaborative detection is constrained by the severity of channel-related parameters. Moreover, APOD is improving with the increase in SNR as the effect of fading reduces for higher SNRs.

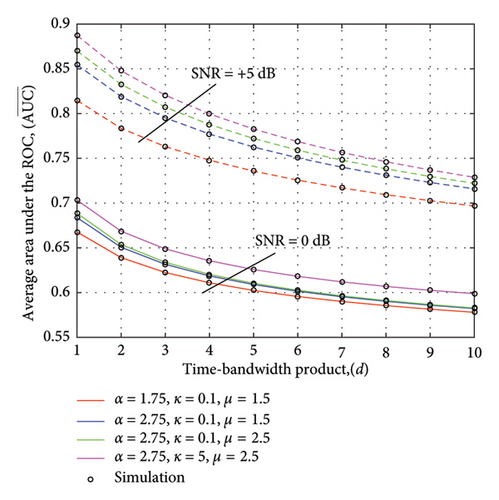
Figure 4 shows AUC vs. d curves with ms = 50 and at SNR = 0 and +5 dB. As seen in the plot, an improved AUC performance is detected for higher SNRs; this can be related to the fact that at higher SNRs, the impact of the unknown noise power level on the energy detector’s performance is reduced, leading to improved AUC as the signal becomes more distinguishable from the noise. Resultantly, the detector can achieve higher detection accuracy and lower false alarm rates, ultimately enhancing the overall performance as reflected by the AUC curve in Figure 4.

Furthermore, a lowered AUC trend is observed at the larger value time-bandwidth products, and the explanation for the behavior is as follows: With increased time-bandwidth products, both APOD and false alarm probability increase, while false alarm probability increases with a higher rate as compared to APOD variation, leading to a fall in overall AUC performance.
5. Conclusion
The efficacy of ED-based SS has been assessed over the fading environment. New analytical mathematical expressions for APOD and AUC are derived over the given fading channel. Obtained results are generalized and take both channel nonlinearity and shadowing effects into account simultaneously. It has been demonstrated that channel nonlinearity and shadowing effects significantly negatively impact detector performance and that incorporating diversity reception and cooperative SS can boost detection performance. Along with that, diversity reception and cooperative SS also limit the severity of channel nonlinearity effects. A comparative analysis embracing channel nonlinearity and shadowing effects is helpful for quantifying CR detection sensitivity in various wireless propagation conditions and building CR-based communication systems.
Ethics Statement
The authors have nothing to report.
Consent
The authors have nothing to report.
Conflicts of Interest
The authors declare no conflicts of interest.
Author Contributions
All the listed authors have made a substantial contribution to the research, and their contributions can be listed as follows.
Rahul Kumar: conceptualization and problem formulation.
Jagadeesh Chandra Prasad M.: analytical development and validation.
Shweta Singh: MATLAB simulations and data analysis.
Nithin Varma Malathkar: revision process and finalization.
Funding
The authors received no specific funding for this work.
Open Research
Data Availability Statement
The result/plot data used to support the findings of this study are included within the article.


