Performance Analysis of Gray-Coded DP-16QAM MIMO-FSO Systems With Coherent Detection and DSP Techniques
Abstract
The performance of a gray-coded dual polarization-16 quadrature amplitude modulation (DP-16 QAM)–based multiple input multiple output (MIMO)-FSO link using coherent detection and digital signal processing (DSP) is investigated. The MIMO link is used to mitigate geometric loss, atmospheric attenuation, and atmospheric turbulence. Additionally, a coherent receiver with DSP algorithms is used to improve channel capacity, receiver performance, and link range. The performance of the system is evaluated by constellation diagrams, RF and optical power spectra, bit error rate (BER), and error vector magnitude (EVM). It is observed that before DSP, the constellation diagrams are distorted, whereas after DSP, distinct constellation symbols are observed. The system possesses a spectral efficiency of around 4.62 b/s/Hz. The longest link range to attain the acceptable BER limit is achieved under 4 × 4 MIMO weak turbulence levels in clear air conditions, which is 11.55 km, while the shortest is achieved under SISO strong turbulence levels in light fog conditions, which is 0.895 km. After the channel impairments are mitigated by DSP, the simulation results show that the MIMO link outperforms the SISO link in all scenarios.
1. Introduction
Recently, there has been a dramatic rise in demand for high-speed data and multimedia services, such as high-speed internet, video conferencing, and live streaming, which has caused the radio frequency (RF) spectrum to become congested. Because of this, an optical carrier is now required instead of an RF carrier [1, 2]. As a result, free-space optical (FSO) communication systems have been a potential solution in recent times due to their various advantages. Some of these are low installation and operating costs, low power consumption, license-free spectrum, large bandwidth, security, flexibility, high speed, small size, and light weight [2–5]. Its applications are found in deep space communication, backhaul for wireless cellular networks, remote sensing, military applications, inter-satellite communications, terrestrial communications, inter-building communications, and disaster recovery [3, 6]. However, its performance is limited by geometric loss, atmospheric attenuation, and atmospheric turbulence, which deteriorate the performance of the link [6, 7]. A variety of mitigation technologies are used to overcome these channel-induced losses, including adaptive optics, aperture averaging, multiple input multiple output (MIMO), hybrid FSO, channel coding, robust modulation formats, and so on [7, 8].
Different research groups conducted diverse studies and reported their findings to increase the capacity and spectral efficiency of FSO systems, with a particular focus on reducing channel-induced impairments. Previously, Kumar and Teixeira [9] presented a 10 Gbps OFDM-FSO link by using a square root device at the receiver to compensate for signal degradation due to nonlinear photodiodes. The authors reported that a maximum link range of 1800 m was achieved in 4-quadrature amplitude modulation (QAM), at this low capacity. Pottoo, Goyal, and Gupta [10] proposed a 128 Gbps single-channel gray-coded dual polarization (DP)-QPSK with balanced homodyne detection and digital signal processing (DSP) in fair weather conditions. The results revealed that homodyne detection systems exhibit a 3 dB greater receiver sensitivity than heterodyne detection systems. But, the atmospheric turbulence effect was not considered.
Moustafa et al. [11] also simulated SISO and 4 × 4 MIMO FSO links using NRZ, CSNRZ, DBNRZ, and MDBNRZ modulation schemes under different weather conditions and reported that NRZ was better in terms of received power under 4 × 4 MIMO links. However, due to the use of direct detection techniques, the system operates at low capacity. Kakati and Sonkar [12] investigated a DSP-assisted gray-coded DP-16 QAM 64-channel Nyquist-DWDM transceiver for a spectrally efficient long-haul optical interconnect. Gray code shows an OSNR improvement of 0.8 dB and a receiver sensitivity improvement of ≥ 4.6 dBm as compared to differential coding. Due to dense channel spacing, crosstalk is very high. Miglani and Malhotra [13] investigated a 1.28 Tbps (32 × 40 Gbps) system using coherent detection and DSP for performance enhancement under adverse weather and turbulence atmospheric conditions. The DSP-aided coherent DWDM-FSO link shows a 760 m link range increment as compared to IM/DD-based DWDM-FSO links in a SISO system.
In other aspects, to improve the transmission performance, Konda et al. [14] demonstrated the comparison of EDFA and SOA on a single-channel IQM-based PM-256 QAM modulation scheme using coherent detection and DSP. The obtained result showed that the received signal quality is better in the case of EDFA as compared to SOA. However, the atmospheric turbulence effect was not considered. Janu Dimpal and Vijay Janyani [15] analyzed the performance of the FSO link at a link range of 0.6 km and a data rate of 125 Gbps using a single polarization-QPSk modulation scheme under the gamma-gamma channel model. Kakatia and Arya [16] observed the performance of a 120 Gbps single-channel coherent transceiver with a target bit error rate (BER) of 2 × 10⁻³ in an FSO link for different weather conditions.
- •
A gray-coded DP-16 QAM-based MIMO FSO link using coherent detection and DSP is analyzed to transmit a data rate of 120 Gbps and a symbol rate of 15 GBaud. The transmitter uses a DP-16 QAM modulation format for enhanced spectral efficiency, and gray code is used to reduce the BER during symbol recovery. The MIMO system is used to mitigate geometric loss, atmospheric loss, and atmospheric turbulence. Additionally, a coherent receiver with DSP algorithms has been used on the receiver side to mitigate free-space channel loss and improve receiver performance.
- •
Due to the DP-16 QAM modulation format, the system is dual-polarized, which leads to polarization mode dispersion (PMD). In addition, component losses, like Mach–Zehnder modulator (MZM) insertion losses, also affect the overall performance of this system. DSP algorithms such as QI compensation are used to mitigate the amplitude and phase imbalance between the IQ electrical signals caused by inappropriate bias voltages of MZM, misalignment of the polarization splitter and polarization combiner, and imperfections in the optical 90° hybrid. Also, an adaptive equalizer (AE) is used to mitigate inter-symbol interference and PMD; frequency offset estimation (FOE) is used to cancel the frequency mismatch between the transmitter and the local oscillator (LO); and carrier phase estimation (CPE) is used to cancel the phase mismatch between the transmitter and the LO.
- •
We also made performance comparisons between SISO and 4 × 4 MIMO FSO links under the gamma-gamma channel model in clear air, wet snow, medium rain, and light fog conditions under weak and strong turbulence levels. The system’s reliability has been verified using constellation diagrams, RF and optical power spectra, BER, and error vector magnitude (EVM) as performance metrics.
The rest of this paper is structured as follows. In Section 2, the system model and analysis are described. Simulation results and discussion are described in Section 3. Finally, conclusions are drawn based on the result in Section 4.
2. System Model and Analysis
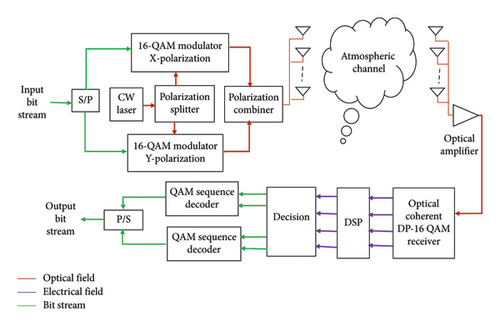
Figure 1 shows the overall block diagram of the MIMO-FSO link with a DP-16 QAM transmitter, an optical amplifier, a DP-16 QAM coherent receiver, a DSP unit, a decision unit, and a decoding unit.
2.1. DP-16 QAM Transmitter
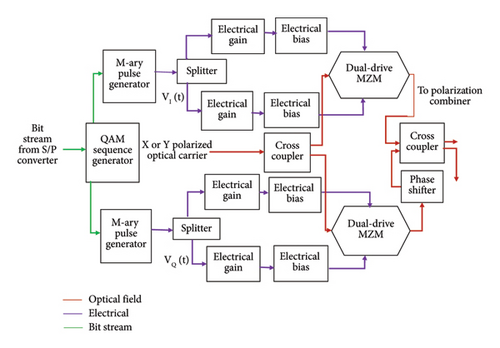
The light wave is split into the X and Y orthogonal polarization components by a polarization splitter, which is used to drive the upper and lower IQM branches. At the input of each IQM section, a cross-coupler with a coupling coefficient of 0.5 is used to send the laser beam along the in-phase and quadrature-phase paths of the IQM [14].
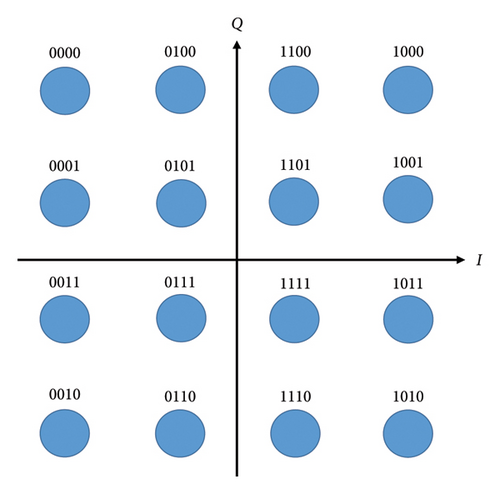
The input bit sequence generated from a PRBS is split into two parallel bit sequences by an S/P converter and sent to the upper and lower IQMs. Two equivalent M-ary symbol sequences are generated from the input binary sequence by 16-QAM sequence generators and sent toward M-ary pulse generators. This bit series is mapped into M symbols in a single bit alteration among any two adjacent symbols as it is shown in Figure 3. This bit mapping is called gray code. Gray code is essential to reducing BER during symbol recovery [10, 12].
In a MIMO link, the transmitter transmits the same signal with the same parameters, and the receiver receives all the transmitted signals and combines them using the equal gain combining (EGC) technique. In this paper, the 4 × 4 MIMO FSO link is used to achieve an optimal balance between performance in mitigating beam divergence loss, geometric loss, and atmospheric turbulence and practical deployment constraints such as hardware complexity and cost.
2.2. FSO Channel
For dry snow, a = 5.42 × 10⁻⁵λ + 5.4958776 and b = 1.38. For wet snow, a = 1.023 × 10⁻⁴λ + 3.7855466 and b = 0.72.
EDFA is used in the system as a preamplifier to enhance the transmission over long link ranges because it has a high pump power utilization, is suitable for long-haul applications, has a low noise figure, is polarization independent, has a very high gain, and is low cost [24].
2.3. Coherent DP-16 QAM Receiver
Figure 4 demonstrates the block diagram of the coherent DP-16 QAM receiver. It consists of CW lasers acting as the LO, polarization splitters for extracting the X and Y polarization components, (2 × 4)90° optical hybrids, balanced detectors (BDs), and electrical amplifiers (EAs).

2.4. DSP
In the DSP unit shown in Figure 5, various step-by-step compensation algorithms are implemented to recover the transmitted symbols from the received electrical signals. The preprocessing stage of each DSP unit includes three functions: noise sources within the transmission bandwidth are converted into signals and added to the sampled optical signal; imperfectly biased voltages of the modulators are compensated by DC blocking; and the 16-QAM grid is used to normalize the received signal.

- a.
Low-pass Bessel filter: A 4th-order low-pass Bessel filter with a bandwidth of 0.75× symbol rate is used to remove the out-of-band noise.
- b.
Resampling: Cubic interpolation is used for resampling the received signal, with symbol rate of = bit rate/8.
- c.
QI compensation: The Gram–Schmidt orthogonalization procedure (GSOP) is used to mitigate the amplitude and phase mismatch between the IQ electrical signals. Consider rI(t) and rQ(t) to be nonorthogonal components of the received signal, and then GSOP produces two orthonormal signals, Io(t) and Qo(t), as follows [26]:
(23a)(23b)(23c) -
where ρ = E{rI(t), rQ(t)} is the correlation coefficient, PI = E{r2(t)}, , and E‹.›denotes expectation operator.
- d.
AE: AE is used to mitigate PMD and ISI. The AE is implemented by using a two-stage constant modulus algorithm-radius directed (CMA-RD). The objective of CMA is to minimize the cost function [18].
(24) -
where y (k) denotes the AE output and RP is a constant whose value depends only on the input data symbol a(k).
- e.
FOE: FOE is used to cancel the frequency mismatch between the transmitter and the LO. The received signal after proper equalization is expressed as [12]
(25) -
where C (k) denotes the data symbols, f denotes the carrier frequency offset, φk denotes the carrier phase, T denotes the symbol period, and n(k) denotes the zero-mean Gaussian random variable. The frequency offset can be minimized by maximizing the spectral density of the fourth power S4(k) of the received signal as [26]
(26) -
where M is the symbol block size.
- f.
CPE: CPE using a blind phase search (BPS) algorithm is used to recover and remove the phase noise by trying different test phases until the optimum phase is found. The received signal Zk is alternated by B test carrier phase angles φb [26]:
(27) -
with b ε{0, 1, …, B − 1}. All the alternated symbols are fed into the decision circuit, and the distance to the nearest constellation points is calculated in the complex plane as [10]
(28) -
where is the decision of .
The electrical signals that are received from the DSP stage are processed by the decision circuit. The output of the decision block is provided to two 16-QAM decoders to decode the sequences for both polarizations. Then, the decoded outputs are combined S/P converter and the output of the S/P converter is again provided as input to a BER tester. A BER tester is used to generate the transmitted bit sequence on the transmitter side and compare it with the received bit sequence.
3. Results and Discussion
The simulation results are evaluated in terms of constellation diagrams, RF and optical power spectra, BER, and EVM performance metrics.
3.1. Simulation Parameters
As the input signal sequence length increases, the performance of the system becomes more reliable and robust. However, that causes limitations on the computer’s memory and total simulation time. As a performance trade-off, typically a sequence length of 65,536 bits with a sample per bit of 4 and a number of samples of 62,144 is sufficient for this research. In addition to this, a set of 100 guard bits is used to analyze the system. The remaining simulation parameters are summarized in Table 1.
| Name of the parameters used | Values of the parameters |
|---|---|
| Data rate | 120 Gbps |
| Symbol rate | 15 GBaud |
| Launch optical power/LO power | 15 dBm |
| Laser linewidth/LO linewidth | 0.1 MHz |
| Lase center wavelength/LO wavelength | 1550 nm (C-band) |
| Transmitter aperture diameter | 5 cm |
| Receiver aperture diameter | 20 cm |
| Beam divergence angle | 2 mrad |
| Atmospheric attenuation | 0.233 dB/km (clear air), 6.2 dB/km (wet snow), 9.64 dB/km (medium rain), 15.5 dB/km (light fog) |
| Refractive index structure constant (C2n) | 5 × 10⁻¹³m−2/3 (strong turbulence) and 5 × 10⁻¹⁷m−2/3(weak turbulence) |
| Forward pumping power of EDFA | 100 mW at 980 nm pumping laser |
| EDFA length | 5 m |
| PIN photodiode responsivity | 1 A/W |
| Dark current | 10 nA |
| BER-FEC limit | 2 × 10⁻³ |
Figures 6(a), 7(a), 8(a), and 9(a) show a distorted, overlapping, and rotating constellation diagram obtained at the input of DSP at a link range of 2 km in wet snow conditions. This is because of the information-bearing signal degradation due to atmospheric attenuation, geometric loss, and atmospheric turbulence. Figures 6(b), 7(b), 8(b), and 9(b) show the constellation diagram after the band noise is filtered out using the 4th-order low-pass Bessel filter. Figures 6(c), 7(c), 8(c), and 9(c) show the constellation diagram obtained after resampling. After AE, marginally clear constellation diagrams are shown in Figures 6(d), 7(d), 8(d), and 9(d). Figures 6(e), 7(e), 8(e), and 9(e) show the constellation diagram after QI compensation. Figures 6(f), 7(f), 8(f), and 9(f) show the constellation after FOE. Figures 6(g), 7(g), 8(g), and 9(g) show the constellation diagram after CPE. As a result, the constellation diagrams at 4 × 4 MIMO-weak turbulence levels are less distorted as compared to 4 × 4 MIMO-strong turbulence. Figure 10(a) shows the optical power spectrum of the system at the transmitter output. The center frequency is at 193.414 THz (i.e., 1550 nm), and the peak power observed at this frequency is around −7.9967 dBm. Spectral efficiency is a measure of how efficiently a communication system uses its allocated bandwidth to transmit data. Mathematically, spectral efficiency (in b/s/Hz) = data rate (in bps)/channel bandwidth (in Hz). The transmission bandwidth, or full width at half maximum, is approximately 25.95 GHz, as observed in Figure 10. For a transmitted data rate of 120 Gbps, the system possesses a spectral efficiency of around 4.62 b/s/Hz. The obtained peak power at a center frequency of 193.414 THz under weak turbulence levels in wet snow conditions is around −40.5516 dBm, whereas under strong turbulence levels in wet snow conditions, it is around −41.5524 dBm. Due to this, the impact of atmospheric turbulence on power loss is insignificant. At the same center frequency, the peak power was reduced from −41.5524 dBm to −60.3094 dBm under strong turbulence levels in light fog conditions as compared to strong turbulence levels in wet snow conditions. The result shows that power loss increases as the atmospheric attenuation value increases. After EDFA, the peak power increased from −41.5524 dBm to −4.8903 dBm under strong turbulence levels in wet snow conditions as compared to strong turbulence levels in wet snow conditions.
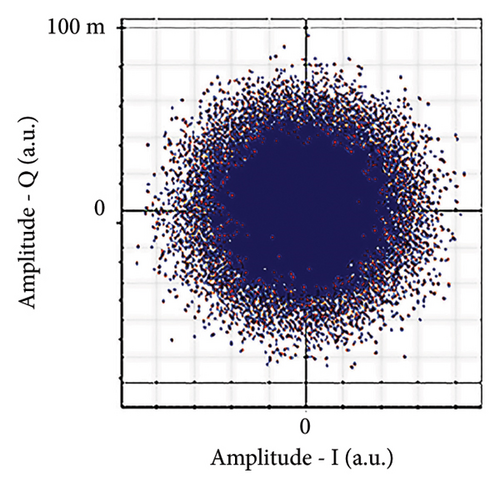
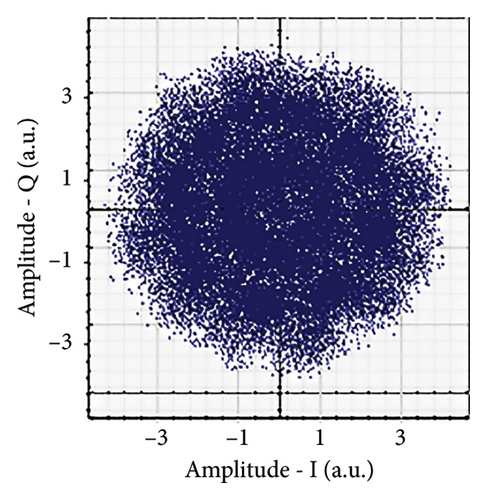
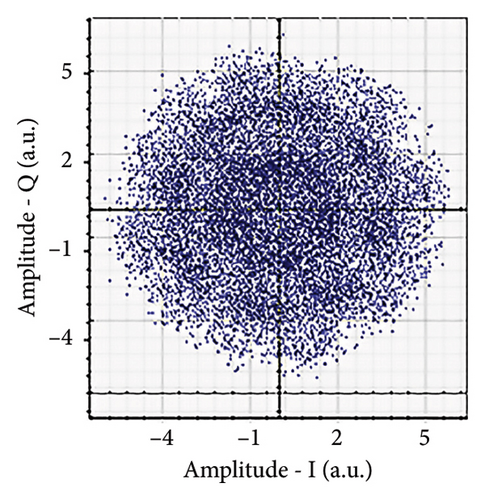
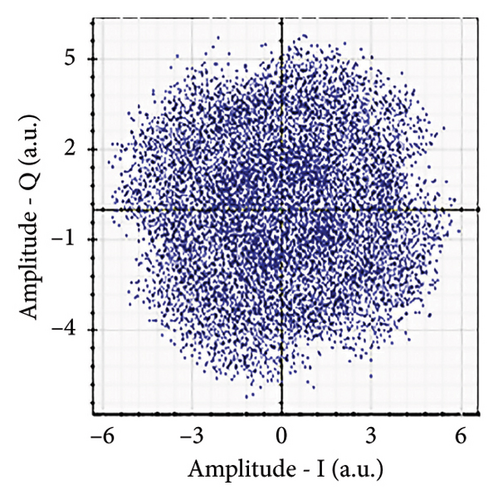
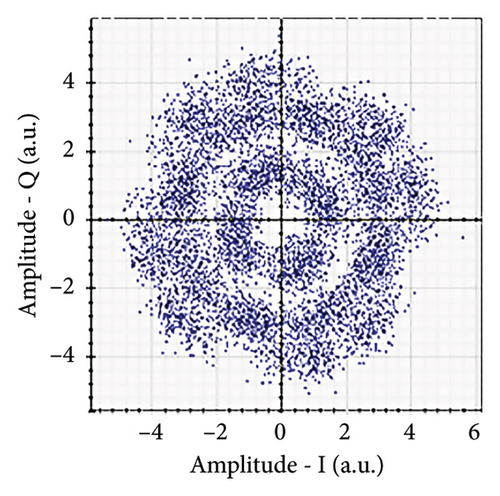
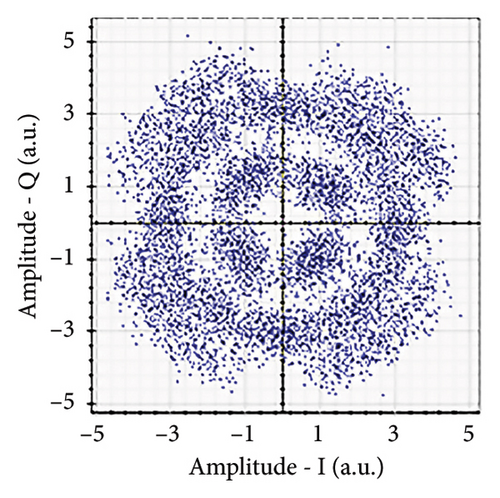
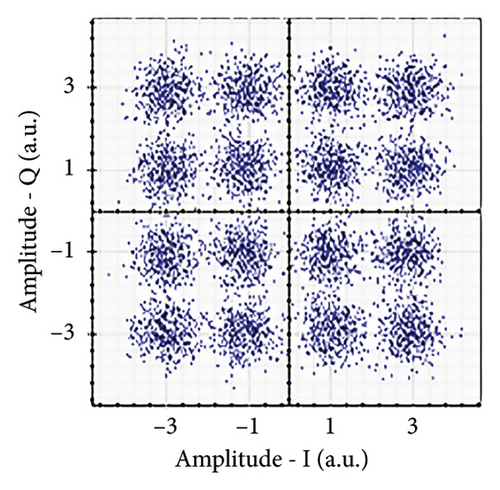
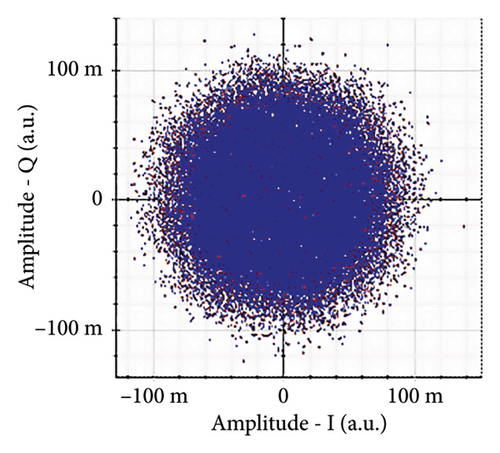
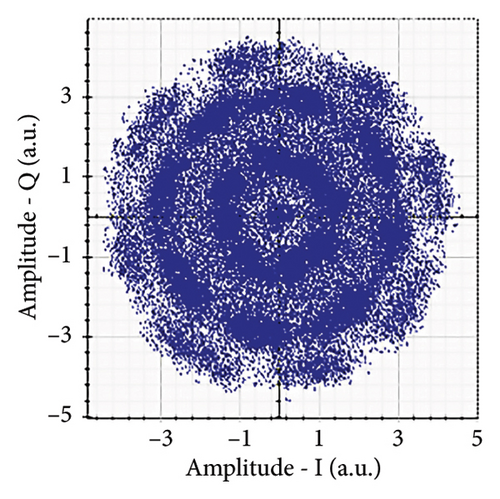
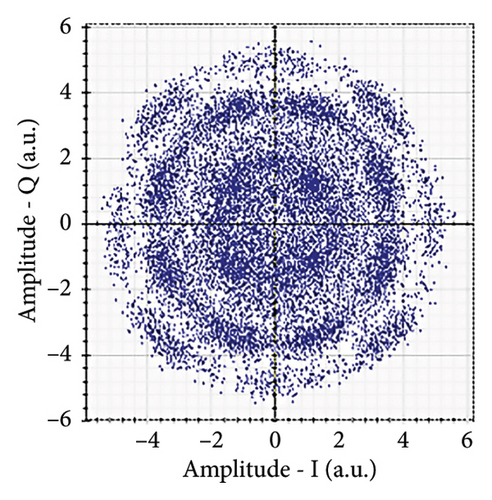
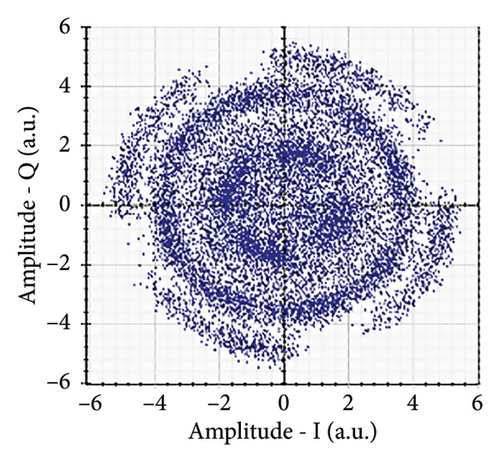
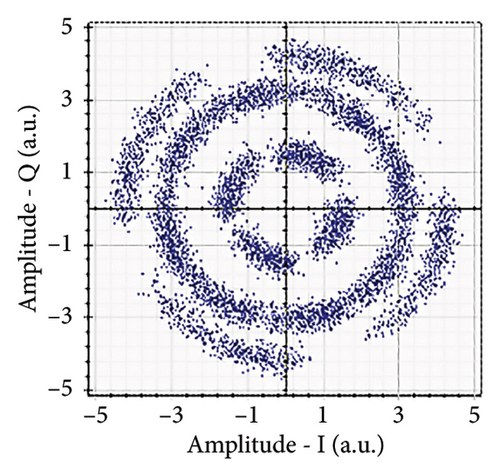
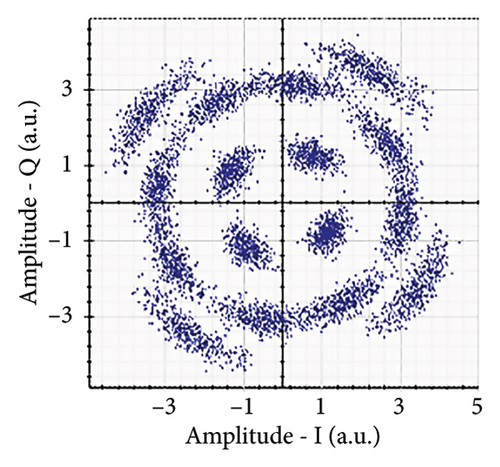
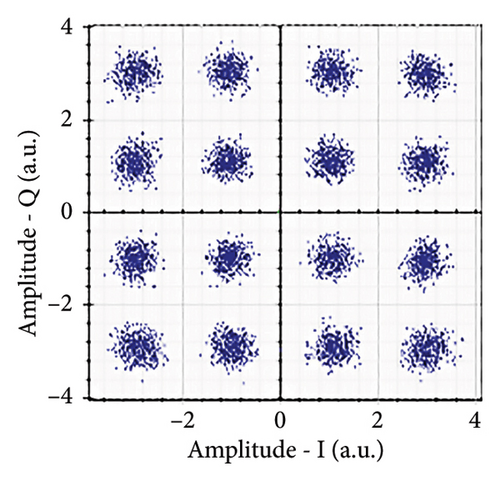
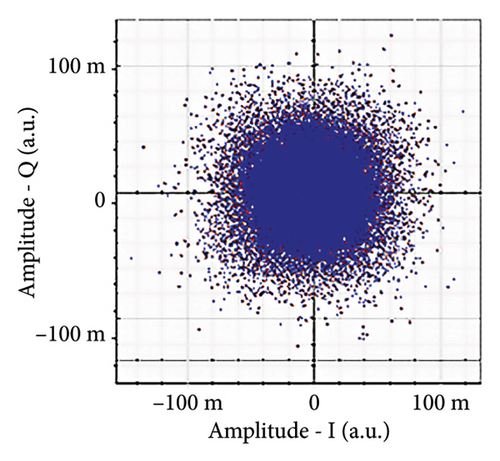
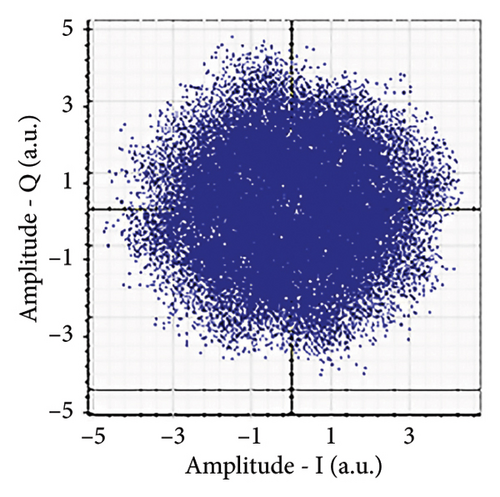
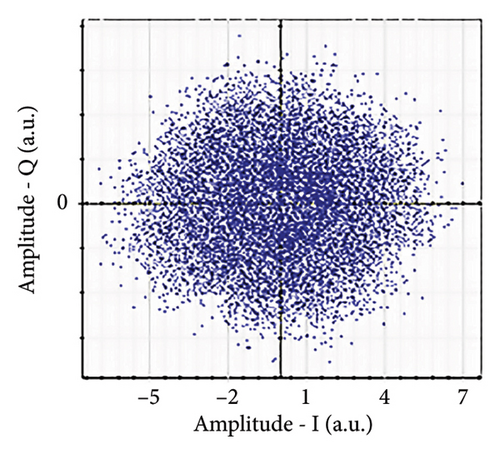
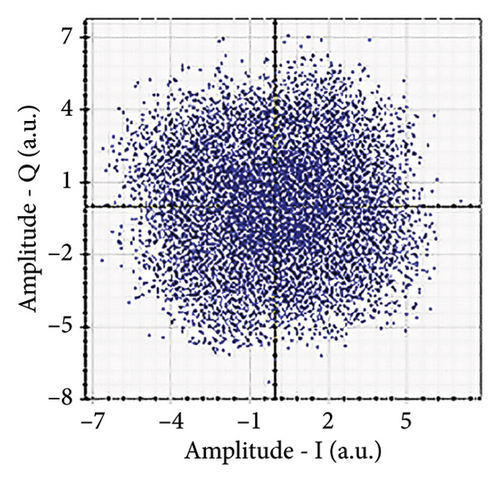
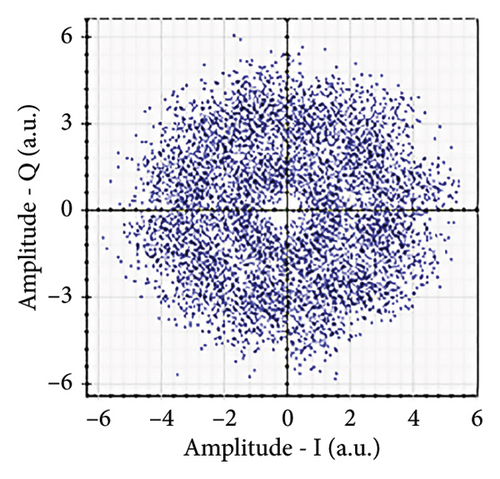
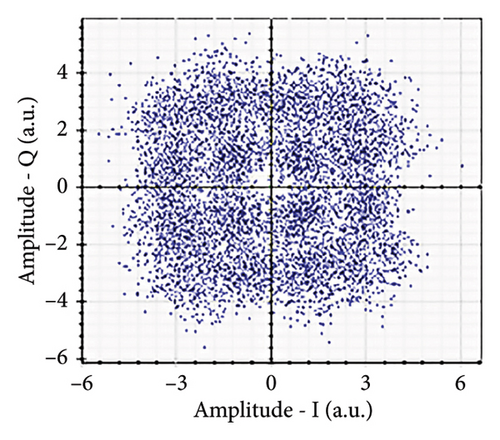
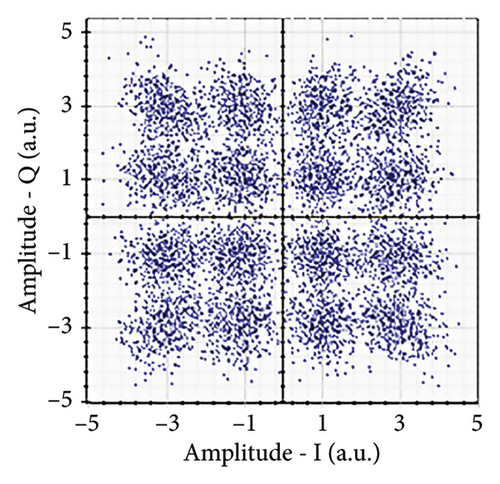

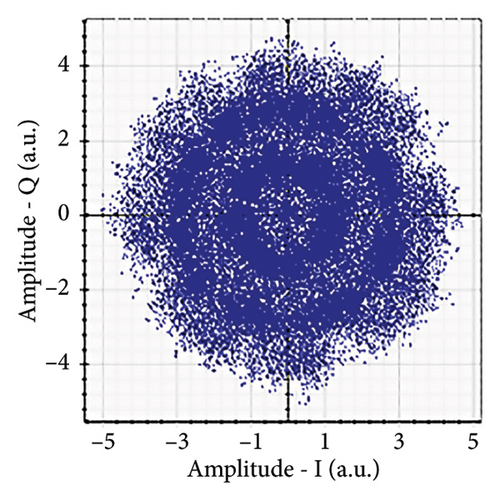
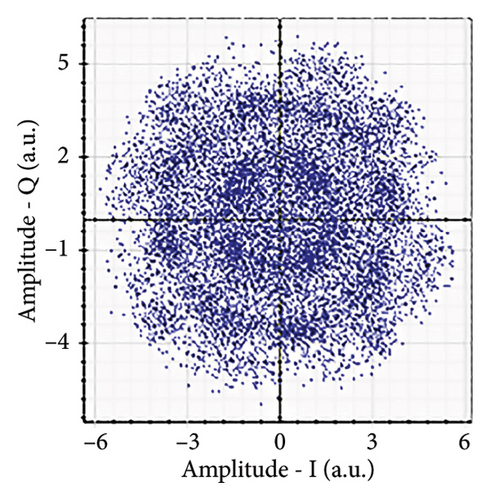
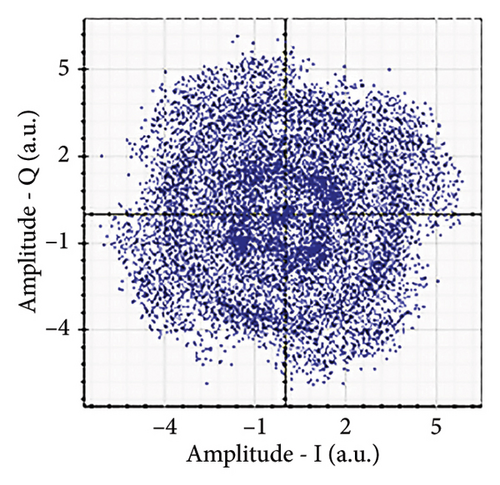
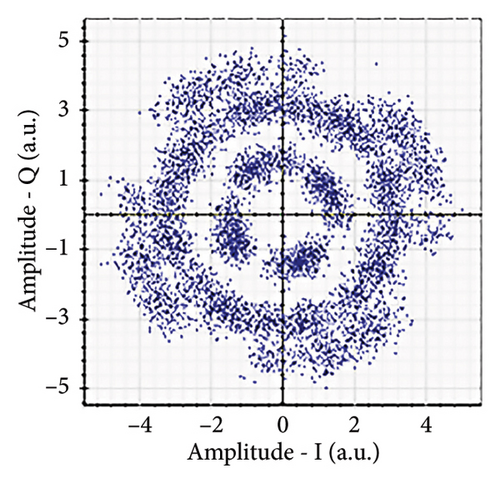
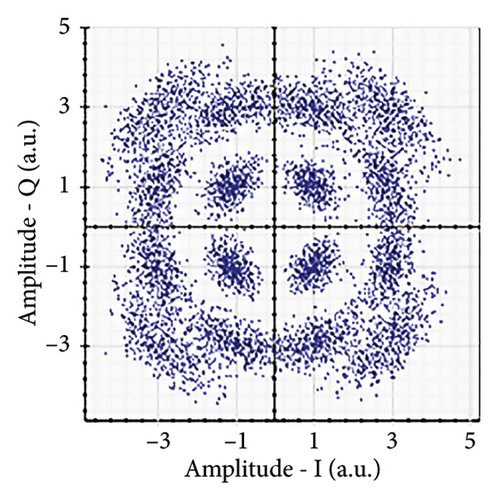

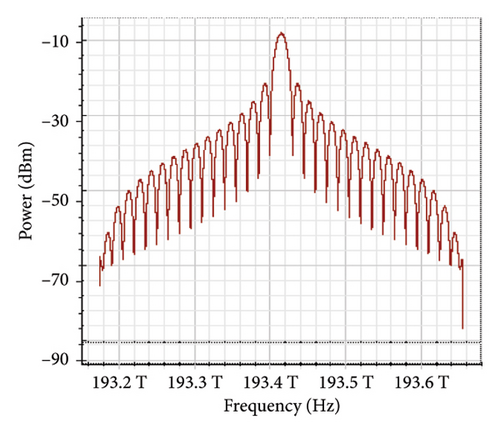
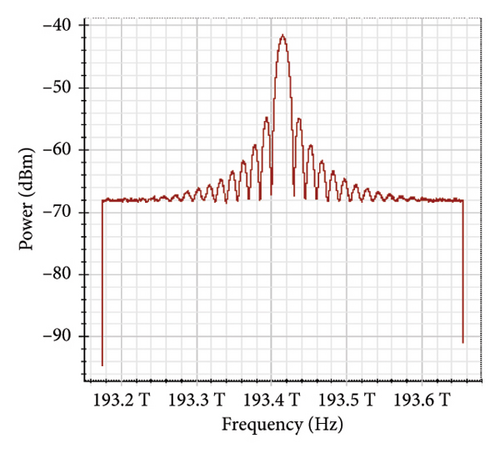
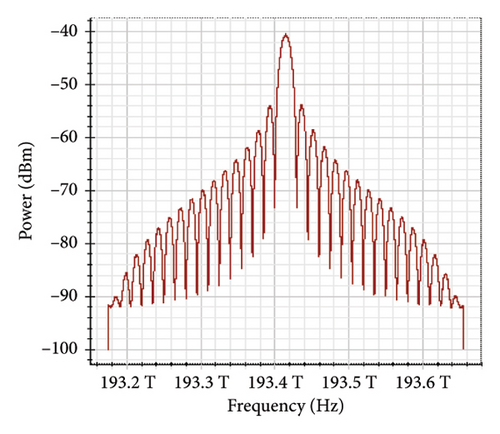
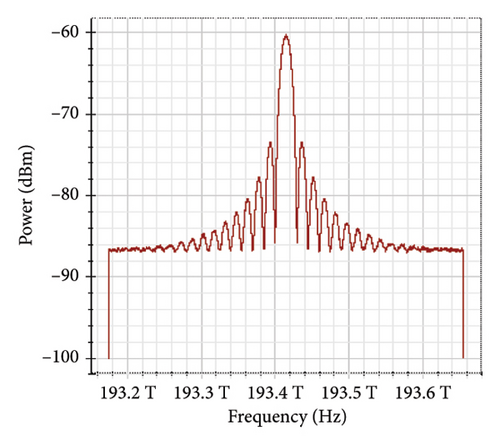
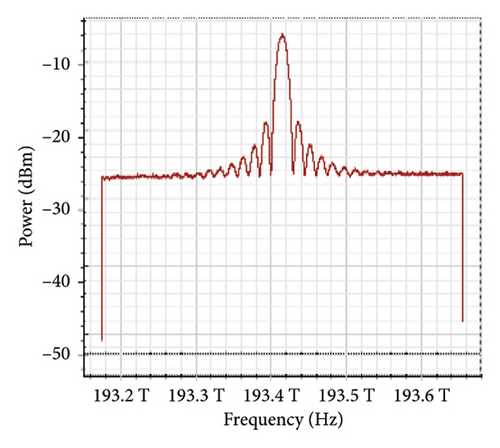
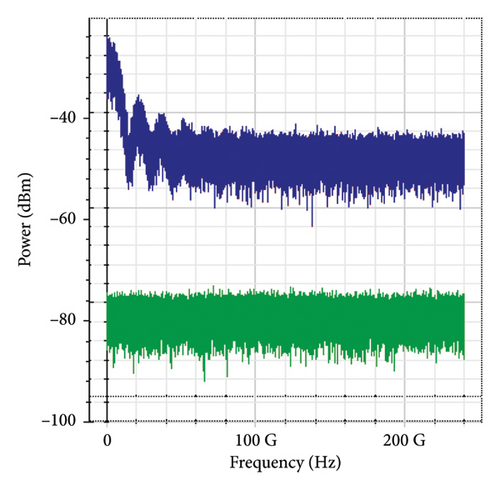
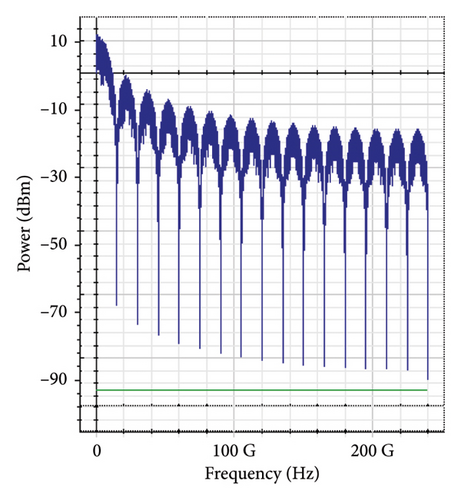
Figure 11 shows the RF power spectrum for strong turbulence levels in wet snow conditions at 2 km in a 4 × 4 MIMO-FSO link. Before DSP, the green color indicates the noise, and blue is the signal; in this case, the signal is weak and has a certain degree of distortion. After DSP, the noise is compensated, and the signal quality has improved.
3.2. Effect of Link Range on the Performance of the System
The BER and EVM results are done after the channel impairments are compensated by the DSP. The results obtained due to the effects of the link range are divided into four parts according to different weather conditions.
3.2.1. Clear Air Conditions
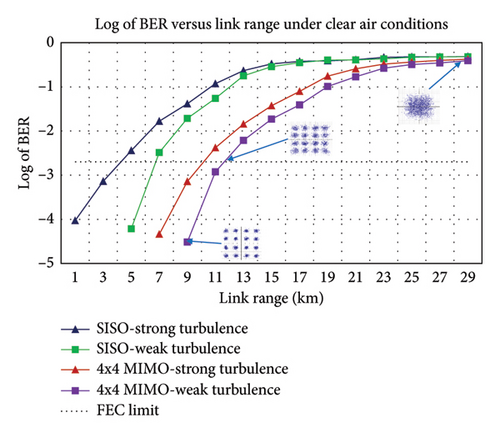
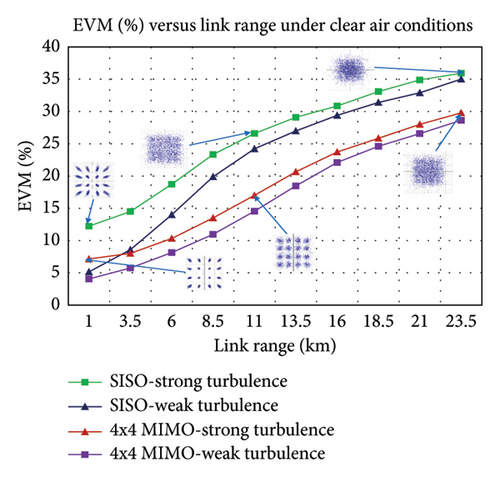
Figure 12(a) shows the BER versus link range plot for clear air conditions. The proposed model can achieve a maximum link range of 4.18 km, 6.6 km, 10.125 km, and 11.55 km in SISO-strong, SISO-weak, 4 × 4 MIMO-strong, and 4 × 4 MIMO-weak turbulence levels, respectively, under acceptable BER-FEC limit. As the link range increases, the BER of the received signal increases due to atmospheric attenuation, geometric loss, and atmospheric turbulence. Figure 12(b) depicts the EVM versus link range plot under clear air conditions. As the link range increases from 1 km to 25 km, the EVM values increase from 12.2348% to 35.9406%, 5.1522% to 35.0269%, 7.15105% to 29.7989%, and 4.05288% to 28.6475% under SISO-strong, SISO-weak, 4 × 4 MIMO-strong, and 4 × 4 MIMO-weak turbulence levels, respectively. As the link range increases, distortion in the constellation diagram increases, due to which information retrieval becomes challenging on the receiver end.
3.2.2. Wet Snow Conditions
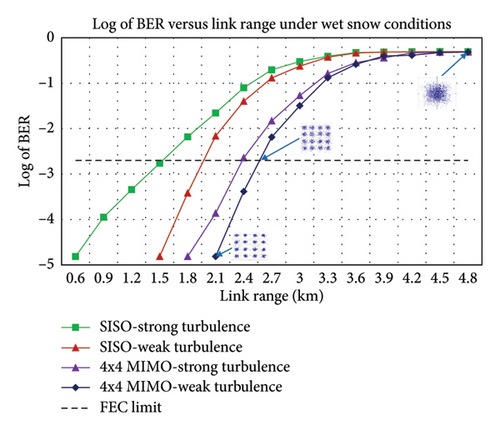
Figure 13(a) shows the BER versus link range plot for wet snow conditions. As the attenuation value increases from 0.233 dB/km to 6.2 dB/km, the maximum link range to achieve the BER-FEC limit decreases to 1.48 km, 1.951 km, 2.378 km, and 2.548 km for SISO-strong, SISO-weak, 4 × 4 MIMO-strong, and 4 × 4 MIMO-weak turbulence levels, respectively.
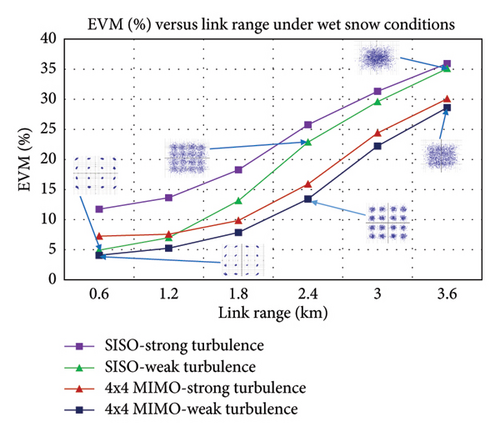
The EVM versus link range graph for wet snow conditions is illustrated in Figure 13(b). Also, at a link range of 1.8 km, the EVM values of 18.2692%, 13.1358%, 9.8594%, and 7.85845% are achieved under SISO-strong, SISO-weak, 4 × 4 MIMO-strong, and 4 × 4 MIMO-weak turbulence levels, respectively.
3.2.3. Medium Rain Conditions
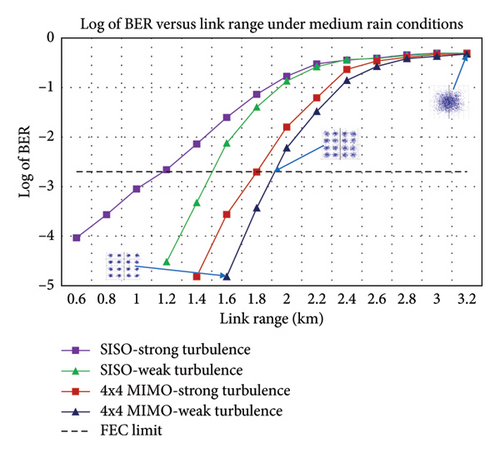
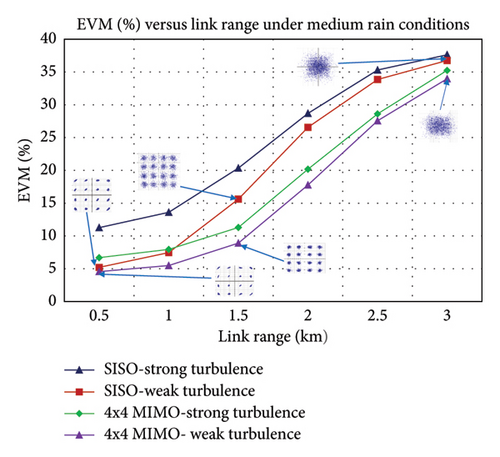
The BER versus link range plot for medium rain conditions is illustrated in Figure 14(a). The BER-FEC limit is obtained at a link range of 1.192 km, 1.499 km, 1.78 km, and 1.906 km under SISO-strong, SISO-weak, 4 × 4 MIMO-strong, and 4 × 4 MIMO-weak turbulence levels, respectively. The EVM versus link range plot for medium rain conditions is shown in Figure 14(b). At a link range of 1 km, the EVM values of 13.6034%, 7.46588%, 7.95825%, and 5.49211% are achieved under SISO-strong, SISO-weak, 4 × 4 MIMO-strong, and 4 × 4 MIMO-weak turbulence, respectively.
3.2.4. Light Fog Conditions
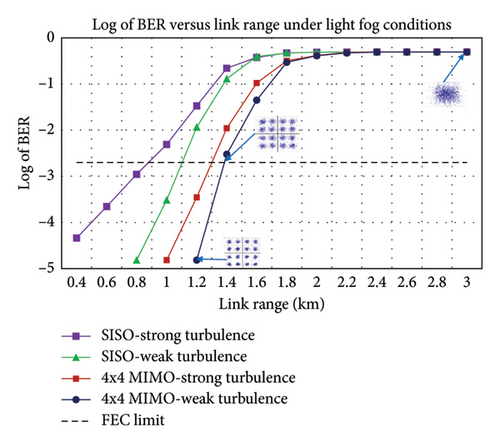
Figure 15(a) shows the BER versus link range graph for light fog conditions. As the attenuation value increases from clear air conditions to light fog conditions, the maximum link range decreases from 4.14 km, 6.6 km, 10.125 km, and 11.55 km to 0.895 km, 1.101 km, 1.297 km, and 1.37 km in SISO-strong, SISO-weak, 4 × 4 MIMO-strong, and 4 × 4 MIMO-weak turbulence levels, respectively.
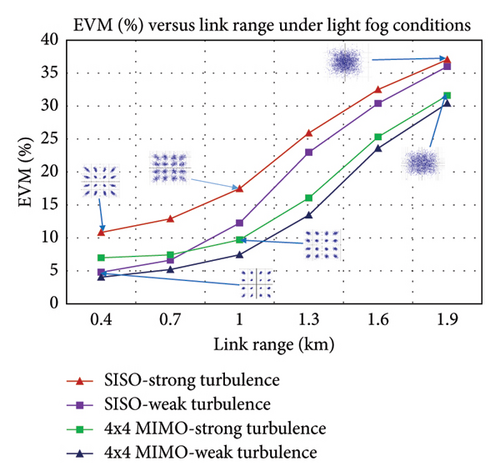
Finally, the EVM versus link range graph for light fog conditions is illustrated in Figure 15(b). The computed values of EVM at a link range of 1 km are 17.4805%, 12.2439%, 9.69993%, and 7.44222% under SISO-strong, SISO-weak, 4 × 4 MIMO-strong, and 4 × 4 MIMO-weak turbulence, respectively. According to the simulation results, the observable tolerance EVM limit to achieve the BER-FEC limit is around 15% for all considered scenarios.
Table 2 shows the performance comparison of SISO and 4 × 4 MIMO-FSO links in terms of the BER at various weather conditions. The 4 × 4 MIMO link improves the link range under different weather conditions as compared to the SISO link. Table 3 also presents performance comparisons with current studies.
| Weather condition | SISO-strong turbulence | SISO-weak | 4 × 4 MIMO-strong | 4 × 4 MIMO-weak |
|---|---|---|---|---|
| Clear air | 4.18 | 6.6 | 10.125 | 11.55 |
| Wet snow | 1.48 | 1.951 | 2.378 | 2.548 |
| Medium rain | 1.192 | 1.499 | 1.78 | 1.906 |
| Light fog | 0.895 | 1.101 | 1.297 | 1.37 |
| Authors | Proposed technique | Data rate (Gbps) | Weather conditions | Link range (km) |
|---|---|---|---|---|
| [9] | 4-QAM-OFDM–based FSO link using preamplifier and square root module | 10 | Clear air | 1.8 |
| [10] | Gray-coded DP-QPSK–based FSO link using homodyne detection and DSP | 128 | Clear air | 2.65 |
| [14] | DP-256 QAM-based FSO link using coherent detection and DSP | 160 | Clear air | 3.9 |
| Proposed | Gray-coded DP-16 QAM-based 4 × 4 MIMO FSO link using coherent detection and DSP | 120 | Clear air, strong turbulence | 10.125 |
| Clear air, weak turbulence | 11.55 | |||
4. Conclusions
In this paper, the performance of gray-coded DP-16 QAM-based MIMO-FSO links using coherent detection and DSP has been investigated. A coherent receiver with DSP algorithms is used to compensate for amplitude and phase imbalances, PMD, ISI, frequency offset, and phase mismatch, which enhance the transmission range and channel capacity. Further, to mitigate the effects of geometric loss, atmospheric attenuation, and atmospheric turbulence, MIMO links are utilized, which significantly improve the link range. As we have seen from the results, distorted constellation diagrams are observed before DSP, whereas after DSP, distinct constellation symbols are observed. As a result, distinct constellation symbols demonstrate error-free transmission. The system possesses a spectral efficiency of around 4.62 b/s/Hz. The longest link range to attain the BER-FEC limit was achieved under 4 × 4 MIMO weak turbulence levels in clear air conditions, which is 11.55 km, while the shortest was achieved under SISO strong turbulence levels in light fog conditions, which is 0.895 km. The observed tolerable EVM limit to achieve the BER-FEC limit is around 15% for all considered scenarios. Therefore, the combination of MIMO link and DSP is the right candidate to mitigate geometric loss, atmospheric attenuation, and atmospheric turbulence in the FSO system. In MIMO FSO links using coherent detection and DSP, as the MIMO size increases, computational complexity also increases. For the future, this work can be extended to computational complexity reduction.
5. Limitations of the Research Work
The combination of MIMO links and DSP algorithms successfully addresses the challenges of geometric loss, atmospheric attenuation, and atmospheric turbulence in FSO systems. However, this comes at the cost of increased complexity, higher hardware requirements, and potential delays. In order to guarantee optimal performance in practical applications, successful implementation of such systems requires a careful evaluation of their advantages against their limitations.
Disclosure
This paper is already published in the preprint/thesis given in the Faculty of Electrical and Computer Engineering and is archived in BiT-BDU institutional repository system [29] (https://ir.bdu.edu.et/handle/123456789/15801).
Conflicts of Interest
The authors declare no conflicts of interest.
Author Contributions
All authors contributed equally to this work.
Funding
No funding was received to assist with the preparation of this manuscript.
Acknowledgments
The authors wish to thank Bahir Dar Institute of Technology, Bahir Dar University (BiT-BDU), for giving an opportunity and providing the necessary facility to carry out this research.
Open Research
Data Availability Statement
The datasets generated and/or analyzed during the current study are available from the corresponding author on reasonable request.


