A Computational Framework to Predict the Soccer Ball Trajectory
Abstract
We consider the problem of computing the soccer ball trajectory, that is, given the initial velocity, the initial angular velocity, the wind velocity, and the soccer ball geometry, we compute the soccer ball positions at different times during the ball flight. For the solution of this problem, the classical model of projectile motion considering only the gravity force has been equipped with fluid dynamics forces including eventual wind effects. Understanding these forces is essential for improving both gameplay and equipment design. The starting point of the proposed method is a deep revision of fluid dynamics results to provide an effective computational procedure for the evaluation of the drag force and the lift force on the soccer ball. The resulting computational framework is a quite flexible tool that allows the easy management of the main conditions affecting the ball trajectory. So, it can support the training activity and the ball design. Some numerical experiments show the efficacy of this computational tool.
1. Introduction
Fluid dynamics offers a concrete scientific framework for understanding the behavior of fluids in motion and their interaction with solid objects; the corresponding results directly influence the design, optimization, and innovation processes within numerous fields, demonstrating the profound importance of fluid dynamics from an application-oriented perspective. For example, in aerospace and aeronautical engineering, fluid dynamics is pivotal to reduce drag in aircraft and to improve fuel efficiency and lower emissions. Maritime engineering also relies heavily on fluid dynamics to design ships and underwater vehicles that navigate the oceans more efficiently, reducing fuel consumption and minimizing their environmental impact [1]. In the energy sector, fluid dynamics is integral to the design and operation of wind turbines generators [2] or to design geothermal exchangers [3, 4]. Similarly, in hydroelectric power generation, it is used to optimize the flow through turbines [5]. The principles of fluid dynamics are also fundamental elements in environmental sciences [6, 7], where they are used to model groundwater flow, weather patterns, climate change, and the spread of pollutants in air and water bodies. Research on sailboats and fluid dynamics has led to fascinating insights, such as outfitting sailboats with sensors to capture wind measurements, and advanced techniques to design sail shapes [8], to mention just a few of them.
In the context of sports science, fluid dynamics enables the analysis of how air and water resistance affect the performance of athletes and the equipment they use [9]. In particular, for sports balls [10] and for soccer balls [11–13], as in our case study, the interaction of the ball with the fluid is a fundamental study that helps to show how variations in ball design influence its trajectory, speed, and stability, contributing to the development of sports equipment that enhances performance and fairness in competition.
The analysis of the motion of objects through fluids is a leitmotif in several interesting fluid dynamics applications, where two principal aerodynamic forces come into play: drag, usually denoted with D, and lift, denoted with L. So, the modeling of the fluid-structure interaction plays a key role in these applications and allows the characterization of different numerical methods [14–16] to be employed for these problems.
More specifically, drag force D or fluid resistance acts in opposition to the direction of the velocity of the object. The magnitude of the drag force D depends mainly on the speed and shape of the object, as well as the density and viscosity of the surrounding fluid. Conversely, the lift force L operates perpendicular to the direction of motion, potentially causing deviations from the object trajectory. It arises from the differential pressure created on opposing sides of the object boundary when it traverses the fluid. The object shape and also its rotation play a crucial role in determining the lift force magnitude and direction [17].
The concrete evaluation of the drag force D and of the lift force L cannot be done by explicit analytical procedures, so they are usually estimated by two alternative approaches: laboratory experiments with a wind tunnel or numerical simulations of a wind tunnel by a computational fluid dynamic tool. The results obtained for D and L have to be considered in the dynamical system for the motion of the object. This general approach has been already used in several models for the trajectory of sports balls, with particular attention devoted to the evaluation of the drag coefficient CD and the lift coefficient CL [18–21], and a special attention to the effect of wind [22]. An interesting review on different ball sports is also provided in [23]. Our contribution is in line with such studies and is characterized by a simple approach to compute the values of the drag coefficient CD and the lift coefficient CL through fluid dynamic simulations and then to dynamically use them in the numerical solution of the dynamical model for the soccer ball trajectory.
In particular, we present a complete computational framework to evaluate the trajectory of the soccer ball from the knowledge of its initial velocity, its geometrical features, and the wind velocity. This work diverges from conventional approaches that usually rely on the analyses of high-speed cameras, offering a comprehensive computational alternative for investigating fluid dynamic effects. The proposed procedure dynamically evaluates drag and lift forces on the ball, trying to move beyond the limitations of observational techniques. The capacity of this method to account for a wide range of velocities and spin rates not only broadens its theoretical appeal but also extends its applicability to practical applications in sports training and equipment design.
The article is organized as follows. In the next section, the mathematical model for the evaluation of the soccer ball trajectory is presented together with the corresponding approximation procedures at the base of the presented numerical simulations. In Section 3, the results for the drag and lift coefficients are reported and some examples of soccer ball trajectories are shown. Then, the results obtained are discussed along with the description of some aspects of the model that can be improved. Finally, in Section 4, some conclusions and future perspectives of this study are provided.
2. Methods
We start by introducing the main notations used in the paper. We consider a soccer ball moving in the air. The velocity of the soccer ball is denoted with , its angular velocity is denoted with ; the soccer ball has mass m and radius R, so its transverse area is A = πR2. The expressions of the forces exerted on the soccer ball are based on the gravity constant g, the air density ρ, and the air viscosity μ. Moreover, we also need two further fluid dynamic concepts: the boundary layer δ and the Reynolds number Re. The boundary layer is a thin region of fluid that surrounds a solid object as the fluid flows past it. This concept was firstly introduced by Prandtl, but then, additional efforts have been made from different points of view such as experimental observation and large-scale computation. A review on these different approaches can be found in [24]. In our case study, the approach followed is the one provided in [9, 19] The Reynolds number is a dimensionless parameter that characterizes the flow regime of a fluid; in [17], a discussion on turbulence for a smooth sphere is provided, with transition to turbulent regime typically around Re ≈ 2 · 105. In our case study, as Re ∈ [7.5 · 104, 7.5 · 105], the flow is predominantly turbulent in the region of interest. These parameters are reported in Table 1 for the reader convenience.
| Short description | Symbol | Reference value |
|---|---|---|
| Acceleration of gravity | g | 9.81 m/s2 |
| Mass of the soccer ball | m | 0.43 kg |
| Radius of the soccer ball | R | 0.11 m |
| Air density | ρ | 1.225kg/m3 |
| Air viscosity | μ | 1.79 · 10−5kg/ms |
| Width of the boundary layer | δ | 10−5 m |
| Reynolds number | Re | In the order of 105 |
So, the numerical solution of the Equation (4) provides an approximation of the velocity field u. From the knowledge of the initial position x(0), a further time-integration can be computed for the expected trajectory of the soccer ball.
The time-integration of (4) can be easily done by numerical methods for initial value problems [26] when the drag coefficient CD and the lift coefficient CL are provided together with the value of the wind velocity vector uw. To this aim, we used the predictor–corrector method of Dormand and Prince, which is based on explicit Runge–Kutta formulas of fourth and fifth order; see [27] for details.
The coefficients CD and CL are actually functions of u = ‖u‖ and CL also of ω = ‖ω‖, and they are computed by fluid dynamics simulations, as described in the remaining part of this section. The soccer ball is defined by the 3D model obtained from [28], where we have prescribed the parameters roughness height, Ks, and roughness constant Cs, following the ideas presented in [29]. Additionally, since the Reynolds number Re > 104, we consider the fluid flow in the turbulent regime. So, the standard k-ε model [30] is considered as turbulence model. These fluid dynamics simulations have considered different values of the velocity u = ‖u‖ for the computation of the drag coefficient CD and different values of u = ‖u‖ and ω = ‖ω‖ for the computation of the lift coefficient CL. The computation of such coefficients is based on the drag force Equation (2) and the lift force Equation (3), through a direct numerical evaluation of the drag force D and the lift force L, by using the air flow pressure computed on the surface of the ball. The numerical simulations are done with fixed direction of both u and ω since it does not affect the value of the drag coefficient CD and the lift coefficient CL. A more detailed discussion on the computation of the drag and lift coefficients is provided in the appendix.
Let un, n = 0, 1, ⋯, N, ωm, m = 0, 1, ⋯, M be the discrete values for the velocity and the angular velocity, respectively, used in the computation of CD and CL; let CD,n, CL,n,m, n = 0, 1, ⋯, N, m = 0, 1, ⋯, M be the corresponding values obtained by fluid dynamic simulations. From these grid values, a piecewise-linear interpolation is used to obtain functions CD(u), u ∈ [u0, uN], CL(u, ω), u ∈ [u0, uN], and ω ∈ [ω0, ωM], where u0 and uN and ω0 and ωM are the minimum and the maximum expected values for the velocity and the angular velocity, respectively. These functions allow a simple and fast evaluation of CD and CL in the solution procedure of Problems (4) and (5).
- •
The initial position x0;
- •
The initial velocity u0;
- •
The initial spin ω0;
- •
The vector for the constant wind uw.
3. Results and Discussion
We present the results obtained with the method proposed in the previous section, focusing on the evaluation of drag and lift coefficients and the analysis of ball trajectory under various conditions.
The implementation of the k-ε model for the fluid dynamic simulations is the one provided by Ansys Fluent [31], which is a widely used computational fluid dynamics software specialized in fluid flow and related phenomena.
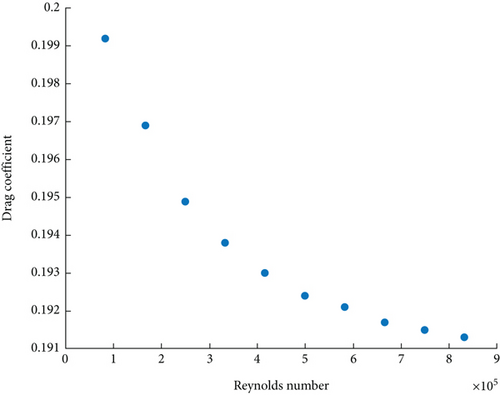
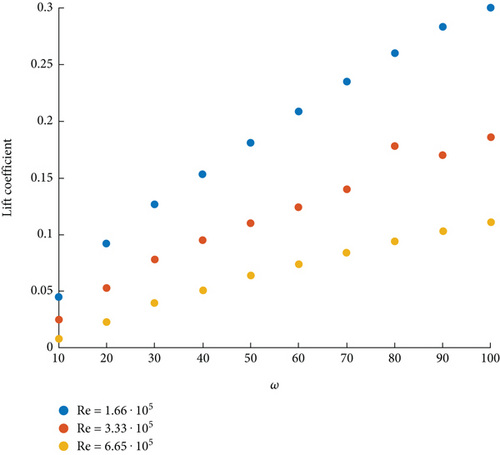
Figure 1 shows the values computed for the drag coefficient CD with varying Reynolds numbers corresponding to the values of u ∈ (5, 50) m/s. This result is similar to the one proposed in [32], where the drag coefficient is also quite stable even if slightly higher than the one obtained in our simulations. Figure 2 shows the lift coefficient CL for the fixed Reynolds number values of Re = 1.66 · 105, corresponding to u = 10m/s; Re = 3.33 · 105 corresponds to u = 20m/s, and Re = 6.65 · 105 corresponds to u = 45m/s and ω = 10°, 20°, ⋯, 100°/s. The results obtained are slightly lower but still similar to the ones reported in [18].
- •
A three-dimensional plot to show the overall progress of the trajectory of the soccer ball;
- •
A side-view plot that highlights the behavior of topspin and backspin shots as well as the effects of tailwind and headwind.
- •
A view from above plot to highlight the effects of side-spin and lateral wind.
| Case | Wind | Lift force | Drag force |
|---|---|---|---|
| 1 | No/tailwind/headwind | No | Yes |
| 2 | No | Yes/no | Yes |
| 3 | No | No | Yes/no |
| 4 | No | Yes/no | Yes |
| 5 | No/lateral wind | No | Yes |
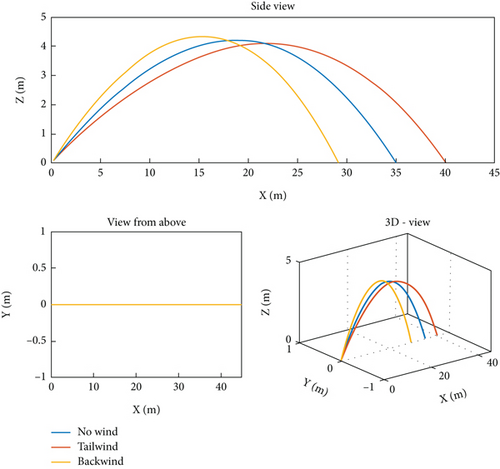
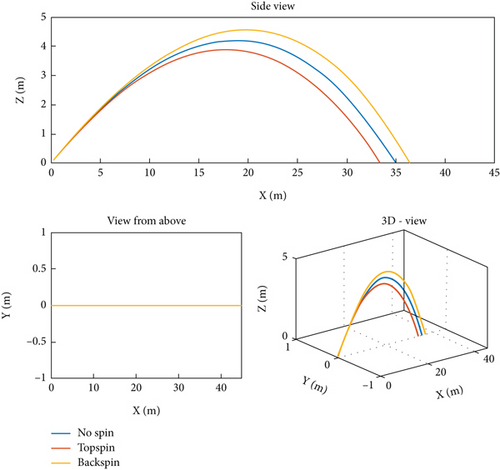
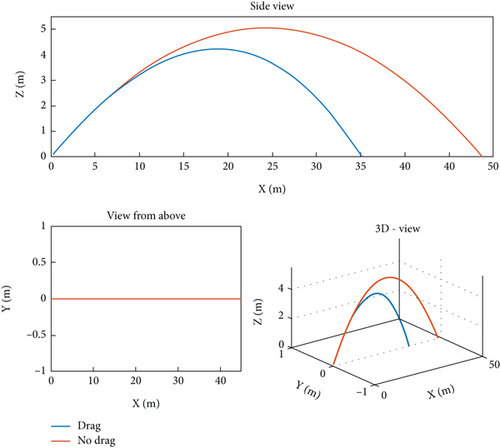
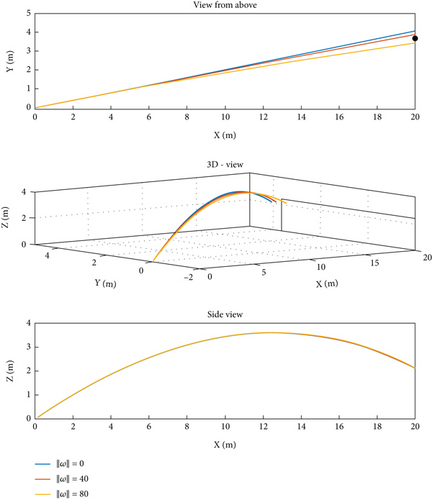
In all cases, the initial velocity vector is ‖u0‖ ≈ 19m/s, and we suppose the absence of wind.
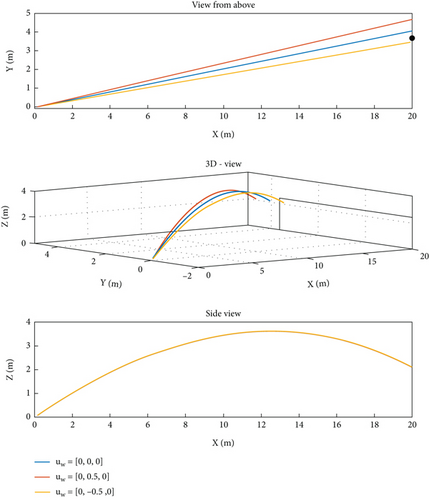
We can see that the shot with no lateral wind was wrongfully aimed outside of the top corner of the goal. The lateral wind deflects the trajectory of the ball bringing it in one case even more outside of the goal and in the other case inside the goal, making the shot dangerous.
The simulations required roughly 14 min for the evaluation of each study case for the drag coefficient CD and the lift coefficient CL, whereas the evaluation of the soccer ball trajectory required roughly 45 s. Regarding the computational time, the numerical simulations were performed on a computer equipped with operating system Windows 10, processor, Intel Core i7-7500U 2.7 GHz, with 12 GB DDR4 RAM.
The results described so far have yielded significant insights into the aerodynamics of the soccer ball, specifically focusing on the drag and lift coefficients, as well as the ball trajectory under a variety of conditions. In particular, the results for the drag and lift coefficients are in good agreement with previous research such as [18, 32]. Moreover, the results for the ball trajectory seem to realistically capture the effects of wind and fluid dynamic forces on the ball trajectory. However, our approach needs further investigations, and these promising results need other validation steps.
From a methodological standpoint, the robustness of the proposed method has to be analyzed with respect to different computational options, such as turbulence models and wall conditions, in the evaluation of the computed drag and lift coefficients. Also, different integration methods should be compared to analyze their effects on the simulated ball trajectories.
From the validation standpoint, the main limitation is the experimental range’s breadth; the conditions tested, though varied, do not encompass the full spectrum of real-world scenarios that could impact the drag and lift forces acting on the soccer ball trajectory. This gap could lead to underestimate environmental factors such as wind variability, altitude, and humidity with the consequent limitation in the model applicability. We note that the results obtained in this paper are completely based on a numerical simulation approach. This allows an accessible evaluation tool for the soccer ball trajectory so this is the strength of the proposed method; however, the final validation of such results needs the comparison with experimental measurements using high-speed video footage in wind tunnel and in soccer fields.
4. Conclusion
This paper presented a model that accurately approximates drag and lift coefficients for a soccer ball by fluid dynamics simulations to a better understanding of the soccer ball dynamics. More precisely, by incorporating these coefficients into the differential equations governing ball trajectory, we have obtained accurate predictions of its flight path that provide insights for enhancing athletic performance. This dual contribution of refining theoretical models and offering practical applications has potential implications for training, equipment design, and the broader field of sports science.
An interesting application of the proposed methodology is the possibility to provide a detailed examination of how the ball’s surface properties affect its trajectory. It is worth noting that for every major tournament, a new official soccer ball is introduced with varied surface properties to improve the fluid dynamics of the ball. However, this is not a trivial evaluation, and, in the past, there were cases where the new surface had terrible fluid dynamics performances, like the ball known as Jabulani used in the 2010 World Cup [35]. Therefore, the evaluation of the dynamic interplay between ball design and trajectory outcomes could contribute valuable insights.
The proposed method after the aforementioned validation phases can provide a valuable tool in the design of soccer balls and for athletes training. The improvement by the integration of artificial intelligence and machine learning models is another interesting approach to enhance the predicting capability of the method under a vast array of conditions not feasible for direct experimentation, such as high variable wind conditions and rain effects. These predictive models could facilitate the identification of optimal conditions for performance. Through these efforts, the research could tap into innovative methodologies, such as virtual reality for simulating environments and interactive models for athlete training.
Conflicts of Interest
The authors declare no conflicts of interest.
Author Contributions
All the authors contributed equally for this paper, and listing order is alphabetical.
Funding
No funding was received for conducting this study.
Acknowledgments
We would like to thank Ansys to make freely available its products during the thesis work of Riccardo Piombin for an easy evaluation of drag and lift coefficients through fluid dynamics simulations. We would like to thank Creaate to make freely available the 3D model [28] for the soccer ball. Pierluigi Maponi is a member of Gruppo Nazionale Calcolo Scientifico-Istituto Nazionale di Alta Matematica (GNCS-INdAM).
Appendix A: The Computation of Drag and Lift Coefficients
The fluid dynamic simulation gives an approximation , of the velocity field and the pressure, respectively; in particular, the approximated pressure is integrated over the soccer ball surface to compute the module of both the drag force D and the lift force L. Therefore, from the drag force Equation (2), it is possible to evaluate the drag coefficient CD, and from the lift force Equation (3), the lift coefficient CL is obtained.
In the following, the complete tables for the drag and lift coefficients computed as explained above. We notice that the results obtained are in a good agreement with the ones reported in [18, 32].
| u (m/s) | 5 | 10 | 15 | 20 | 25 | 30 | 35 | 40 | 45 | 50 |
|---|---|---|---|---|---|---|---|---|---|---|
| CD | 0.1992 | 0.1969 | 0.1949 | 0.1938 | 0.1930 | 0.1924 | 0.1921 | 0.1917 | 0.1915 | 0.1913 |
| ω\u | 5 | 10 | 15 | 20 | 25 | 30 | 35 | 40 | 45 | 50 |
|---|---|---|---|---|---|---|---|---|---|---|
| 10 | 0.100 | 0.045 | 0.028 | 0.025 | 0.018 | 0.012 | 0.010 | 0.008 | 0.006 | 0.004 |
| 20 | 0.148 | 0.092 | 0.070 | 0.053 | 0.042 | 0.034 | 0.028 | 0.023 | 0.020 | 0.017 |
| 30 | 0.204 | 0.127 | 0.098 | 0.078 | 0.063 | 0.053 | 0.045 | 0.040 | 0.034 | 0.030 |
| 40 | 0.258 | 0.153 | 0.120 | 0.095 | 0.081 | 0.069 | 0.060 | 0.051 | 0.047 | 0.042 |
| 50 | 0.310 | 0.181 | 0.136 | 0.110 | 0.092 | 0.088 | 0.071 | 0.064 | 0.060 | 0.053 |
| 60 | 0.340 | 0.209 | 0.153 | 0.124 | 0.106 | 0.095 | 0.084 | 0.074 | 0.068 | 0.063 |
| 70 | 0.370 | 0.235 | 0.170 | 0.140 | 0.120 | 0.105 | 0.092 | 0.084 | 0.078 | 0.073 |
| 80 | 0.395 | 0.260 | 0.190 | 0.178 | 0.132 | 0.115 | 0.102 | 0.094 | 0.087 | 0.081 |
| 90 | 0.400 | 0.283 | 0.216 | 0.170 | 0.143 | 0.126 | 0.113 | 0.103 | 0.095 | 0.089 |
| 100 | 0.410 | 0.300 | 0.234 | 0.186 | 0.153 | 0.135 | 0.122 | 0.111 | 0.102 | 0.095 |
Open Research
Data Availability Statement
Data sharing is not applicable to this article as no new data were created or analyzed in this study.


