Enhancing Pharmacy Warehouse Management With Faster R-CNN for Accurate and Reliable Pharmaceutical Product Identification and Counting
Abstract
The rise of digitalization and Industry 4.0 has led to significant changes in industrial warehouse management. However, managing warehouses remains challenging due to reliance on manual labor and limited automation. This article focuses on addressing issues in warehouse management, specifically in drug identification and counting. Although traditional methods such as barcode systems and RFID are common, artificial intelligence (AI) offers a promising solution. In this paper, an advanced visual recognition based on Faster R-CNN is introduced to accurately identify and count pharmaceutical items in pharmacies. The obtained results suggest that intelligent warehouse management in pharmacies can lead to cost savings and improved efficiency. The study also compares the proposed model with popular classification methods such as CNN, SVM, KNN, YOLOv5, and SSD, showing the effectiveness of the new approach.
1. Introduction
In the past decade, the world has witnessed a rapid shift toward digitalization and the adoption of Industry 4.0 technologies. However, certain sectors within the manufacturing industry still face significant challenges regarding automation and the integration of digital solutions. In the field of warehouse automation, challenges frequently arise during the design and implementation phases. Primary activities in warehouse management encompass product storage, risk management, financing, grading, branding, and transportation [1]. In many warehouses, these tasks are carried out manually or with limited automation [2, 3]. This manual operation leaves room for human error, which is the primary cause of data management mistakes [4]. Data accuracy within the warehouse system module is crucial for effective production planning and supply chain management.
Nowadays, companies are experiencing an increase in trade volume and the complexity of their supply chain networks is growing. Therefore, their warehouses consist of connected storage units and racks, creating a network [5]. It can show the importance of warehouse management that can play a vital role in enhancing industrial productivity and providing better customer service [6]. Accurate warehouse information ensures smoother production processes and timely delivery of commercial goods to customers [7]. On the other hand, human mistakes can lead to significant losses for companies during practical operations. As companies experience an increase in trade volume, the complexity of their supply chain networks also grows. Warehouses consist of connected storage units and racks, creating a network [7]. Managing and maintaining such a complex network is challenging, and the task of monitoring and tracking all the goods within it becomes even more laborious. There is an urgent need to effectively oversee all ongoing processes within a warehouse and create a dynamic storage facility that facilitates easy accessibility [8, 9]. As a critical and fundamental component of the supply chain, warehouse management has always been an important area of study for researchers [10–14]. However, one crucial function of warehouse management, namely, components receiving [15], still requires human involvement. This includes checking purchase orders, counting parts, and inputting the data into the enterprise system. These receiving data form the foundation for all supply chain management and industry operations. These issues, along with balancing the need to have adequate stock without overstocking, are the most challenging problems for a pharmacy. Pharmacies are one of the most important parts of the human and animal healthcare and well-being system in all countries. Efficient storage, management, and distribution of pharmaceutical products play an important role in the operations of a pharmacy. Accurate and reliable warehousing helps in preserving the quality and safety of medications. Using artificial intelligence (AI) and machine learning (ML) can solve current challenges in the industry especially for pharmacies, improving productivity and efficiency in warehouses. While AI has gained substantial traction in various engineering fields, its utilization as a valuable problem-solving tool in warehouse management still requires further exploration [16, 17]. In the field of supply chain management, AI has been gradually adopted for sales data analysis, customer demand analysis, and the distribution of warehouse production orders [18–20]. Several models have been developed to classify and identify stock levels [6, 21, 22]. Counting objects by their classification is still a difficult problem in warehouse management, and only a few studies have explored this topic. In contrast, AI has made substantial strides in object recognition, making it one of the most accurate branches of AI, with extensive research conducted in this field. Thus, utilizing AI to identify, count, and manage inventory can be an efficient and accurate tool. Presently, AI capabilities primarily revolve around prediction, planning, and learning. Importantly, these AI capabilities are intertwined with the overarching objectives of warehousing. These AI capabilities are closely linked to the main goals of warehousing. They work with human skills and require constant improvements to create business value through increased efficiency (e.g., space optimization and workforce productivity) and effectiveness (e.g., error reduction) [23].
Counting and identifying items within a warehouse or in available shelves for a pharmacy, followed by efficient warehouse management, are critical measures in pharmaceutical warehouse management. While numerous technologies (e.g., RFID [24] and QR code [25]) have been developed for item identification, they often require more continuous monitoring capabilities. Implementing AI tools for item counting in pharmacy warehouses can significantly reduce costs, enhance speed and efficiency in warehouse management, and ultimately lead to increased profitability for pharmacy owners [26, 27]. Moreover, the application of these advanced technologies brings additional benefits such as improved safety measures, decreased incidents of theft and pilferage, real-time inventory tracking capabilities, and optimization of warehouse operations [28]. Our study has extensively examined the important area of inventory control in pharmaceutical warehouses, with a particular focus on two key aspects: drug identification and counting. In the following section, we explored the methodologies that contribute to pharmacy warehouse management, which can be classified into two main categories.
1.1. Warehouse Management Without AI
A pharmacy barcode system is a technology that uses barcodes to track and manage medication inventory in a pharmacy. Each medication is assigned a unique barcode that can be scanned using a scanner. The system can track the medication from the time the pharmacy receives it until it is given to a patient. This helps to ensure that the right medication is given to the right patient, which reduces the risk of medication errors and helps to manage inventory levels. In addition, the system can generate reports on medication usage, expiration dates, and other important information to help pharmacy staff make informed decisions about inventory management. RFID technology has gained significant popularity in product segmentation, tracking, and positioning [29, 30]. The information collected by the RFID reader is transmitted wirelessly to open-source hardware, and the resulting data are stored in a central server. All modules are interconnected through a common network to ensure efficient data communication. The authors in [30] proposed an IoT-based WMS for industries that specialize in developing customized products. The system utilizes RFID tags to label all parts, which are assembled to create the final product. The RFID information collected from these parts is transmitted to an Electronic Product Code (EPC) information server, responsible for monitoring inventory levels, making modifications, handling change requests, and picking faults. It is a common practice to use vehicles for transportation within a warehouse. In the past, manual vehicles were common, but now IoT uncrewed vehicles, robots, and conveyor belts are becoming more popular. The authors in [31] created a system that uses unmanned aerial vehicles (UAVs) to manage warehouse inventory. These UAVs can count and find inventory while avoiding obstacles and collisions.
1.2. Warehouse Management System Using AI
A literature search shows no published studies that explicitly explore the application of AI in pharmacy warehousing. However, over the past decade, AI has emerged as a significant contributor to the field of supply chain management. Research efforts have primarily concentrated on utilizing AI to predict customer demands, fulfill orders, and optimize component pick-up from designated locations within the warehouse [22, 32–34]. AI technologies have also found widespread applications in security and business domains, including warehouse management [35–40]. Several recent studies have introduced models for the classification and counting of various objects, including individuals, cars, and other items [35, 41–46]. These studies offer valuable references for developing neural network models in the context of industrial component identification and counting research. There exist several well-known convolutional neural network (CNN) applications, including AlexNet [40] and GoogLeNet [42], which have been proposed as sufficient for image classification. These networks are designed to recognize objects in images and are suitable for industrial component classification and counting in warehouse management. This section introduces five standard neural network model structures, such as AlexNet, VGG [47, 48], GoogLeNet, and SSD [49], which can be tailored to meet specific design requirements by adjusting layers and fine-tuning outputs. However, there are still challenges in adding these models to industrial warehouse management systems, especially when it comes to ensuring accurate predictions. CNN architectures are known for their higher prediction accuracy compared to simpler neural networks. Studies have shown accuracy rates of over 96% on datasets such as MNIST and Human Face datasets, according to Müller, Guido, and Geron [50, 51].
In [52], three object detection methods Faster R-CNN, YOLO, and SSD are evaluated for their effectiveness in identification tasks. The study highlights that Faster R-CNN is particularly well-suited for identification compared to YOLO and SSD for several reasons: Higher mean average precision (MAP): Faster R-CNN achieves a MAP of 87.69%, significantly exceeding the performance of YOLOv3 (80.17%) and SSD (82.41%). This superior precision (P) is crucial in pharmacy environments, as accurate drug identification is vital for minimizing medication errors and enhancing patient safety. Emphasis on accuracy: While its detection speed (7 FPS) may be slower than the alternatives, Faster R-CNN prioritizes accuracy over speed. This focus ensures that pharmacists can rely on the results, thereby reducing the likelihood of misdispensing medications in critical situations.
As outlined in this section, various approaches can be suggested for managing pharmacy warehouse management systems. Nevertheless, concerning our objective in this article, which pertains to drug identification and counting, none of the methods, except for AI, can effectively accomplish this goal, because the alternative methods, such as the pharmacy barcode system and RFID technology, are time-consuming and costly, in contrast to warehouse management system using AI. Using AI tools for counting the items in the pharmacy warehouse can reduce costs and increase the speed and efficiency of managing a warehouse with the development of CNN [53–55].
In the evolving landscape of warehouse management, especially in the pharmaceutical sector, there are several unique challenges that need academic focus. Even with advances in automation and the quick use of AI technologies, many warehouses still depend on traditional manual processes. This reliance not only amplifies the risk of human error in data management but also impedes the efficiency required for contemporary supply chains. One of the primary challenges is ensuring data accuracy within warehouse management systems, which is vital for effective production planning and supply chain operations. Pharmaceutical inventory control is very detailed, requiring accurate records of drug identification and quantities, which highlights the problems caused by incorrect data. In addition, the complex structure of warehouse networks creates more challenges, making strong monitoring and tracking systems necessary, something that current manual systems do not provide. Another significant challenge is fitting AI and ML into current warehouse management practices. Although there have been major advancements in other engineering fields, the use of AI for object classification and counting in warehouse management is still not well studied. Traditional technologies, such as barcode scanning and RFID systems, often fall short in facilitating the real-time accuracy and efficiency that AI tools can offer. The gap between current methodologies and the potential of AI technologies highlights an urgent need for innovative solutions that can enhance the operational efficiency and accuracy of pharmaceutical warehouse management. The expensive and slow nature of traditional methods for drug identification and counting highlights the need for better solutions that use AI. Using AI-driven systems could greatly help with inventory management by providing timely data that are crucial for making informed decisions. In addition, while current systems use neural networks for classification and recognition, they face major challenges when being integrated into real warehouse management systems, especially in achieving high prediction accuracy. Lastly, combining AI capabilities with human work presents a complex challenge that needs more research. Ensuring that AI systems work smoothly with human efforts to boost productivity requires continuous study of their design and implementation. By tackling these various challenges, the research community can improve warehouse management practices and create a stronger, more efficient supply chain. We have successfully designed and implemented a sophisticated AI-driven warehouse management system tailored specifically for pharmacies. This system addresses the traditional challenges faced in warehouse management by utilizing advanced AI techniques to enhance operational efficiency. The research introduces a novel application of visual recognition methods, specifically employing the Faster R-CNN algorithm [38, 56, 57], to accurately identify and quantify pharmaceutical items. This approach not only streamlines the inventory management process but also significantly reduces human error associated with manual counting. The proposed system integrates AI capabilities that facilitate real-time tracking and management of pharmaceutical inventory. It optimizes drug identification and counting processes, addressing critical issues present in traditional methods such as barcode systems and RFID technology, which often lack the P and speed required for efficient warehouse operations. Practical applications for pharmacy owners: Beyond theoretical contributions, the developed system is designed with practical applications in mind, aiming to provide pharmacy owners with an application that not only meets their operational needs but also enriches their service delivery and customer satisfaction.
2. Proposed Method
One of the main challenges in warehousing for pharmacies is the lack of enough datasets for developing reliable AI-based models. Therefore, the first step is to collect a diverse range of drug samples to create a dataset of drug images. Once the dataset is collected, it should be labeled appropriately. Each image in the dataset should be annotated with the corresponding drug name or class. The second challenge is to develop an accurate AI-based model for identifying and counting the drugs in the images. In this section, we first discuss how to create a dataset of drug images, and then the structure of the proposed algorithm for identifying and counting drugs.
2.1. Collecting and Generating Dataset
Having a reliable image database is crucial in image processing systems that aim to identify and count objects. A well-organized image database can provide the necessary reference images for comparison and analysis, allowing the system to identify and count objects in new images accurately. A comprehensive image database can also improve the system’s ability to recognize and classify objects based on their features and characteristics. Therefore, the importance of a robust image database must be considered in image processing systems that require object identification and counting.
2.1.1. Classification of Pharmacy Items
In this section, we aim to explain how a comprehensive image database in the pharmaceutical field has been collected. To ensure accuracy and reliability, we thoroughly reviewed all items in the pharmacy database, considering the significant scatter in the data. In addition, we carefully selected a specific number of items from each category to ensure a balanced representation of the database’s centralized data. All pharmaceutical products can be categorized into 4 different groups. Table 1 lists the categories of items and the specifications of drugs in each category, and examples of these items are shown in Figure 1.
| Category | Description | Specifications | Sample of products |
|---|---|---|---|
| 1 | Cardboard or plastic rectangular cube | Rectangular cube cardboard packaging | Boxes of all kinds of pills and capsules |
| 2 | Packaging with plastic, metal, glass, and cardboard bottles and cans | Cardboard envelopes, glass, and metal cans | Syrup bottle, suspension, dropper, and vial |
| 3 | Flexible plastic or cardboard envelope | Flexible plastic envelope shaped like a rectangular cube | All kinds of medical adhesives (wound adhesive, angiocath, and injection), all kinds of pads and bandages, and packaging of all kinds of syringes |
| 4 | Flexible plastic envelope with the possibility of vertical arrangement | The difference between these items and the previous category is that they can be arranged vertically according to the place of installation or the volume inside the package, and they can be set in 4 directions. | Packaging of herbs, supplements, and kits |

- •
The angle is 90° horizontally and 0° vertically
- •
The angle of 45° west vertically and 90° horizontally
- •
The angle of 45° east vertically and 90° horizontally
- •
The angle is −45° horizontally and −45° vertically
- •
The angle is 45° horizontally and 45° vertically


2.1.2. Data Preparation
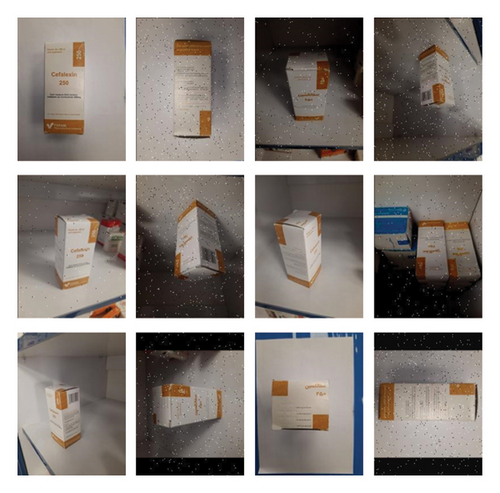
As mentioned in the previous section, all collected data are 4 × 10 × 5 × 2 = 400 images. The dataset collected from drug images is divided into training, validation, and testing sets. These sets train the algorithm, adjust its performance, and evaluate its accuracy. In the first step, we labeled all the images using the bounding box technique. In the second step, we added augmentations such as different rotations, two light intensities of 150 and 250 lux, blur, overlap drugs, and salt and pepper noise to increase the number of images in the database. After applying the mentioned augmentations, we developed and tested the models by using 6146 images. Figure 3 illustrates some implemented augmentations for a pharmaceutical production that demonstrate the diverse environment and conditions encountered in a real-world pharmacy.
2.2. Proposed AI-Based Model
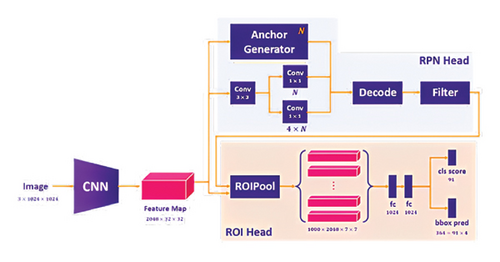
In this article, a Faster R-CNN authentication system detection algorithm is used. To understand the Faster R-CNN algorithm, we briefly explain the R-CNN and Fast R-CNN algorithms. In 2014, UC Berkeley researchers introduced R-CNN, a deep convolutional network for object recognition [58]. R-CNN utilizes a CNN for feature extraction and consists of three modules: region proposal generation, feature extraction, and support vector machine (SVM)–based classification. However, R-CNN has drawbacks such as multiple stages, storage requirements, and reliance on selective search [55]. To address these issues, Fast R-CNN was developed by Ross Girshick [58]. Fast R-CNN employs ROI pooling to extract feature vectors from regions of interest in an image, resulting in faster processing. Unlike R-CNN, Fast R-CNN shares computations across proposals and requires less disk space [37]. The Faster R-CNN [57] algorithm is an extension of the Fast R-CNN [58] algorithm. Quicker R-CNN is faster than Fast R-CNN, as its name implies, due to the region proposal network (RPN). As shown in Figure 4, Faster R-CNN is composed of three parts as follows.
2.2.1. Convolutional Layers
In these layers, filters are trained to extract the appropriate features of the image. Convolution networks are generally composed of convolution layers, pooling layers, and a last component, which is the fully connected or another extended thing that will be used for an appropriate task such as classification or detection.
2.2.2. RPN
The RPN is a fully convolutional network that creates proposals with different scales and aspect ratios. The RPN applies neural network terminology with attention to instruct the object detection (Fast R-CNN) where to look. Rather than using pyramids of pictures (i.e., multiple instances of the same image at different scales) or pyramids of filters (i.e., multiple filters of varying sizes), this method uses pyramids of pixels. Anchor boxes are reference boxes with specific dimensions and aspect ratios. When multiple reference anchor boxes are used, numerous scales and aspect ratios exist for a single region. This can be viewed as a pyramid of anchor boxes for reference. Each zone is then transferred to its respective reference anchor box, detecting objects with varying sizes and aspect ratios. Both the RPN and the Fast R-CNN share convolutional computations, which decreases the processing time.
2.2.3. Classes and Bounding Boxes’ Prediction
The final part of the Faster R-CNN is to predict object class and bounding boxes. The information is transferred from RPN to another fully connected neural network that works as a classifier and predictor of bounding box points.
2.3. Evaluation Metrics
3. Results and Discussion
The simulation used a Python 3 programming environment, PyTorch deep learning library, and a GPU system with 15 GB RAM and seven computing cores. The processing time for the target database was 5 h, 12 min, and 32 s.
3.1. Sensitivity Analysis
To have a robust, accurate and reliable model, we need to use optimum parameters for Faster R-CNN. In this subsection, first, all well-known optimization algorithms have been evaluated, and then the impact of the learning rate on F1 score and the role of batch size have been evaluated. For applying this sensitivity analysis, the size of the training, validation, and testing dataset are 70%, 20%, and 10%, respectively.
3.1.1. Optimizer Algorithm
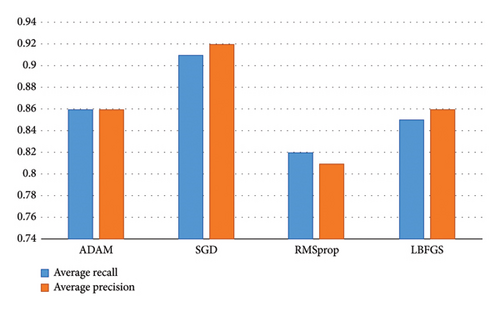
Selecting a suitable optimizer can have a crucial impact on the model’s performance. Good and compatible optimizers can prevent exploding or vanishing gradients which may lead to disruption and cause instability. In addition, a good optimizer helps the model generalize better to unseen data and reduce overfitting. A proper optimizer can also minimize computational overhead by reducing the number of epochs required to reach an acceptable performance, saving time and computational resources. Four different optimizers including stochastic gradient descent optimize (SGD), Adam, RMSprop, and LBFGS have been considered to find the best one for our case. For this analysis, default values have been considered for learning rate and batch size as 0.001, and 36, respectively. As shown in Figure 6, the SGD optimizer presents better performance. SGD optimizer [59] is widely used to minimize the loss function by iteratively adjusting the model’s parameters based on the gradients of the loss function concerning those parameters. The SGD optimizer updates the model’s parameters in small batches (or randomly selected individual samples) rather than using the entire dataset simultaneously. This stochastic nature allows it to navigate complex and high-dimensional parameter spaces effectively. By iteratively updating the parameters, the SGD optimizer helps the model converge toward an optimal set of parameter values that minimize the loss and improve the model’s performance.
3.1.2. Learning Rate
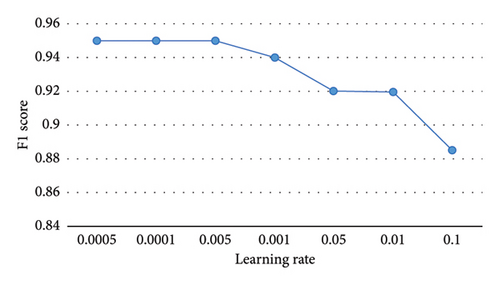
Another important parameter is the learning rate that can have a direct impact on training procedures. The correct learning rate can balance speed and P, accelerate convergence, and improve overall performance, while high and low rates can increase the risk of underfitting and overfitting, respectively. For this analysis, the optimization algorithm is SGD and batch size is 36. Figure 6 shows the variation of F1 score versus different learning rates. As shown in Figure 7, the F1 score starts to decrease after 0.005, and to avoid underfitting, we selected 0.005 for the learning rate.
3.1.3. Batch Size
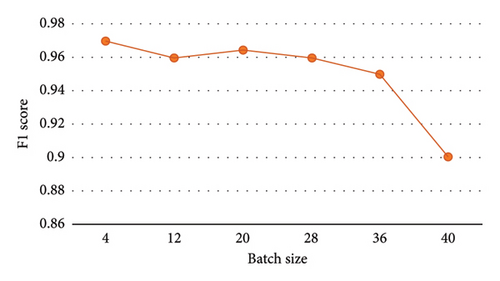
Batch size refers to the number of the selected training samples in one iteration to update the weights of the model. Small size can lead to better generalization but potential instability. On the other hand, a large size can lead to more stable and better computational efficiency but increases the risk of overfitting. For this analysis, the optimization algorithm is SGD, learning rate is 0.005, and size of training, validation, and testing data are 70%, 20%, and 10%, respectively. Figure 8 shows that less values for batch size, while optimizer and learning rate can control stability, could be better choices for our applications. Therefore, Batch size 4 has been selected for the developed model.
3.2. Simulation Results
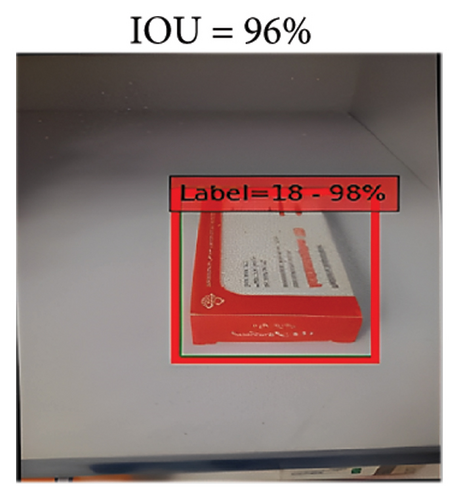
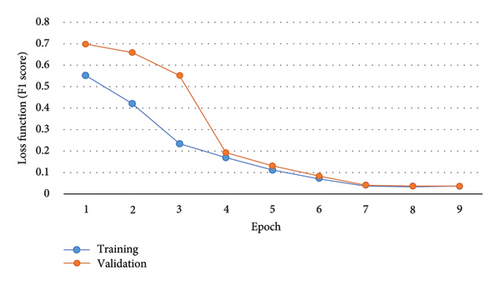
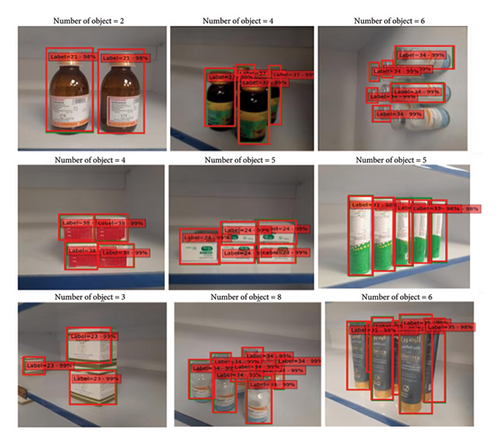
According to the sensitivity analysis, SGD has been selected for optimization and the values for learning rate and batch size are 0.005 and 4, respectively. Figure 9 shows the convergence of lost function for training and validation data that confirms that there is no underfitting or overfitting during the training procedure. Moreover, Figure 10 shows the performance of the proposed model for identifying and counting test images on pharmacy shelves. In these images, the green box is the area prepared in the dataset for the images, and the red box is the area identified by the algorithm. All these obtained results reveal that the proposed AI-based model has a very promising performance on the test data and the error for detecting and counting the items is too low.
3.2.1. Comparison
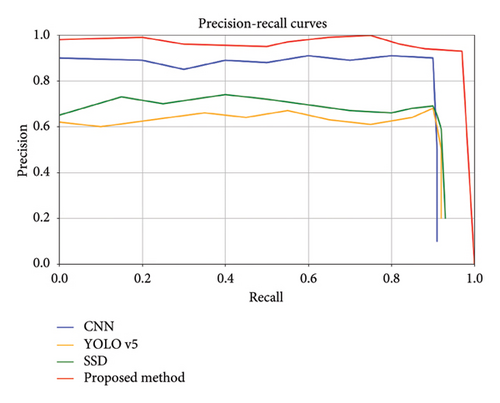
As mentioned before, there are several traditional AI and ML methods, and deep learning–based models have been applied to warehousing challenges such as product recognition, classification, and inventory management. In this section, the proposed method has been compared with different strategies using three key metrics: accuracy, F1 score, and computational cost and P–R curve.
As can be seen in Table 2, for traditional methods, three well-known features including color features, histograms of oriented gradients (HOGs) [60], and local binary patterns (LBPs) [61] are combined with classifiers such as SVMs in various configurations (quadratic, cubic, linear, and Gaussian) and k-nearest neighbors (KNNs). While these traditional methods have lower computational costs than deep learning models, their accuracy and F1 scores fall short of meeting the practical requirements of modern applications. Experimental results show that although most of them have less computational cost in comparison with deep learning models, their accuracy and F1 scores are less than the desired values. However, information fusion at the feature level can increase the accuracy up to 90% which is more than YOLO and SSD, which is so promising.
| Strategy | Feature | Classifier | Type | Accuracy (%) | F1 score | Training time (m) | Test time (s) |
|---|---|---|---|---|---|---|---|
| Traditional methods | Color | SVM | Quadratic | 79.5 | 0.77 | 57.66 | 1.245e − 3 |
| Cubic | 78.7 | 0.73 | 58.085 | 3.321e − 3 | |||
| Linear | 77.8 | 0.64 | 50.23 | 2.528e − 3 | |||
| Medium Gaussian | 71.4 | 0.59 | 56.87 | 2.982e − 3 | |||
| KNN | Weighted | 70.5 | 0.55 | 4.120 | 2.265e − 5 | ||
| Fine | 71.9 | 0.63 | 3.925 | 1.892e − 5 | |||
| HOG | SVM | Quadratic | 82.9 | 0.77 | 24.84 | 2.325e − 4 | |
| Cubic | 82.3 | 0.81 | 24.81 | 2.294e − 4 | |||
| Linear | 71.9 | 0.69 | 21.94 | 2.843e − 4 | |||
| Medium Gaussian | 77.1 | 0.67 | 23.77 | 3.585e − 4 | |||
| KNN | Weighted | 73.4 | 0.55 | 1.36 | 1.025e − 5 | ||
| Fine | 81.3 | 0.81 | 1.84 | 1.125e − 5 | |||
| LBP | SVM | Quadratic | 84.7 | 0.84 | 68.54 | 5.658e − 3 | |
| Cubic | 84.0 | 0.83 | 69.04 | 6.548e − 3 | |||
| Linear | 79.2 | 0.74 | 62.08 | 5.259e − 3 | |||
| Medium Gaussian | 78.9 | 0.77 | 71.03 | 8.296e − 3 | |||
| KNN | Weighted | 73.8 | 0.70 | 4.36 | 2.658e − 5 | ||
| Fine | 80.8 | 0.80 | 4.84 | 2.952e − 5 | |||
| Combined (color, 2 HOG, and LBP) | KNN | Fine | 90.24 | 0.89 | 12.56 | 8.386e − 3 | |
| Deep learning–based models | CNN | 93.25 | 0.91 | 41.25 | 4.595e − 3 | ||
| YOLOv5 | 84.2 | 0.54 | 60 | 2.681e − 3 | |||
| SSD | 87.2 | 0.59 | 73 | 3.45e − 3 | |||
| Proposed method | 98.84 | 0.98 | 187.52 | 4.256e − 2 | |||
- Note: Bold values show the metrics obtained for the proposed methods.
- 1.
P–R curve: As shown in Figure 11, the proposed model can provide high P at all R levels, which reveals that it is more adapted to pharmaceutical products. It also has good R, suggesting that it can detect a significant number of objects.
- 2.
Accuracy and F1 score: As illustrated in Table 2, Faster R-CNN achieves better accuracy and F1 score. This level of P is critical in pharmaceutical warehousing, where even small classification errors can lead to operational inefficiencies or safety risks.
- 3.
Robust feature: Unlike YOLO and SSD, Faster R-CNN incorporates a RPN that generates high-quality region proposals. This ensures more accurate object localization and classification, which is especially valuable for identifying pharmaceutical products with diverse shapes, sizes, and orientations.
- 4.
Efficient inference time: While Faster R-CNN has a higher computational cost during training, its testing time is under one second, which is comparable to YOLO and SSD. Since the training process is conducted offline, it does not impact real-time operations, making the method practical for deployment.
3.3. Implementation Results
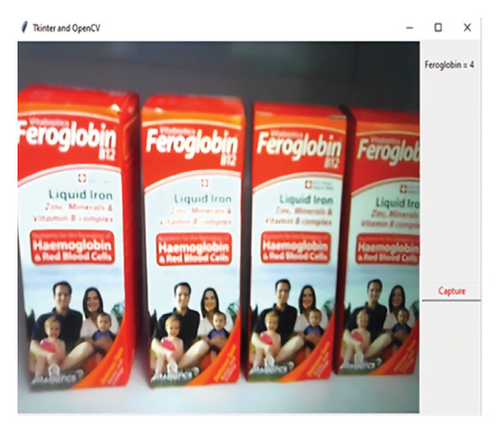
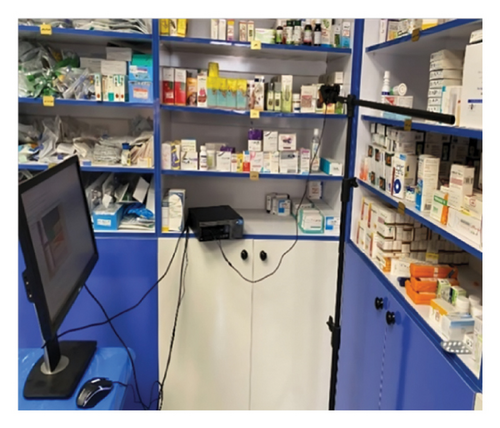
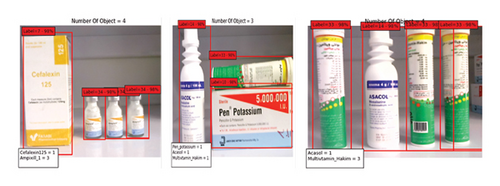
To check the proposed algorithm’s performance in the pharmacy warehouse’s real environment, we designed software in a Python environment. To run the software, having the developed model file and the software file in a separate folder is enough. This software is designed so that the user can take a picture of the desired drugs on the shelf by pressing the button and view and record the name of the drug and its quantity in real time. Image acquisition was performed using an x11 webcam with a resolution of 3–5 megapixels, and the software was run on a computer with Intel® Core™ i5-4570 CPU @ 3.200 GHz with 8 GB of RAM. In this section, the results of the implementation of the proposed plan are presented. Figures 12 and 13 show the performance of the proposed developed model in a real pharmacy. The performance of the proposed system in a real environment can be seen in the Supporting video (available here).
4. Conclusion
Pharmacy warehousing is an undeniable operation in small and large pharmacies that imposes enormous costs on the shoulders of pharmacy owners every year. If warehouse management is implemented well, it can save significant resources for distribution/manufacturing companies by improving the complete working process and providing helpful business analysis. Today, AI has been proposed to reduce warehouse management costs, which can replace traditional warehouse management methods. This article introduces a method for identifying and counting the products available on pharmacy shelves using a deep neural network. For this purpose, a dataset including 6164 images with a bounding box has been prepared by using direct imaging and augmentation methods. Then, identifying and counting the items in the image were performed by using the pretrained Faster R-CNN network with ResNet50 backbone and choosing a region limit as the counting reference. The simulation results showed that the identification operation for the items in the images is performed with 98.84% accuracy and counting with 98% accuracy. The results of the project implementation showed that the proposed method effectively has the capability of intelligent warehouse management of a pharmacy by fixed and moving cameras.
Conflicts of Interest
The authors declare no conflicts of interest.
Funding
The authors declare that this research received no specific funding. However, the publication cost will be covered by London South Bank University (LSBU).
Supporting Information
The supporting file is a video that shows the performance of the developed model in real pharmacy. It shows that by using the proposed method, the number of items and the name of them can be detected by more than 95% accuracy.
Open Research
Data Availability Statement
The authors declare that the data supporting the findings of this study are available upon reasonable request.


