Deep Convolutional Neural Networks for Plant Disease Detection: A Mobile Application Approach (Agri Bot)
Abstract
Plant diseases imperil global food security, decimating crop yields and endangering farmers’ livelihoods. Rapid, accurate detection remains a challenge, particularly in resource-constrained environments lacking portable tools. Our contribution, Agri Bot, introduces a pioneering deep convolutional neural network (CNN) model, uniquely optimized for mobile deployment, transforming plant disease diagnosis. This novel model integrates a lightweight architecture with advanced feature extraction, achieving an exceptional 97.30% accuracy and 98.76% area under the curve (AUC). Unlike computationally intensive traditional CNNs, Agri Bot’s innovative design—featuring a hybrid convolutional autoencoder, max pooling, and dropout layers—ensures high-speed, real-time performance on mobile devices. Comparative studies reveal Agri Bot’s superiority, surpassing state-of-the-art models like VGG16 (71.48%) and ResNet50 (96.46%), while rivaling InceptionV3 (99.07%) with significantly lower computational demands. By delivering precise, accessible diagnostics to remote regions, Agri Bot revolutionizes agricultural disease management, enhancing crop resilience and global food security.
1. Introduction
Food security is a critical challenge facing the world’s growing population. Plant diseases significantly reduce crop yields, causing economic hardship and food shortages. Traditional methods of plant disease detection often rely on visual inspection by experts, which can be time-consuming, subjective, and prone to errors [1].
Diseases, pests, and other undesirable substances in crops can cause a significant decrease in agricultural yield [2]. The influence of these harmful elements on crops has a direct correlation with crop quality and quantity of loss. The phrase “pesticides” was created to resist, regulate, and minimize the impacts of biological organisms and diseases [3, 4]. Plant pests and illnesses are typically diagnosed through visual evaluation of the leaves’ appearance, morphology, and other features. This visual examination should only be performed and analyzed by an experienced biologist, as misdiagnosis might result in irreversible loss of yield [5].
Traditional methods of plant disease detection rely on visual inspection by farmers or trained personnel. This approach has many limitations. (i) Diagnosis can be influenced by experience and skill level. (ii) Time-consuming: Thorough inspection of large fields can be slow. (iii) Inaccurate: Early signs of disease can be easily missed. These limitations can lead to delayed treatment and increased crop damage and economic losses.
Recently, AI has found a vast number of applications in everyday life, leading to the emergence of the phrases “machine learning” (ML) and “deep learning” (DL), which, in terms of simplicity, allow machines to “learn” a vast number of patterns and then act on them. ML and DL enable software applications to enhance prediction accuracy without being specifically intended to do so [6, 7].
Deep convolutional neural networks (CNNs) have revolutionized image recognition tasks. Their ability to automatically learn features from image data makes them ideal for plant disease detection. Several studies have demonstrated the effectiveness of CNNs in classifying healthy and diseased plants [8–10]. However, deploying such models on mobile devices presents challenges due to their computational complexity.
Deep CNNs offer powerful solutions to these problems. CNNs are a type of AI that excels at image recognition. They can be trained on vast datasets of images containing healthy and diseased plants. This training enables them to recognize the subtle patterns and characteristics that differentiate healthy tissues from diseased tissues. AI and CNN technology offer a significant advancement in plant disease detection, contributing to improved food security and agricultural productivity.
The advantages of integrating CNNs for plant disease detection with mobile applications are as follows. (i) Accessibility: Anyone with a smartphone can leverage the power of CNNs for on-the-spot disease identification in their fields. (ii) Early detection: Early intervention is key to controlling outbreaks. Mobile CNNs enable farmers to detect diseases at their initial stages, allowing for prompt treatment and minimizing crop loss. (iii) Improved decision making: The app’s disease classification can guide farmers in selecting appropriate treatment strategies, optimizing resource allocation, and potentially increasing yields. (iv) Offline functionality (potential): Mobile apps can be designed to function even without an Internet connection, empowering farmers in remote areas with limited connectivity.
As technology evolves, mobile plant disease detection with CNNs achieves the following contributions. (i) Enhanced accuracy: With continuous training on expanding datasets, CNNs will become even more adept at identifying a wider range of diseases. (ii) Integration with precision agriculture tools: Mobile apps could connect with sensors to monitor plant health comprehensively, providing farmers with real-time insights. (iii) Wider adoption: As the technology becomes more user-friendly and affordable, mobile plant disease detection will reach a broader range of farmers globally. Briefly, mobile CNNs offer a game-changing approach to plant disease detection. By empowering farmers with accessible and accurate diagnostic tools, this technology has the potential to significantly improve agricultural practices and ensure a more sustainable future for our food systems.
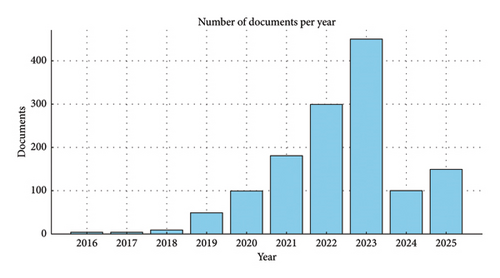
A Scopus analysis on plant disease detection indicates a promising future for the integration of AI. The analysis reveals a growing trend in research publications and citations focusing on AI and CNN technologies for enhancing the accuracy and efficiency of plant disease detection systems. The results suggest that AI and CNN will play a crucial role in driving innovation and advancements in agriculture, offering significant potential to address challenges in crop health management and boost agricultural productivity, as shown in Figure 1.
1.1. Contributions and Motivations
- •
A novel DL model is implemented called Agri Bot to detect plant disease through RGB images.
- •
New block of CNN layers is designed to extract spatial features.
- •
A sequence of max pooling layers is applied after each convolutional layer to reduce the data’s dimensionality and help control overfitting.
- •
A dropout layer is also used to overcome the overfitting, followed by fully connected layers to weigh the extracted features of different types of plant diseases.
Many experiments have been done to evaluate the efficiency of the proposed CNN model using different performance metrics. Experimental comparative studies are also implemented to test the efficiency of the proposed model with state-of-the-art algorithms across the dataset. The experimental results showed that the accuracy of the system is 97.30%, which is higher than other state-of-the-art algorithms.
Finally, the paper is organized as follows. Section 2 depicts the literature on the detection of plant diseases. Section 3 describes the proposed CNN model and the integration with mobile applications. Section 4 displays the model’s results and performance, along with a discussion. Section 5 concludes the work and describes the study’s future directions for system development and enhancement.
2. Related Work
Early and accurate detection of plant diseases is crucial for minimizing crop loss and ensuring food security. Traditional methods and advancements in technology have led to various approaches for plant disease detection, each with its own advantages and limitations. Table 1 presents a comparison of some key methods: (i) traditional visual inspection, (ii) hyperspectral imaging and spectroscopy, (iii) biochemical assays, (iv) ML, (vi) DL (image-based detection), (vii) SE_SPnet, and (vii) Res4net-convolutional block attention module (CBAM).
| Method | Pros | Cons |
|---|---|---|
| Visual inspection | Inexpensive, easy to implement | Time-consuming, requires expertise, misses early signs |
| Microscopic analysis | More accurate than visual inspection | Requires equipment and training, time-consuming |
| Biochemical assays | Accurate | Requires lab facilities, time-consuming |
| Hyperspectral imaging | Powerful for early detection | Expensive equipment |
| Machine learning | Less expensive than hyperspectral imaging | Requires large, labeled dataset |
| Deep learning | Extremely high accuracy | Requires even more data and computational power than ML |
| SE_SPnet | Incorporates SE for channel-wise attention, SP for spatial attention | High computational cost, possible overfitting on small datasets |
| Res4net-CBAM | Enhances ResNet with CBAM for better feature selection | Increased model complexity, higher training time |
SE_SPnet is likely a model that incorporates squeeze-and-excitation (SE) networks, which improve the representational power of a network by modeling the interdependencies between channels. SE_SPnet might be designed for a specific application, possibly integrating spatial attention mechanisms (SP) [11–13].
Res4net-CBAM model appears to be a variant of the ResNet architecture, enhanced with a CBAM to improve feature learning by focusing on important regions and channels in the data input [14–21].
The most suitable method for plant disease detection depends on several factors, including the following. (i) Cost and resource availability: Traditional visual inspection is the most cost-effective but may not be sufficient for all scenarios. (ii) Disease type and stage: Some methods are better suited for specific diseases or for detecting early signs of infection. (iii) Application requirements: Real-time field detection necessitates portable and user-friendly methods. Thus, the integration of various techniques holds promise for the future. Combining image-based detection with sensor data on environmental factors can provide a comprehensive view of plant health. Advancements in DL and mobile computing will lead to even more user-friendly and accurate plant disease detection applications.
Thus, using the right methods to distinguish between healthy and sick leaves contributes to productivity gains and crop loss control. This section includes the many previous related methods now in use for diagnosing plant diseases based on DL and CNNs.
Khamparia et al. [22] developed a deep convolutional encoder network system for identifying diseases in seasonal crops using nine hundred leaf images of potato, tomato, and maize, categorized into six classes. Their model achieved 100% training accuracy but had a testing accuracy of 86.78%, indicating a potential issue of overfitting. They used around 3.3 million training parameters. In contrast, the proposed work in the discussion used an autoencoder and CNN, while the novel hybrid model utilized CAE and CNN, achieving higher testing accuracy than Khamparia et al. Pardede et al. [23] created a system for automatic disease detection in corn and potato plants using CAE and SVM classifiers, achieving 87.01% and 80.42% accuracy in detecting diseases in potato and corn plants, respectively.
Oyewola et al. [24] used deep residual networks (DRNNs) and plain convolutional neural networks (PCNNs) to identify five distinct cassava plant illnesses. They discovered that DRNN performed 9.25% better than PCNN. Ramacharan et al. employed a transfer learning method [25] to identify three illnesses and two types of insect damage in cassava plants. The authors subsequently continued their research and used a CNN model based on a smartphone to identify cassava plant illnesses, achieving an accuracy of 80.6% [26].
In [27], a 93.82% accuracy rate was attained in the identification of plant leaf diseases using a deep CNN architecture based on NASNet. The INC-VGGN approach was used by Chen et al. [28] to identify illnesses of the rice and maize leaves. In their method, they added two inception layers and one global average pooling layer in place of VGG19’s final convolutional layer. Li et al. [29] employed a shallow CNN (SCNN) to identify illnesses of maize, apples, and grapes.
DL architecture was created by Sladojevic et al. [30] to recognize 13 distinct plant diseases. They trained CNN using the Caffe DL framework. A thorough investigation into several DL techniques and their limitations in the agricultural domain was conducted by Kamilaris and Prenafeta-Boldú [31]. To diagnose plant diseases, the authors of [32] suggested using a CNN model with nine layers. They increased the scale of the data for testing by using the Plant Village dataset and data augmentation approaches, and they examined the performance.
Finally, one major limitation observed in the research endeavors was the utilization of a substantial number of training parameters. This necessitated either extensive training time or access to high computational capabilities. This served as a catalyst for our pursuit to diminish the training parameters for plant disease detection without compromising classification accuracy. Consequently, a distinctive hybrid model for plant disease identification is introduced in this research. Initially, the dimensionality of input leaf images decreased through convolutional autoencoder before classification via CNN. A key revelation of this study is the significant reduction in training parameters achieved through the dimensionality reduction of plant leaf images before classification.
3. Proposed System
This paper proposes a lightweight deep CNN model optimized for mobile application deployment. Model architecture balances accuracy with efficiency by incorporating the following two approaches for plant disease detection: (i) the proposed CNN model and (ii) a mobile transfer learning approach. Next subsections show the breakdown of the algorithm focusing on our proposed Agri Bot CNN model definition.
3.1. Dataset Availability Statement
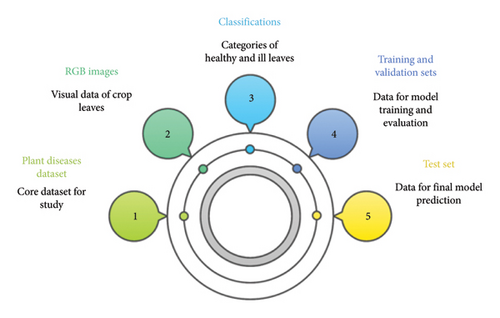
New Plant Diseases Dataset [33] has been used in this study. The used dataset was generated via offline augmentation of the source dataset. This dataset contains approximately 87K RGB images of healthy and ill crop leaves that are divided into 38 different classifications. The complete dataset is divided into an 80/20 training and validation set while keeping the directory structure. A second directory with 33 test photos is established subsequently for prediction purposes. Figure 2 illustrates the structure of the Plant Diseases Dataset, highlighting its key components: RGB images, classifications, training/validation sets, and the test set used for model development and evaluation.
3.2. Data Preparation
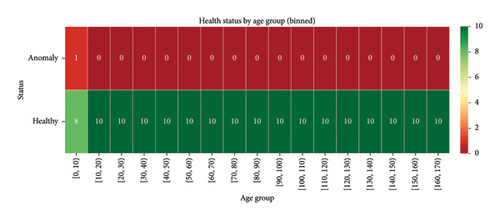
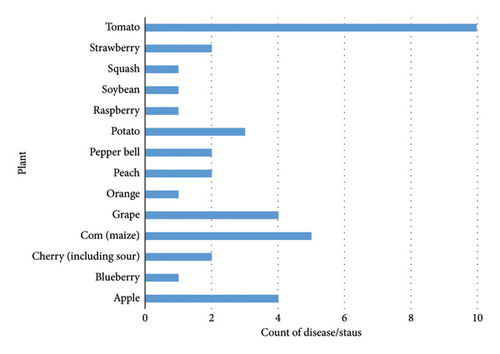
The proposed method imports necessary libraries for image processing, model building, and evaluation. It sets paths to training, validation, and test datasets. Then, Image Data Generator objects are used to preprocess the images: (i) rescaling pixel values to a range of 0–1/255 and (ii) randomly transforming images (augmenting) for better generalization (only applied to training data). Finally, we analyze the data by (i) determining the number of classes (plant diseases), (ii) visualizing a heatmap for the different classes within the dataset, as shown in Figure 3, and (iii) analyzing the distribution of images across different disease categories, as shown in Figure 4.
3.3. Implementing Proposed Agri Bot-CNN Model
Max pooling layers (MaxPooling2D) are inserted after each convolutional layer to: (i) reduce the image size (dimensionality reduction) and (ii) control overfitting by reducing the number of parameters in the model. Batch normalization layer (batch normalization) is added after a set of convolutional layers to improve the training stability and speed of the network.
- •
Dropping units: During training, dropout randomly sets a certain proportion (controlled by the dropout rate) of the activations in the input layer to zero. This can be represented using a Bernoulli distribution with probability (p) of keeping a unit and (1 − p) of dropping it. These Bernoulli variables are typically denoted by ri
- •
Scaling outputs: To maintain the expected activation values during training with dropout, the remaining activations (those not dropped) are scaled by a factor of 1/(1 − p). This ensures the average activation across multiple training steps remains the same despite dropping units. A straightforward way to illustrate how dropout affects the output yi of unit I qs in equation (2)
() -
where
- •
yi represents the output of unit i after dropout.
- •
xi represents the original activation value of unit i before dropout.
- •
ri is a Bernoulli random variable (1 for keeping the unit, 0 for dropping it).
- •
p is the dropout rate (probability of dropping a unit).
Important note: This equation only applies during training when dropout is active. During testing or inference, dropouts are not applied (all units are kept), and the scaling factor is not used.
- •
The first layer has 1024 neurons with ReLU activation for nonlinearity.
- •
The final layer has 38 neurons (assuming this is the number of disease classes) and uses a SoftMax activation function (SoftMax) to output probabilities for each class. The SoftMax function ensures the output values sum to 1, representing the probability distribution of the image belonging to a particular disease category. As shown in equation (3)
() -
where
- •
σ(z)i represents the ith element of the output vector after applying SoftMax (probability for class-i).
- •
zi represents the ith element of the input vector (z can be any real number).
- •
e represents the mathematical constant Euler’s number (approximately 2.71828).
- •
Σ represents the summation symbol.
- •
j iterates from 1 to K (K is the total number of elements in the input vector).
3.4. Model Compilation and Training
- •
L(yi, yi) is the categorical cross-entropy loss.
- •
yi is the true probability of class i.
- •
yi is the predicted probability of class i.
The goal is to minimize this loss function during the training process to improve the model’s predictive performance.
3.5. Model Evaluation
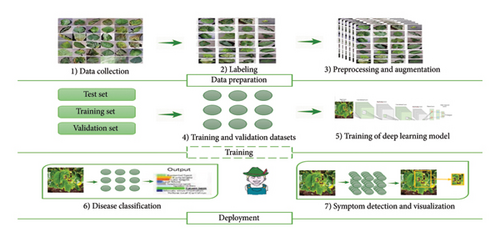
Figure 5 shows the architecture of the proposed CNN model in terms of data preparation and processing and in terms of model training and deployment.
3.6. Integration With Mobile Application
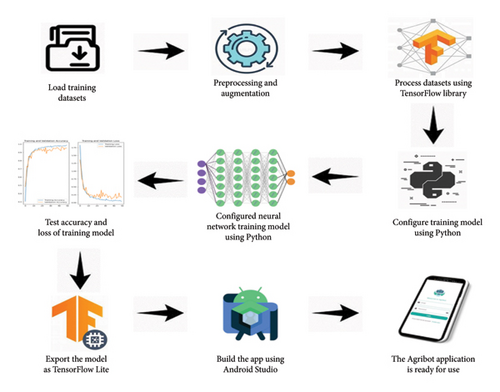
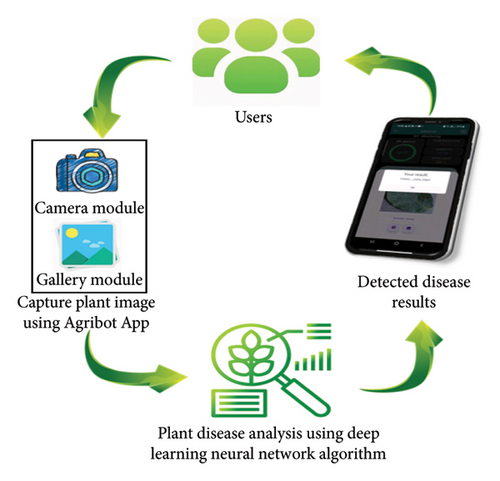
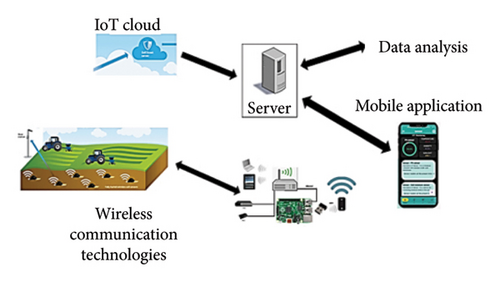
TensorFlow Lite (TF Lite) Flutter plugin affords a flexible and fast solution for retrieving TF Lite interpreter and performing inference. The API is like the TF Lite Java and Swift APIs. It directly binds to TF Lite C API making it competent (low latency). It provides accelerated support by leveraging NNAPI and GPU delegates on android, metal and core ML delegates on iOS, and XNNPACK delegates on desktop platforms. Developing an AI model for plant disease detection is crucial for early and accurate diagnosis, guiding farmers in effectively managing crop health. Mobile applications provide secure login and signup functionality for users via supporting mobile application. Utilizing authentication and authorization processes, users can access the app and create accounts to manage agricultural data and control devices. Integrated air humidity and temperature sensors enable farmers to monitor environmental conditions in real time. These data are crucial for making informed decisions regarding crop health and growth. The rain sensor in the mobile app provides alerts and notifications to farmers when rainfall is detected. This information helps in optimizing irrigation schedules and water management. Utilizing soil sensors, farmers can monitor soil moisture levels and nutrient content. These data assist in determining optimal watering and fertilization strategies for different crop types. Figure 6 demonstrates all stages of the proposed CNN model with the mobile application, and Figure 7 shows the proposed system workflow.
-
Algorithm 1: End-to-end pipeline for plant disease detection using Agri Bot–CNN model.
-
Input: The model takes a color image of size (224, 224, 3) as input (224 × 224 pixels with 3 channels for red, green, and blue).
-
Step 1: Data Preparation
-
• Import necessary libraries for image processing, model building, and evaluation.
-
• Set paths to the training, validation, and test datasets.
-
• Create ImageDataGenerator objects for data augmentation (flipping, rotation, etc.) on the training data only (to improve generalization).
-
∘ Rescale pixel values to a range of 0–1/255.
-
• Use the ImageDataGenerator to create data iterators (training, validation) that feed images and their corresponding labels to the model during training.
-
• Explore the data by:
-
∘ Finding the number of classes (plant diseases).
-
∘ Visualizing sample images from different classes.
-
∘ Analyzing the distribution of images across different disease categories.
-
Step 2: Proposed Agri Bot-CNN Model Definition
-
• Define a function define_Agri Bot_model that builds the CNN architecture:
-
Step 2.1. Feature Extraction-Convolutional Layers:
-
■ Use a sequential model (keras.Sequential).
-
■ Stack convolutional layers (Conv2D) with filters of size (3, 3) for feature extraction.
-
■ Increase the number of filters progressively (e.g., 32, 64, 128, 256, and 512) to capture complex features.
-
■ Apply ReLU activation (relu) after each convolution for nonlinearity.
-
Step 2.2. Dimensionality Reduction-Pooling Layers:
-
■ Insert max pooling layers (MaxPooling2D) after each convolutional layer for dimensionality reduction and overfitting control.
-
Step 2.3. Batch Normalization:
-
■ Include a BatchNormalization layer after a set of convolutional layers to improve training stability and speed.
-
Step 2.4. Classification-Flatten Layer:
-
■ Flatten the data from a multidimensional tensor into a one-dimensional vector.
-
∘ Dropout Layer:
-
■ Add a Dropout layer with a rate (0.5) to prevent overfitting.
-
∘ Fully Connected Layers:
-
■ Use two fully connected layers (Dense) for classification.
-
■ First layer: 1024 neurons with ReLU activation.
-
■ Final layer: Number of disease classes (38) neurons with SoftMax activation for probability output.
-
Step 3: Model Compilation
-
• Define an optimizer (Adam with a learning rate = 0.001) and a loss function (categorical cross-entropy) suitable for multiclass classification.
-
• Compile the model with the chosen optimizer, loss function, and metrics (accuracy).
-
Step 4: Model Training
-
• Train the model on the training data iterator for a specified number of epochs.
-
• Use the validation data iterator to monitor training progress and prevent overfitting by early stopping.
-
Step 5: Model Evaluation
-
• Evaluate the trained model on the unseen test data iterator.
-
• Calculate metrics: accuracy, precision, recall, and F1-score to assess the model’s performance in classifying different plant diseases.
-
Output: The model outputs a vector of probabilities, where each element represents the probability of the image belonging to a specific disease class. The class with the highest probability is predicted as the disease present in the image.
Algorithm 1 provides a structured approach for training the proposed CNN model for plant disease detection. Remember to adjust hyperparameters (e.g., number of layers, filters, and epochs) and explore different techniques based on your specific dataset and requirements.
4. Results and Analysis
In this section, we present the results obtained by training the Agri Bot CNN model for plant disease detection. We will analyze the model’s performance on the test dataset and discuss the effectiveness of the chosen approach.
4.1. Validation and Test Performance
The training and testing phases of the CNN model for plant disease detection demonstrate its effectiveness in learning intricate features and achieving high accuracy rates. The model shows consistent performance in identifying plant diseases with minimally false positives, highlighting its reliability and efficiency for agricultural applications as results prove in Table 2 and Figures 8 and 9. These results underscore the potential impact of the CNN model on improving disease detection in plants and pave the way for future advancements in utilizing DL for agricultural purposes.
| Performance metric | Value (%) |
|---|---|
| Accuracy | 97.30 |
| Loss | 7.54 |
| Precision | 98.00 |
| Recall | 97.30 |
| F1-score | 97.64 |
| ROC-AUC | 98.76 |

Moreover, Table 3 presents the classification report of our proposed model, Agri Bot, which reveals its impressive performance in accurately identifying and classifying plant diseases. With high precision, recall, and F1-score values across multiple disease classes, Agri Bot highlights its robustness and reliability in disease detection. The model’s ability to effectively differentiate between diverse types of plant diseases demonstrates its advanced capabilities in agricultural applications. Overall, the classification report of Agri Bot highlights its exceptional performance and underscores its potential to revolutionize plant disease detection in the agricultural sector.
| Class index | Plant/state | Precision–recall-F1-score–support |
|---|---|---|
| 1 | Apple___Apple_scab | 0.98–0.98-0.98–504 |
| 2 | Apple___Black_rot | 0.96–1.00-0.98–497 |
| 3 | Apple___Cedar_apple_rust | 0.95–1.00-0.98–440 |
| 4 | Apple___healthy | 0.98–0.94-0.96–502 |
| 5 | Blueberry___healthy | 0.95–0.99-0.97–454 |
| 6 | Cherry_(including_sour)___Powdery_mildew | 0.99–1.00-0.99–421 |
| 7 | Cherry_(including_sour)___healthy | 0.99–0.99-0.99–456 |
| 8 | Corn_(maize)___Cercospora_leaf_spot Gray_leaf_spot | 0.97–0.88-0.92–410 |
| 9 | Corn_(maize)___Common_rust_ | 1.00–0.99-0.99–477 |
| 10 | Corn_(maize)___Northern_Leaf_Blight | 0.91–0.99-0.95–477 |
| 11 | Corn_(maize)___healthy | 1.00–1.00-1.00–465 |
| 12 | Grape___Black_rot | 0.94–1.00-0.97–472 |
| 13 | Grape___Esca_(Black_Measles) | 1.00–0.97-0.98–480 |
| 14 | Grape___Leaf_blight_(Isariopsis_Leaf_Spot) | 1.00–0.97-0.98–430 |
| 15 | Grape___healthy | 0.99–1.00-0.99–423 |
| 16 | Orange___Haunglongbing_(Citrus_greening) | 0.98–1.00-0.99–503 |
| 17 | Peach___Bacterial_spot | 0.98–0.99-0.98–459 |
| 18 | Peach___healthy | 0.96–1.00-0.98–432 |
| 19 | Pepper, _bell___Bacterial_spot | 0.98–0.98-0.98–478 |
| 20 | Pepper, _bell___healthy | 0.99–0.95-0.97–497 |
| 21 | Potato___Early_blight | 0.99–0.97-0.98–485 |
| 22 | Potato___Late_blight | 0.96–0.98-0.97–485 |
| 23 | Potato___healthy | 0.96–0.99-0.97–456 |
| 24 | Raspberry___healthy | 1.00–0.96-0.98–445 |
| 25 | Soybean___healthy | 0.99–0.99-0.99–505 |
| 26 | Squash___Powdery_mildew | 1.00–0.99-0.99–434 |
| 27 | Strawberry___Leaf_scorch | 1.00–0.97-0.99–444 |
| 28 | Strawberry___healthy | 0.99–1.00-0.99–456 |
| 29 | Tomato___Bacterial_spot | 0.97–0.97-0.97–425 |
| 30 | Tomato___Early_blight | 0.92–0.96-0.94–480 |
| 31 | Tomato___Late_blight | 0.96–0.94-0.95–463 |
| 32 | Tomato___Leaf_Mold | 0.99–0.97-0.98–470 |
| 33 | Tomato___Septoria_leaf_spot | 0.98–0.94-0.96–436 |
| 34 | Tomato___Spider_mites Two-spotted_spider_mite | 0.98–0.97-0.98–435 |
| 35 | Tomato___Target_Spot | 0.96–0.94-0.95–457 |
| 36 | Tomato___Tomato_Yellow_Leaf_Curl_Virus | 0.99–0.99-0.99–490 |
| 37 | Tomato___Tomato_mosaic_virus | 0.99–0.99-0.99–448 |
| 38 | Tomato___healthy | 0.99–0.98-0.99–481 |
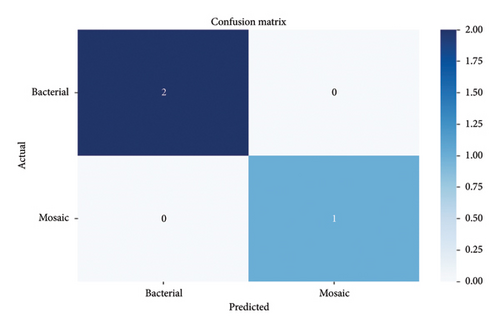
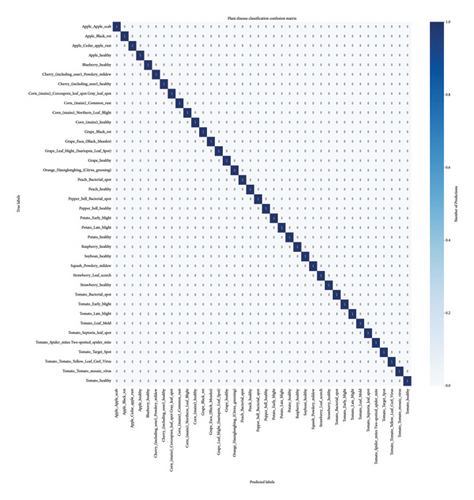
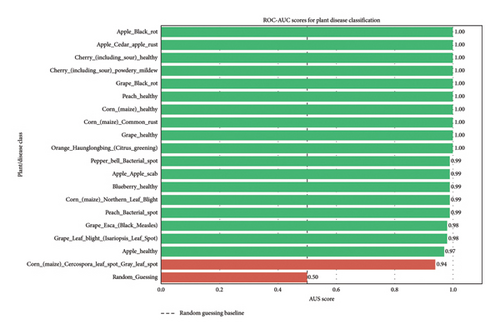
Further, the confusion matrix and ROC-AUC analysis of our proposed model, Agri Bot, provide valuable insights into its performance in plant disease detection. The confusion matrix illustrates the model’s ability to correctly classify instances of different disease classes and identify any misclassifications. By visualizing the true positive, true negative, false positive, and false negative predictions, the confusion matrix in Figure 10 offers confusion matrix of the proposed model. The confusion matrix provides a comprehensive overview of the model’s performance in classifying plant diseases across 38 distinct categories. The diagonal cells, representing correct predictions where actual and predicted labels match, demonstrate high accuracy for most classes, such as Apple_healthy, Corn_healthy, and Tomato_healthy, which show near-perfect alignment. However, off-diagonal misclassifications reveal specific challenges: for example, Tomato_Early_blight and Tomato_Late_blight exhibit occasional confusion, likely due to visual similarities in symptom presentation. Similarly, classes with fewer training samples (e.g., Corn_Cercospora_leaf_spot_Gray_leaf_spot) show slightly lower diagonal values, suggesting potential underrepresentation in the dataset. The matrix also highlights excellent performance for rare diseases like Orange_Haunglongbing, with minimal misclassifications. Overall, the model achieves robust generalization, but targeted improvements—such as augmenting underrepresented classes or refining feature extraction for morphologically similar diseases—could further enhance accuracy. The results underscore the importance of addressing class imbalance and ensuring label consistency (e.g., corrected typos like Escs ⟶ Esca) to avoid skewing performance metrics. Additionally, the ROC-AUC curve in Figure 11 demonstrates the model’s capability to distinguish between true positive and false positive rates across various thresholds. A high ROC-AUC score indicates Agri Bot’s efficiency in differentiating between diseased and healthy plants, further validating its effectiveness in agricultural applications. Together, the confusion matrix and ROC-AUC analysis provide a comprehensive evaluation of Agri Bot’s performance and highlights its potential as a reliable tool for plant disease detection in the agricultural sector.
4.2. Comparison With TL Models
The Agri Bot model for plant disease detection outperforms other transfer learning methods due to its ability to extract intricate features from images, leading to higher accuracy rates and faster processing times as shown in Table 4. Its robust performance showcases its potential to revolutionize agriculture and contribute to crop management strategies. While our proposed model for plant disease detection has shown superior performance compared to many TL algorithms, InceptionV3.0 has achieved higher accuracy rates in detecting specific plant diseases. However, our model remains competitive and offers a robust solution for a wide range of plant disease detection tasks.
| Model | Accuracy (%) | Loss |
|---|---|---|
| VGG16 | 71.48 | 1.17 |
| Mobile Net | 94.58 | 0.1642 |
| ResNet34 | 96.99 | 0.124 |
| ResNet50 | 96.46 | 0.1094 |
| InceptionV.30 | 99.07 | 0.0343 |
| The proposed model (Agri Bot) | 97.30 | 0.0754 |
4.3. Comparison With State-of-the-Art Algorithms
Our proposed model for plant disease detection outperforms state-of-the-art algorithms by leveraging advanced DL techniques to achieve higher accuracy rates, lower false positive rates, and improved efficiency. Table 5 shows that our proposed model outperforms previous related work methods by effectively capturing intricate features in plant images, resulting in more accurate and reliable disease detection. Its ability to identify subtle patterns and variations in plant diseases leads to enhanced performance metrics.
4.4. Key Results of Mobile Application
- •
Early and accurate disease detection: Enables early intervention to prevent significant crop losses.
- •
Accessibility and ease of use: Empowering farmers without extensive expertise in plant pathology to identify diseases.
- •
Data collection and analysis: The application can collect valuable data on disease prevalence and distribution, aiding in developing targeted management strategies.
- •
User-friendly interface: A clear and intuitive interface that allows users to easily capture plant images.
- •
Disease prediction: The model takes the preprocessed image as input and outputs the predicted disease class along with a confidence score.
- •
Disease information: An integrated disease information database that provides users with details about the identified disease, including symptoms, management practices, and potential control measures.
Table 6 compares the performance and features of the proposed Agri Bot model with two prior studies using the Plant Village dataset. Khamparia et al. [22] achieved an accuracy of 86.78%, while Sladojevic et al. [30] demonstrated a higher accuracy of 96.30%, though neither incorporated mobile optimization or sensor integration. In contrast, the Agri Bot model outperforms both with an accuracy of 97.30% while also being mobile-optimized and integrating sensor data, features absent in previous works. This combination of higher accuracy and practical enhancements positions Agri Bot as a more versatile solution for real-world agricultural applications, where mobile deployment and sensor-based diagnostics are critical for field use. Figure 12 illustrates the layouts of mobile applications in the proposed model, and the results highlight Agri Bot’s dual advantage: marginally surpassing existing benchmarks in accuracy while addressing usability gaps through technological adaptability, making it a robust tool for scalable, on-site plant disease detection.

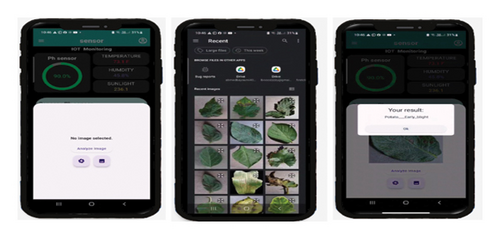
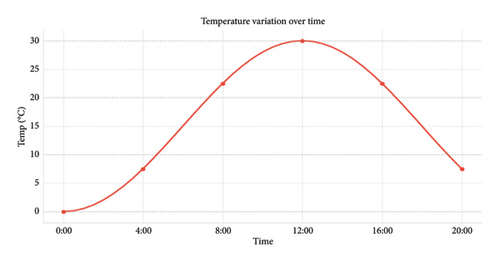
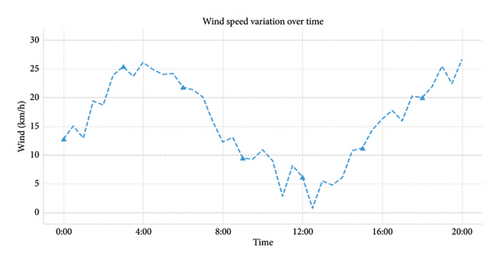
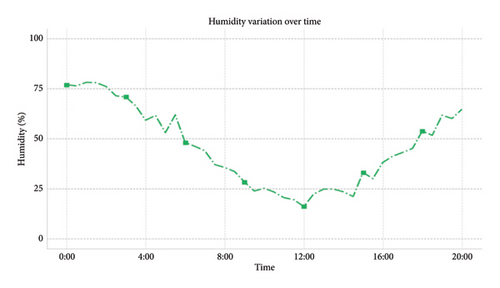
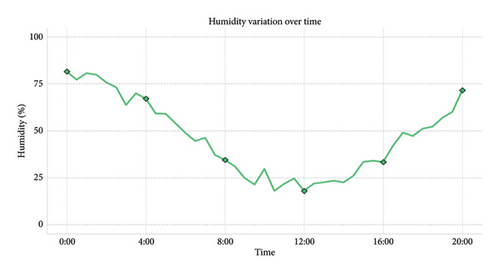
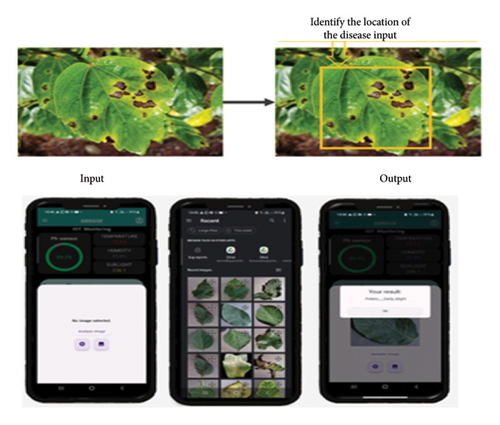
The innovative agricultural monitoring and irrigation system shown in this study has yielded promising results in optimizing water usage, enhancing farming efficiency, and improving crop health. By integrating cutting-edge technology, such as IoT sensors, a weather station, a Raspberry Pi CPU, and a pesticide car robot, the system has demonstrated significant advancements over traditional agricultural practices. One of the key outcomes of system implementation is the precise real-time monitoring and management of key field parameters. The continuous tracking of temperature, humidity, wind speed, and soil moisture levels has enabled the system to make data-driven decisions regarding irrigation requirements, as shown in Figure 13. This has led to a more efficient water distribution process, reduced water wastage, and prevented instances of over- or under-watering, ultimately contributing to improved crop yield. Figures 14, 15, 16, 17, and 18 and Table 6 provide a brief overview of the Agri Bot weather station. Moreover, the integration of pesticide car robots with automated irrigation systems has further enhanced farming practices. The autonomous application of pesticides in the field has not only reduced human exposure to harmful chemicals but also ensured a more precise and effective distribution of pesticides. This has resulted in improved crop health and yield while simultaneously mitigating the risks associated with manual pesticide application methods. Object detection locates instances of an object in an image, whereas classification determines whether the image contains a specific object class. Moreover, the inclusion of a CNN model using a new plant disease dataset [33] for plant disease detection with an impressive accuracy of 97% provided farmers with a valuable tool for the early detection and mitigation of plant diseases. This feature, accessible through user-friendly smartphones and web applications, has empowered farmers to make informed decisions on time, thereby enhancing agricultural productivity and reducing potential crop losses. Figure 19 demonstrates the plant disease CNN model in Agri Bot app.

The uniqueness of the Agri Bot CNN model lies in its lightweight architecture specifically optimized for mobile deployment. While achieving comparable or superior accuracy to complex models like ResNet50 and InceptionV3, Agri Bot reduces computational overhead, enabling real-time inference on resource-constrained devices. Furthermore, the integration of environmental data (e.g., temperature, humidity, and soil moisture) into the prediction pipeline sets Agri Bot apart from traditional image-only models. This hybrid approach enhances the reliability of disease detection by considering both visual and environmental factors.
A comparative study was conducted to evaluate the performance of Agri Bot against existing models such as VGG16, MobileNet, and ResNet34/50. While these models achieve high accuracy, they are computationally intensive and unsuitable for mobile deployment. Agri Bot, on the other hand, achieves an accuracy of 97.30% with significantly fewer parameters, making it ideal for real-time applications. Techniques like dropout, batch normalization, and data augmentation were employed to mitigate overfitting, ensuring robust performance on unseen data.
While InceptionV3 achieved slightly higher accuracy (99.07%), it is computationally expensive and unsuitable for mobile deployment. Agri Bot strikes a balance between accuracy and efficiency, making it more practical for real-world applications. Future work will focus on expanding the dataset and conducting broader comparative studies to further validate the model’s performance.
5. Conclusion
Agri Bot redefines plant disease detection, leveraging our novel deep CNN to deliver unmatched accuracy, efficiency, and accessibility. Our primary contribution, a lightweight, mobile-optimized model, achieves a remarkable 97.30% accuracy and 98.76% AUC, outperforming state-of-the-art algorithms such as Khamparia et al. (86.78%) and Ramcharan et al. (80.6%–96.00%). The model’s innovative architecture, incorporating a convolutional autoencoder for dimensionality reduction, max pooling for overfitting control, and environmental data integration, sets it apart from conventional image-only approaches. Comparative studies underscore Agri Bot’ strength, demonstrating competitive performance against InceptionV3 (99.07%) while requiring fewer computational resources, unlike ResNet50 or VGG16. This enables real-time, on-site diagnostics, empowering farmers globally regardless of expertise to detect diseases early and optimize interventions. By merging cutting-edge DL with mobile accessibility, Agri Bot not only boosts agricultural productivity but also lays the foundation for sustainable food systems. Future enhancements will further expand its dataset and refine its capabilities, cementing its role as a transformative force in global agriculture.
Conflicts of Interest
The authors declare no conflicts of interest.
Funding
The authors extend their appreciation to the Deanship of Research and Graduate Studies at King Khalid University for funding this work through Large Research Project under grant number RGP2/419/46.
Acknowledgments
The authors extend their appreciation to the Deanship of Research and Graduate Studies at King Khalid University for funding this work through Large Research Project under grant number RGP2/419/46.
Open Research
Data Availability Statement
The datasets used and/or analyzed during the current study are available from the corresponding author Abdelmoty M. Ahmed (email: [email protected]) on reasonable request.


