Intelligent Joint Optimization of Deployment and Task Scheduling for Mobile Users in Multi-UAV-Assisted MEC System
Abstract
Mobile edge computing (MEC) servers integrated with multi-unmanned aerial vehicles (multi-UAVs) present a new system the multi-UAV-assisted MEC system. This system relies on the mobility of the UAVs to reduce the transmission distance between the servers and mobile users, thereby enhancing service quality and minimizing the overall energy consumption. Achieving optimal UAV deployment and precise task scheduling is crucial for improved coverage and service quality in this system. This problem is framed as a nonconvex optimization problem known as joint task scheduling and deployment optimization. Recently, an optimization technique based on a dual-layer framework: Upper layer optimization and lower layer optimization have been proposed to tackle this problem and achieved superior performance compared to the alternative methods. In this framework, the lower layer was responsible for task scheduling optimization, while the upper layer was designed to assist in optimizing UAV deployment and thus achieving improved coverage and enhanced task scheduling for mobile users, thereby minimizing the total energy consumption. However, further refinement of upper layer optimization is needed to improve the deployment process. In this study, the upper layer undergoes enhancement through key modifications: First, random selection of the solutions is replaced with sequential selection to maintain the unique characteristics of each individual throughout the optimization process, fostering both exploration and exploitation. Second, a selection of recently reported metaheuristic algorithms, such as spider wasp optimizer (SWO), generalized normal distribution optimization (GNDO), and gradient-based optimizer (GBO), are adapted to optimize UAV deployments. Both improved upper layer and lower layer optimization led to the development of novel, more effective optimization approaches, including IToGBOTaS, IToGNDOTaS, and IToSWOTaS. These techniques are evaluated using nine instances with a variety of mobile tasks ranging from 100 to 900 to test their stability and then compared to different optimization techniques to measure their effectiveness. This comparison is based on several statistical information to determine the superiority and difference between their outcomes. The results reveal that IToGBOTaS and IToSWOTaS exhibit slightly superior performance compared to all other algorithms, showcasing their competitiveness and efficacy in addressing the optimization challenges of the multi-UAV-assisted MEC system.
1. Introduction
In recent years, mobile devices have been ubiquitous in our daily lives, thanks to their high capacity to perform various tasks such as speech recognition, image conversion, and virus scanning [1, 2]. Nevertheless, those tasks require high processing and storage capabilities that make them difficult to be performed by mobile devices [3]. Therefore, cloud computing and fog computing technologies have been recently employed as robust resource providers to allocate storage capacities and computing power to these devices assisting them in processing resource-intensive tasks. In essence, tasks from mobile devices are offloaded to a cloud server for processing and the feedback is then sent back to the devices [4]. However, the cloud servers may be situated far from the mobile devices, potentially resulting in delayed responses due to the long time taken to receive tasks from mobile users and send responses back to them.
Hence, mobile edge computing (MEC) emerges as a robust solution to address these shortcomings. By utilizing multiple servers situated at the network edge, MEC facilitates the offloading of users’ tasks from mobile devices to the nearest server [5]. Nevertheless, the static nature of the MEC servers restricts their ability to adapt to the varying needs of mobile devices. Also, natural disasters and climate change may affect the MEC network and offload tasks. In response to these shortcomings, unmanned aerial vehicles (UAVs) have been recently integrated with the MEC servers to present a novel system, known as UAV-assisted MEC. This integration aims to enhance the quality of services (QoS) provided to users. In this system, the MEC servers are mounted on the UAVs, offering two distinct advantages: (I) reducing the transmission distance between the server and mobile users through the mobility of UAVs and (II) presenting improved line-of-sight links for the mobile users by flying the UAVs at a high altitude [6].
In [6], the integration of multiple UAVs, as opposed to a single UAV, into the MEC system was explored to expedite the collection and processing of mobile tasks. This integration aimed to minimize the total energy consumption compared to utilizing a single UAV. However, this approach poses two significant issues: optimizing UAV deployment and task scheduling, which need to be carefully addressed to minimize overall energy consumption effectively. To tackle these issues, the authors in [6] introduced a novel greedy method for scheduling mobile tasks for UAVs and employed population-based differential evolution (DE) to optimize UAV deployment. It is essential to note that task scheduling heavily relies on UAV deployment. Hence, tackling the deployment optimization problem carefully is crucial for achieving better task scheduling and ultimately minimizing overall energy consumption. In essence, the task scheduling problem comprises two main parts: offloading decision and resource allocation. The offloading decision determines whether a task should be executed locally on mobile devices or transmitted to a UAV for remote processing. Meanwhile, resource allocation determines the resources that are required to complete this task efficiently.
The algorithm proposed in [6] demonstrates remarkable outcomes in facilitating UAV deployment and scheduling tasks for the multi-UAV-enabled MEC system with a dual-layer framework: upper layer optimization, driven by DE, for deployment optimization, and lower layer optimization handles task scheduling. Despite its effectiveness, this algorithm still warrants further improvement and refinement, particularly in the upper layer optimization, to better deploy UAVs and perform task scheduling, thus efficiently minimizing the total energy consumption in the MEC system. Therefore, in this paper, we propose a novel optimization technique, namely, IToGBOTaS, IToGNDOTaS, IToDETaS, and IToSWOTaS, aimed at achieving more accurate UAV deployment and task scheduling with the ultimate goal of minimizing the total energy consumption. These techniques are based on a dual-layer framework: lower layer optimization based on the greedy algorithm and improved upper layer optimization. In the lower layer optimization, we employ the greedy algorithm presented in [6] as it has proven its effectiveness and efficiency in tackling this problem. Meanwhile, the upper layer optimization is improved in this research with a two-step approach. The first step discards the random selection used to replace stop points in the original layer and relies on sequential replacement. This sequential approach ensures that solutions in the current deployment are replaced with new solutions generated from the same individual in the updated deployment. This strategy preserves the essential exploration and exploitation behaviors of the metaheuristic algorithms, thus guarding against a reduction in solution diversity that may lead to falling into local minima. The second step is based on employing a variety of metaheuristic algorithms, such as gradient-based optimization (GBO), generalized normal distribution optimization (GNDO), and spider wasp optimization (SWO), to assess their efficiency in obtaining the optimal deployment of UAVs.
The efficacy of these newly proposed optimization techniques is evaluated using nine instances with a number of mobile tasks ranging between 100 and 900. This comprehensive assessment aims to validate the stability and performance of the algorithms. To validate the effectiveness of the proposed models, both IToDETaS and IToGBOTaS are initially compared against the highly performing algorithm, ToDETaS [6], across several performance metrics. This includes metrics such as best fitness, worst fitness, average fitness, standard deviation, Friedman mean rank (Frk), Wilcoxon rank sum (WRS) test, and multiple comparison test. This thorough comparison highlights the effectiveness of our proposed algorithms. The results proved the effectiveness of IToGBOTaS for all performance indicators for all used instances, except for the instance with 900 tasks that could be better solved by the IToDETaS technique. Furthermore, to show the effectiveness of the proposed algorithms, they are compared against other several metaheuristic algorithms, such as the sine-cosine algorithm (SCA), the whale optimization algorithm (WOA), the equilibrium optimizer (EO), and the crested porcupine optimizer (CPO), under the same dual-layer design. The results show that the performance of IToGBOTaS and IToSWOTaS is competitive and outperforms all other compared algorithms.
- •
Proposing novel metaheuristic-based optimization techniques tailored for the joint optimization of task scheduling and deployment optimization of UAVs in a multi-UAV-assisted MEC system based on a dual-layer framework: lower layer optimization based on a greedy algorithm for task scheduling and upper layer optimization based on the metaheuristic algorithms for deployment optimization.
- •
Enhancement of the upper layer optimization step by replacing the random selection of stop points with sequential selection to preserve the characteristics of each individual in the population, thereby ensuring the exploration and exploitation operators of the metaheuristic algorithms are preserved within the optimization process.
- •
Comprehensive investigation of the proposed algorithms’ performance using nine instances with a number of mobile users ranging between 100 and 900.
- •
Extensive comparison of the proposed algorithms against several metaheuristic algorithms and ToDETaS to demonstrate their effectiveness in optimizing task scheduling and UAV deployment.
- •
Evaluation results indicate that the performance of IToGBOTaS is comparable to that of IToSWOTaS and outperforms all other compared algorithms.
The rest of this paper is organized as follows: Section 2 presents the related work; Section 3 presents the problem formulation; Section 4 presents the standard metaheuristic algorithms used in this study; in Section 5, our proposed algorithms for task scheduling and deployment optimization in multi-UAV-enabled MEC systems are explained; the experiment settings are provided in Section 6; the experimental results are provided in Section 7; Section 8 presents managerial implications; and the conclusion and future work are given in Section 9.
2. Related Work
Several studies in the literature proposed various approaches to tackle task scheduling in MEC systems. In [7], Zhang et al. proposed an energy-efficient offloading (EEO) technique in MEC systems to minimize energy costs. They formulated the offloading decision as an optimization problem and developed the EEO mechanism to minimize the total energy consumption. In [8], Chen et al. presented a study to jointly address task scheduling and UAV deployment in the MEC system. Similar to [6], they divided the optimization problem into two layers: the lower layer for task scheduling and the upper layer for optimizing UAV deployment by integrating both particle swarm optimization and genetic algorithms. Zhang et al. [9] utilized a game-theoretic method to optimize the offloading decision and resource allocation problems. In [10], the genetic algorithm was employed to optimize task scheduling in UAV-enabled MEC systems.
In addition, several other algorithms, especially metaheuristic algorithms due to their high effectiveness in solving several NP-hard optimization problems [11–13], were proposed in the literature for optimizing task scheduling, including the deep reinforcement learning algorithm [14], gray wolf optimizer (GWO) [15], particle swarm optimization [16–18], Nutcracker optimization algorithm [19], GBO [19], genetic algorithm [20], trees social relations algorithm [21], snake optimizer [22], Q-learning-based hybrid algorithm [23], and deep reinforcement learning approach [24].
The UAV deployment is essential; it must consider the UAV’s trajectory from the beginning to the endpoint while considering safety and shorter distances to save consumed energy. Several papers in the literature have been proposed for addressing the trajectory optimization problem for single and multi-UAVs, including those reviewed in the remainder of this section. For a single UAV-enabled MEC, the authors in [25] designed a framework to maximize the computation rate in a UAV-enabled MEC system by optimizing its trajectory and communication resources simultaneously. This problem was classified as a nonconvex optimization problem and is a highly challenging task. Hence, they presented two-stage and three-stage alternate techniques to solve this problem. In [26], the authors designed an optimization problem for the joint optimization of UAV trajectory, resource allocation, and offloading decisions with the purpose of minimizing task delay and energy consumption.
Huang et al. [27] introduced an encoding strategy aimed at capturing the solutions for optimization of UAV deployment in a way that avoids various drawbacks, including mixed variables and extreme dimensionality. This strategy was combined with the DE algorithm to suggest a new variation, VIPS, which was evaluated across seven instances. In addition, comparative analysis against various optimization approaches demonstrates the superiority of the encoding scheme. In [28], leveraging the same encoding methodology, three different metaheuristic optimization algorithms, including the flower pollination algorithm (FPA), the SCA, and the salp swarm algorithm (SSA), were applied to optimize the UAV trajectory with the aim of minimizing total energy consumption. These algorithms were developed to regulate the number and positions of stop points over the drone deployment. Extensive evaluations across diverse scenarios highlighted SCA’s remarkable performance, surpassing other algorithms consistently. Similarly, Zhang [29] enhanced the backtracking search algorithm (BSA) by utilizing the same encoding technique to solve this problem, which was enhanced with opposition-based learning and a population updating technique, called BSADP. To demonstrate the effectiveness of the proposed BSADP, it was tested on multiple cases and the obtained results compared to the rival algorithms.
Asim et al. [8] devised a GA-based trajectory planning technique, integrating variable population size, to minimize energy consumption in multi-UAV-aided MEC systems. Their approach involved two stages: initially, employed GA with variable population size to determine the near-optimal stop point deployment for UAVs, followed by utilizing the multichrome genetic algorithm to find out the interrelation among UAVs and HPs, the near-optimal stop points order for UAVs, and the UAV’s near-optimal number. Furthermore, in [9], an iterative optimization method coupled with a double-loop structure is proposed to jointly optimize the partial computation offloading, CPU allocation, user association, power and spectrum resources, and UAVs’ trajectory, aiming to minimize total energy consumption and improve computation efficiency in MEC systems. Huang et al. [30] presented a trajectory planning algorithm that consists of three stages to reduce UAVs’ overall energy usage in the multi-UAV-enabled MEC system. Initially, the DE method was paired with a variable population-based encoding strategy to update the number and placements of stop points at the same time. Subsequently, the k-means clustering algorithm was used to split the given stop points into groups proportional to the number of UAVs, with each group including stop points visited by the same UAV. Finally, a low-complexity greedy technique was used to identify the order of stop points in each cluster, resulting in the trajectory of each UAV. There are several other approaches proposed recently for optimizing task scheduling problems in MEC systems [31–33].
3. Problem Formulation
In the multi-UAV-assisted MEC system, a significant number of mobile users M = {1, 2 … .m} are served by N UAVs acting as flying edge clouds. In this system, each task can be executed either locally (i.e., on its mobile device) or on UAVs. Therefore, each task could be executed on (N + 1) execution patterns. Those execution patterns are denoted as Q = {0, 1, 2, …, N}. For more illustration, k = 0| k ∈ Q refers to executing the task on the local device, while k > 0 indicates executing the tasks on the kth UAV. In addition, N UAVs use frequency division multiple access with an equal bandwidth to serve all mobile devices. In this study, as described in [6], each ith mobile user is represented in 3-D coordinates (xi, yi.0) and assigned a task Ti. This task is represented as Ti = (Ci, Di), where Ci stands for the total number of CPU cycles required to execute this task and Di stands for the input data size. All those parameters are given a priori. All UAVs are first prepared with directional antennas of constant bandwidth. In this study, the altitude of the flying UAVs is constant and symbolized as H, and the location of the jth UAV is represented in 3-D coordinates (Xj, Yj, H). It worth mentioning that Xj, Yj, N are considered decision variables that need to be optimized for reaching the best coordinates and UAVs that could achieve better deployment. To manage the task execution on various patterns, according to [6], a binary matrix a of (M × (N + 1)) cells is defined and initialized with 0. If the task Ti is processed in pattern k, ai, q = 1; otherwise, ai, q = 0. In addition, for the resource allocation, a matrix f is defined, where fi,q stands for the resources assigned to the task Ti in pattern q. In the multi-UAV-assisted MEC system, as discussed in [6], three models are employed to estimate the energy consumed by both UAVs and local devices for completing m tasks. Those models are discussed in detail in the rest of this section.
3.1. Local Computing Model
3.2. UAV-Enabled MEC and Transmission Model
3.3. UAV Hover Model
4. Metaheuristic Algorithms: Overview
4.1. GBO
Recently, a new metaheuristic optimizer was proposed for tackling optimization problems, especially continuous optimization problems [42]. This algorithm was called a GBO and was based on two stages: local escaping operator (LEO) and gradient search rule (GSR), which are discussed in detail in the following sections.
4.1.1. GSR Phase
4.1.2. LEO Phase
-
Algorithm 1: Pseudocode of GBO.
-
Input: N, and tmax;
-
Output:
- 1.
Create an initial population of N individuals, .
- 2.
Calculate the objective function value for
- 3.
Extracting and
- 4.
t = 1; %% t is used to count number of function evaluation
- 5.
while (t < tmax)
- 6.
for each
- 7.
//GSR strategy.
- 8.
Applying (31) to generate the new solution
- 9.
//LEO Strategy
- 10.
Applying (34) to generate the new solution
- 11.
t = t + 1
- 12.
End
- 13.
Update
- 14.
End
4.2. GNDO
Ahmadianfar [43] has recently proposed a new optimization algorithm inspired by normal distribution theory. This algorithm was called GNDO and was composed of two different search operators: exploration and exploitation. The former focuses on exploiting the search space around the best solutions in the current population, while the latter seeks to explore unseen regions to avoid getting stuck in local minima. In detail, those two operators are discussed in the next two sections.
4.2.1. Local Exploitation Operator
4.2.2. Global Exploration Operator
-
Algorithm 2: Pseudocode of GNDO.
-
Input: N and tmax;
-
Output:
- 1.
Create an initial population of N individuals, .
- 2.
Calculate the objective function value for
- 3.
Extracting
- 4.
t = 1; %% t counts the number of function evaluation
- 5.
while (t < tmax)
- 6.
for each
- 7.
if r1 < r2
- 8.
//Exploitation strategy
- 9.
Applying (43) to generate the new solution
- 10.
Else
- 11.
//Exploration Strategy
- 12.
Applying (48) to generate the new solution
- 13.
End
- 14.
t = t + 1
- 15.
End
- 16.
Update
- 17.
End
4.3. DE
DE [44] is a natural evolution–inspired optimization technique for solving continuous optimization problems. DE, such as genetic algorithms, has three main operators: crossover, mutation, and selection. The details of the DE algorithm are presented in the sections below. Algorithm 3 contains the pseudocode for this algorithm.
-
Algorithm 3: Standard DE.
-
Input: N and tmax;
-
Output:
- 1.
Create an initial population with N individuals, .
- 2.
Calculate the objective function value for
- 3.
Extracting
- 4.
t = 1; %% t counts the number of function evaluations
- 5.
Assign F and Cr
- 6.
while (t < tmax)
- 7.
fori = 0 to N
- 8.
Generate by (50)
- 9.
for j = 0 to d
- 10.
r1: a value chosen at random between 0 and 1.
- 11.
If(r1 < Cr‖j = jr)
- 12.
- 13.
Else
- 14.
- 15.
End if
- 16.
end for
- 17.
if
- 18.
- 19.
endif
- 20.
Update if there is a better solution
- 21.
t = t + 1
- 22.
end for
- 23.
end while
4.3.1. Mutation Operator
4.3.2. Crossover Operator
4.3.3. Selection Operator
5. Proposed Algorithms: IToDETaS, IToGBOTaS, and IToGNDOTaS
The task scheduling problem in the multi-UAV-enabled MEC system is primarily dependent on the deployment of UAVs, where a task could be executed on the UAV only if this task exists within this UAV’s coverage area. From that, the deployment of multiple UAVs has to be accurately optimized to deploy them in a form that aids in covering all mobile tasks as effectively as possible to minimize total energy consumption. In addition, the deployment of UAVs cannot be considered unless the tasks are accurately scheduled. Therefore, both the deployment of UAVs and task scheduling in the multi-UAV-assisted MEC system have to be accurately addressed to minimize total energy consumption.
In [6], two optimization layers, upper and lower, were proposed to optimize those two problems, where the upper layer is responsible for optimizing the deployment and the lower layer is responsible for optimizing the task scheduling problem. The upper layer used the DE algorithm in conjunction with an effective encoding scheme to optimize the deployment, while task scheduling was solved in the lower layer based on an effective greedy algorithm. However, in [6], the new deployment generated by DE is randomly inserted one by one in the previous deployment and that might reduce the probability of reaching better outcomes because each individual in the population tries to improve its previous solution, and hence, replacing the new solution with a random solution might leave the bad solution of this individual in the population, negatively affecting the whole deployment. Therefore, we found that the solution obtained by one individual might be more effective if it is inserted in place of its original position in the previous deployment. In our research conducted in this paper, we extensively focus on how to effectively optimize the deployment of UAVs for better task scheduling with the purpose of minimizing total energy consumption in multi-UAV-enabled MEC systems. This optimization was based on two steps: The first is based on replacing the old solution of an individual in the current deployment with its newly generated solution to aid in diversifying the stop points, thereby aiding in covering the area of mobile users more effectively. The second step is based on adapting new metaheuristic-based algorithms for effectively finding the stop points of each UAV. In addition, the task scheduling of mobile tasks is addressed in our proposed algorithms using lower layer optimization based on a novel greedy algorithm, which is discussed in detail in [6]. In brief, the proposed algorithms for joint optimization of both task scheduling and deployment of UAVs are based on the following steps: encoding mechanism, initialization, improved upper layer optimization based on GBO, SWO, DE, and GNDO, and pseudocode of the proposed algorithms.
5.1. Solution Encoding Mechanism
- •
Simple.
- •
Fixing the number of dimensions for each individual.
- •
Enabling the removal and addition of new UAVs to the population easily.
- •
Affecting effectively and efficiently the performance of metaheuristic and evolutionary algorithms.
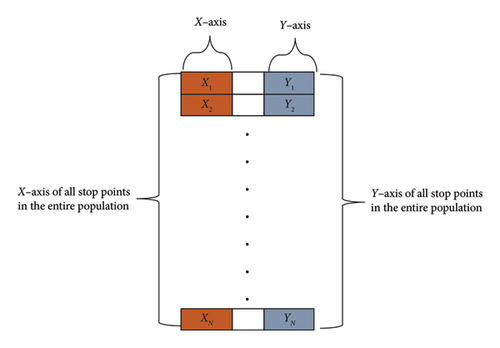
5.2. Initialization Step
In the multi-UAV-assisted MEC system, N UAVs are employed to collect and process tasks of mobile users. Those UAVs must be distributed in an effective manner to ensure that the distance between them is far enough to avoid any possible collision. To handle this challenge, in [6], an effective initialization mechanism was proposed. This mechanism first generates the stop point of a UAV and adds it to the current population Pp. Then, the stop point for the second UAV is randomly generated, and the distance between it and each UAV in Pp is computed. If this distance is greater than with all UAVs in Pp, it will be added to Pp; otherwise, the stop point of this UAV is regenerated until this condition is satisfied. However, probably, the stop point for a UAV might destroy the constraint even after it is generated many times. This is caused when the added stop points are not effectively distributed over the search space. Therefore, this mechanism reinitializes all stop points if any stop point still destroys constraint after a number of attempts, up to 200, as recommended in [6]. Finally, the steps of this initialization mechanism are described in Algorithm 4.
-
Algorithm 4: Initialization step
-
Input: N;
-
Output: Pp
- 1.
i = 1; %% Count the inserted stop points
- 2.
att = 0 % count the unsuccessful attempts
- 3.
while (i < N)
- 4.
if t = = 1
- 5.
Generate a stop point for the ith UAV and add it into Pp
- 6.
Else
- 7.
Generate a stop point for the ith UAV
- 8.
F = 1
- 9.
for j = 1 : i − 1
- 10.
Compute between the ith UAV and jth UAV
- 11.
- 12.
F = 0
- 13.
end
- 14.
end
- 15.
if F = = 1
- 16.
Add the ith UAV into Pp
- 17.
att = 0
- 18.
Else
- 19.
att = att + 1
- 20.
if att > 200
- 21.
Empty Pp and Go to Line 1
- 22.
end
- 23.
Go to Line 7 to regenerate the stop point of this UAV
- 24.
end
- 25.
end
- 26.
end
5.3. Improved Upper Layer Optimization: GBO, DE, and GNDO
In this layer, the number and stop points of UAVs are estimated to optimize the deployment of UAVs, thereby scheduling mobile tasks more accurately and minimizing overall energy consumption. According to the solution encoding scheme, the number of UAVs is equal to the population size. Hence, to optimize the number of UAVs, we only need to minimize N in a form that could minimize the overall energy consumption, taking into consideration that all tasks have not been processed in real time but could be executed under the delay constraints discussed in C7 and C8. Based on that, in [6], the authors suggested that the number of UAVs should be minimized as much as possible. The population size in our proposed algorithms is set to N = m/nmax, and the elimination operator discussed in [6] was applied to remove the individuals from Pp that has the lowest distance with the remaining individuals.
-
Algorithm 5: Pseudocode of IToGBOTaS.
-
Input: N and tmax;
-
Output:
- 1.
Pp = Initialize N individuals, using Algorithm 4
- 2.
Compute a and f according to Pp under the greedy algorithm
- 3.
Evaluate the overall energy consumption under {N, Pp, a, f}
- 4.
and
- 5.
t = 1; %% Function evaluation counter
- 6.
F = 0 %%A flag to determine if the algorithm could not achieve a feasible solution for a number of consecutive function evaluations
- 7.
Inf = 0%% Number of consecutive times the algorithm could not achieve a feasible solution
- 8.
while (t < tmax)
- 9.
while (F = = 0 && {N, Pp, a, f}is feasible)
- 10.
Apply the elimination operator discussed above
- 11.
end
- 12.
%% Generate new population using GBO
- 13.
for each
- 14.
//GSR strategy.
- 15.
Applying (31) to generate the new solution
- 16.
//LEO Strategy
- 17.
Applying (34) to generate the new solution
- 18.
t = t + 1
- 19.
End
- 20.
- 21.
%% Evaluation
- 22.
fori = 1 : N
- 23.
%% Creating new deployment Ppn1
- 24.
Ppn1 = Pp
- 25.
- 26.
Compute an and fn according to Ppn1 under the greedy algorithm
- 27.
Evaluate the overall energy consumption under {N, Ppn1, an, fn}
- 28.
Pp = Applying (53) to compare Ppn1 with Pp
- 29.
- 30.
- 31.
End
- 32.
- 33.
- 34.
End
- 35.
if {N, P, a, f} is infeasible
- 36.
Inf = Inf + 1
- 37.
if Inf > 1000
- 38.
- 39.
Break;
- 40.
end
- 41.
end
- 42.
if {N, P, a, f} is infeasible && F = = 0
- 43.
Inf = 0
- 44.
Break;
- 45.
end
- 46.
t = t + 1
- 47.
End
- 48.
End
- •
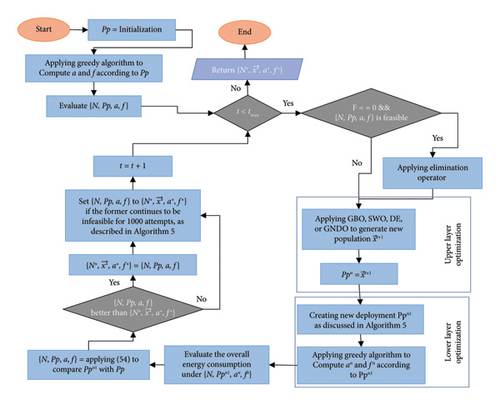
Step 1: Set Pp to Ppn1, then the ith stop point in Ppn is used to replace the same stop point in Ppn1.
- •
Step 2: Ppn1 is used with the greedy algorithm to compute a and f, which are then employed to compute the overall energy consumption in the system.
- •
Step 3: Applying (54) to compare Ppn1 and Ppn
- •
Step 4: Update and
- •
Step 5: If the number of consecutive infeasible solutions exceeds 1000, then .
- •
Repeat Steps 1–5 to observe the performance of all UAVs in Ppn.
Finally, the optimization process of IToGBOTaS is repeated until the maximum number of function evaluations are met, and then the best-so-far solution is returned . The GNDO, SWO, and DE algorithms were used to replace the search engine GBO in IToGBOTaS to propose three additional optimization techniques, namely, IToDETaS, IToSWOSTaS, and IToGNDOTaS, to observe their performance for optimizing the task scheduling and deployment of UAVs in the UAV-enabled MEC system. Figure 2 depicts a generic flowchart demonstrating how the upper layer optimization under four algorithms collaborates with the lower layer optimization under the greedy algorithm in the proposed algorithms.
6. Experimental Settings
- •
Ci|i∈{1, 2, …, m} is randomly generated between 16 and 1600 MCycles.
- •
Di|i∈{1, 2, …, m} is randomly generated between 10 and 10000 kb.
- •
H is assigned a value of 100 m.
- •
θ is equal to π/4.
- •
fi,0|i∈{1, 2, …, m} is randomly generated between 0 and 0.8 GHz.
- •
fi,k|i ∈ M, k ∈ Q − {0} is randomly generated between 0 and 10 GHz.
- •
η1 is set to 10−27.
- •
T is set to 1 s.
- •
P0 is equal to 1000 W.
- •
N0 is set to 10−20 W/Hz.
- •
G0 is set to 2.2846.
- •
β0 is set to 1.42 × 10⁻⁴.
- •
P is set to 1 W.
- •
B is set to 1 MHz.
- •
nmax is set to 10.
- •
is set to 10 m.
- •
η2 is set to 10−28.
- •
v is set to 3
| m | 100 | 200 | 300 | 400 | 500 | 600 | 700 | 800 | 900 | 1000 | 1100 | 1150 | 1200 | 1300 |
| Side_Length | 320 | 450 | 550 | 640 | 710 | 780 | 840 | 900 | 950 | 1000 | 1100 | 1150 | 1200 | 1300 |
All algorithms in this study are executed 25 independent times, and the obtained outcomes are analyzed using several performance metrics, such as average EC (AEC), average completed task (ACT), Frk, p value returned by the WRS test, and multiple comparison test based on Frk. In addition, the computational cost consumed by each algorithm for completing its task is estimated to show the speedup of each algorithm. The same maximum number of function evaluations, which is 3000, was set for all algorithms to ensure a fair comparison. Also, all algorithms are implemented using MATLAB R2019a on the same device.
7. Results and Discussion
This study assesses the performance of the proposed algorithms using nine instances with a number of mobile users ranging between 100 and 1500. In addition, those algorithms are compared to a recently published task scheduling technique known as ToDETaS [6] and several recently published metaheuristic algorithms as search engines to search for the best deployment for UAV, including the CPO [45], EO [46], SCA [47], and WOA [48]. The controlling parameters of all algorithms, including the proposed and compared algorithms, are set as recommended in the cited papers. This section first compares the proposed algorithms (IToGBOTaS and IToDETaS) to ToDETaS and ToGBOTaS to expose the effect of our improvement on the original upper layer optimization. Afterward, those proposed algorithms are extensively compared to several metaheuristic algorithms as search engines without adding our improvement to show their effectiveness. Finally, our improvement is assessed on all metaheuristic algorithms to show whether it could achieve better outcomes or not.
7.1. Comparison Between the Proposed Algorithms and ToDETaS
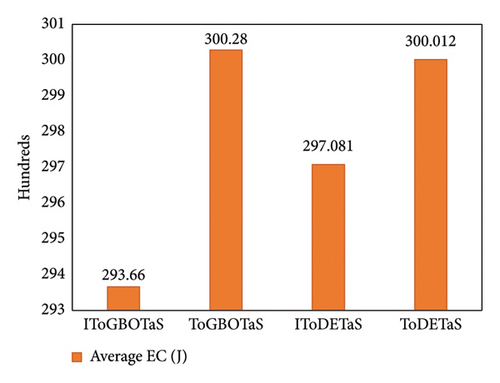
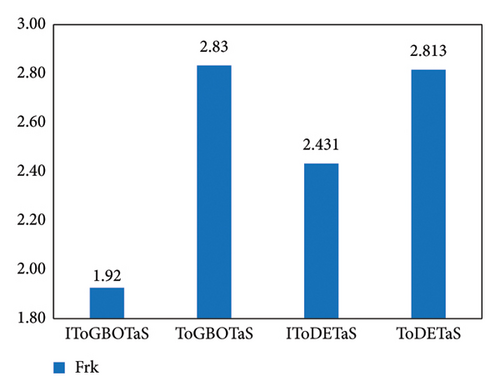
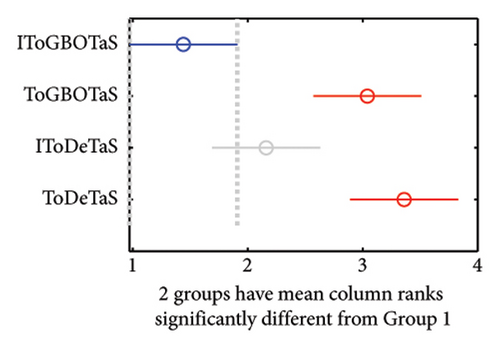
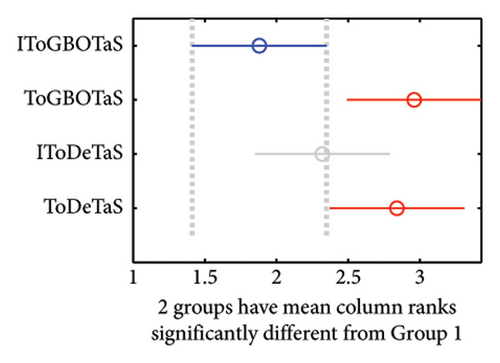
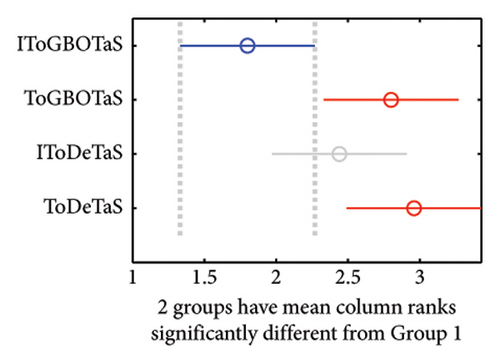
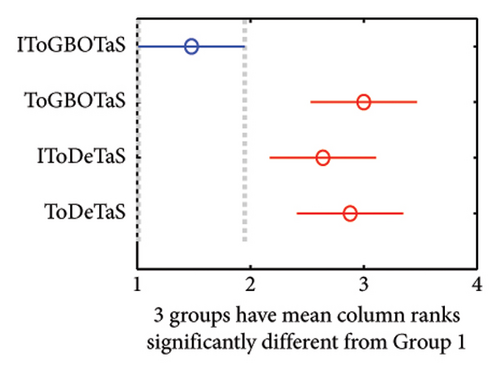
The proposed algorithms, IToGBOTaS, ToGBOTaS, and IToDETaS, are executed 25 independent times on each instance, and the obtained outcomes are reported in Table 1. This table shows that IToDETaS is better than all algorithms for only one instance with 900 mobile users, and IToGBOTaS is the best for the other instances in terms of all considered performance metrics. Those results reveal the effectiveness of our improvement to ToDETaS, which enables it to achieve better outcomes when applied to search for the best deployment for UAVs that could schedule the tasks more accurately and minimize the overall energy consumption. To highlight the overall performance of algorithms, Figures 3 and 4 show the average of AEC values and the average of Frk values reported in Table 2 for each algorithm. Those figures show the effectiveness of IToGBOTaS over all compared algorithms, where it could achieve an average AEC value of 29,365.77 and an average Frk of 1.92, IToDETaS is the second best, and ToGBOTaS is the worst. To show the difference between the outcomes of IToGBOTaS and those of the other algorithms, both the WRS test and the multiple comparison test are employed. The results of the WRS test are shown in Table 3, which reveals that IToGBOTaS is significantly different from ToDETaS for all instances, from ToGBOTaS for seven instances, and from IToDETaS for four instances. The results of the multiple comparison test are shown in Figure 5 for some instances. This figure shows that the means of IToGBOTaS are significantly different from those of ToGBOTaS and ToDETaS for all depicted instances, and are slightly different from those of IToDETaS for three instances and significantly different for the other instances.
| IToGBOTaS | ToGBOTaS | IToDETaS | ToDETaS | |||||||||
|---|---|---|---|---|---|---|---|---|---|---|---|---|
| AEC | CT | Frk | AEC | CT | Frk | AEC | CT | Frk | AEC | CT | Frk | |
| 100 | 5467.194 | 100 | 1.44 | 6026.806 | 100 | 3.04 | 5547.242 | 100 | 2.16 | 6106.855 | 100 | 3.36 |
| 200 | 11,698.652 | 200 | 1.88 | 12,058.732 | 200 | 2.96 | 11,978.587 | 200 | 2.32 | 11,938.864 | 200 | 2.84 |
| 300 | 17,739.386 | 300 | 1.80 | 18,099.681 | 300 | 2.80 | 17,820.134 | 300 | 2.44 | 18,379.305 | 300 | 2.96 |
| 400 | 23,030.334 | 400 | 1.72 | 23,830.741 | 400 | 2.76 | 23,950.400 | 400 | 2.92 | 23,670.814 | 400 | 2.60 |
| 500 | 27,394.586 | 500 | 1.48 | 29,033.679 | 500 | 3.00 | 28,793.588 | 500 | 2.64 | 28,793.945 | 500 | 2.88 |
| 600 | 34,182.666 | 600 | 2.20 | 34,582.930 | 600 | 2.80 | 34,503.353 | 600 | 2.28 | 34,543.058 | 600 | 2.72 |
| 700 | 41,178.541 | 700 | 2.20 | 41,418.776 | 700 | 2.40 | 41,578.494 | 700 | 2.48 | 41,938.290 | 700 | 2.92 |
| 800 | 48,044.770 | 800 | 1.96 | 49,244.350 | 800 | 2.84 | 48,844.941 | 800 | 2.56 | 49,284.434 | 800 | 2.64 |
| 900 | 55,555.869 | 900 | 2.64 | 55,955.351 | 900 | 2.88 | 54,356.447 | 900 | 2.08 | 55,355.565 | 900 | 2.40 |
- Note: Bold values represent the best and most competitive results.
| 100 | 200 | 300 | 400 | 500 | 600 | 700 | 800 | |
|---|---|---|---|---|---|---|---|---|
| ToGBOTaS | 2.7771E − 05 | 3.5681E − 04 | 1.3733E − 02 | 6.8504E − 04 | 3.5302E − 06 | 1.0034E − 02 | 7.4151E − 01 | 3.6093E − 03 |
| IToDETaS | 2.2156E − 01 | 4.6140E − 03 | 1.3517E − 01 | 2.0352E − 03 | 3.5836E − 05 | 4.8486E − 01 | 4.3768E − 01 | 9.8635E − 03 |
| ToDETaS | 5.1234E − 06 | 1.6708E − 03 | 4.2399E − 05 | 8.3203E − 03 | 2.7771E − 05 | 1.9360E − 02 | 3.7738E − 02 | 9.8635E − 03 |
- Note: Bold text highlights the p value less than 0.05, indicating the number of cases in which the proposed IToGBOTaS could produce different outcomes significantly.
7.2. Comparison With Six Rival Metaheuristic Optimizers Under Random Selection
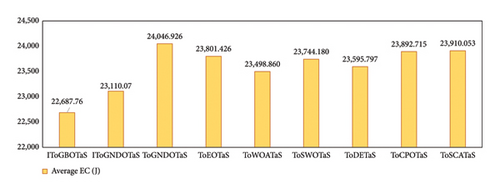
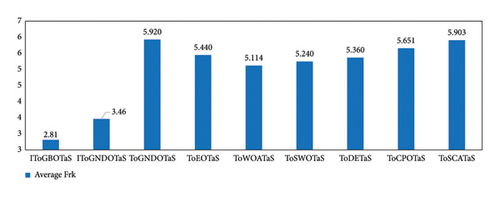
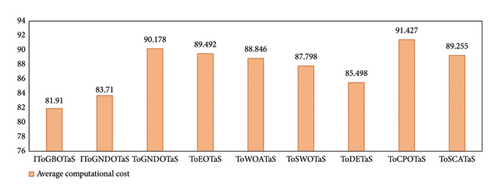
This section presents the results of an extensive comparison between the proposed algorithms, IToGBOTaS and IToGNDOTaS, and six rival optimizers based on the original upper layer optimization. Each algorithm is executed 25 times independently on each instance, and the results, which are represented in AEC, CR, and Frk, are shown in Table 4. This table reveals that all algorithms could execute all mobile tasks, but IToGBOTaS outperforms all algorithms in terms of AEC for six out of seven mobile tasks, and IToGNDOTaS could outperform the remaining tasks. To better clarify the results in this table, Figure 6 is presented to report the average AEC obtained by each algorithm on all observed instances. This figure shows that IToGBOTaS is the best with an average value of 22,687, followed by IToGNDOTaS as the second best with a value of 23,110, and ToGNDOTaS is the worst with a value of 24,046. Also, Figure 7 affirms that IToGBOTaS is the best-performing algorithm because it could achieve a better average value for the Frk metric. To show off the efficiency of each algorithm, the average computational cost on the observed instances is computed and reported in Figure 8, which shows that IToGNDOTaS and IToGBOTaS are slightly better than all compared algorithms.
| m | IToGBOTaS | IToGNDOTaS | ToGNDOTaS | ToEOTaS | ToWOATaS | ToSWOTaS | ToDETaS | ToCPOTaS | ToSCATaS | |
|---|---|---|---|---|---|---|---|---|---|---|
| 100 | AEC | 5387.214 | 5507.129 | 6026.884 | 5747.005 | 5827.122 | 5866.985 | 5866.941 | 5946.946 | 5627.190 |
| CT | 100 | 100 | 100 | 100 | 100 | 100 | 100 | 100 | 100 | |
| Frk | 2.68 | 3.44 | 6.08 | 4.84 | 5.76 | 5.32 | 5.76 | 5.88 | 5.24 | |
| 200 | AEC | 11,498.809 | 11,578.832 | 12,178.594 | 11,818.994 | 12,018.899 | 11,818.934 | 12,258.679 | 12,018.736 | 12,218.707 |
| CT | 200 | 200 | 200 | 200 | 200 | 200 | 200 | 200 | 200 | |
| FR | 2.48 | 3.08 | 5.80 | 5.08 | 5.76 | 4.68 | 6.16 | 5.52 | 6.44 | |
| 300 | AEC | 17,699.408 | 17,579.791 | 18,459.395 | 17,900.059 | 18,259.400 | 18,539.276 | 18,179.598 | 18,259.626 | 18,339.529 |
| CT | 300 | 300 | 300 | 300 | 300 | 300 | 300 | 300 | 300 | |
| FR | 2.72 | 3.08 | 6.28 | 4.72 | 5.12 | 5.72 | 5.80 | 5.84 | 5.72 | |
| 400 | AEC | 22,631.164 | 22,790.801 | 24,350.102 | 23,990.514 | 23,510.953 | 24,110.127 | 23,510.885 | 24,509.823 | 24,030.452 |
| CT | 400 | 400 | 400 | 400 | 400 | 400 | 400 | 400 | 400 | |
| FR | 3.00 | 2.88 | 6.16 | 5.72 | 4.52 | 5.48 | 4.84 | 6.40 | 6.00 | |
| 500 | AEC | 27,475.040 | 28,033.968 | 28,674.194 | 29,393.524 | 29,113.721 | 28,833.737 | 28,953.416 | 29,273.404 | 29,233.91 |
| CT | 500 | 500 | 500 | 500 | 500 | 500 | 500 | 500 | 500 | |
| FR | 2.76 | 3.44 | 5 | 6 | 5.76 | 5.04 | 5.24 | 5.68 | 6.08 | |
| 600 | AEC | 33,463.769 | 33,823.206 | 35,582.353 | 35,582.100 | 34,503.040 | 34,902.238 | 35,222.190 | 35,382.294 | 35,742.41 |
| CT | 600 | 600 | 600 | 600 | 600 | 600 | 600 | 600 | 600 | |
| FR | 2.64 | 3.2 | 6 | 5.84 | 4.4 | 5.28 | 5.44 | 5.6 | 6.6 | |
| 700 | AEC | 40,708.515 | 42,456.769 | 43,056.960 | 42,177.787 | 41,258.883 | 42,137.964 | 41,178.870 | 41,858.179 | 42,178.17 |
| CT | 700 | 700 | 700 | 700 | 700 | 700 | 700 | 700 | 700 | |
| FR | 3.70 | 5.08 | 6.12 | 5.88 | 4.48 | 5.16 | 4.28 | 4.64 | 5.24 | |
- Note: Bold values represent the best and most competitive results.
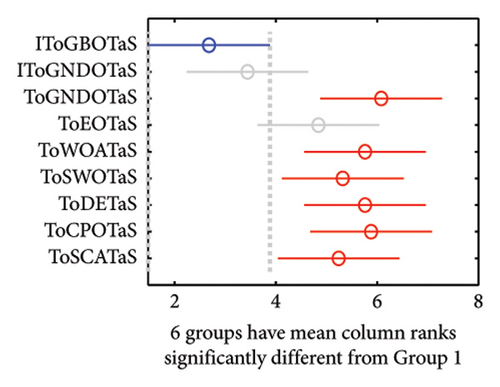
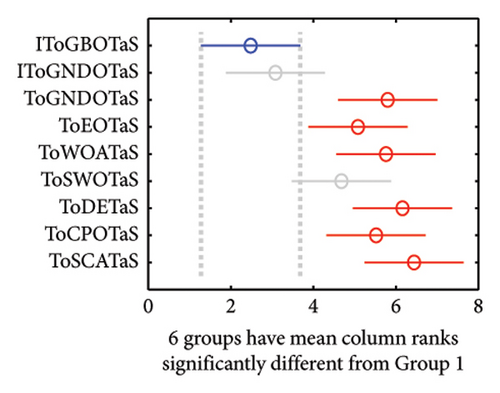
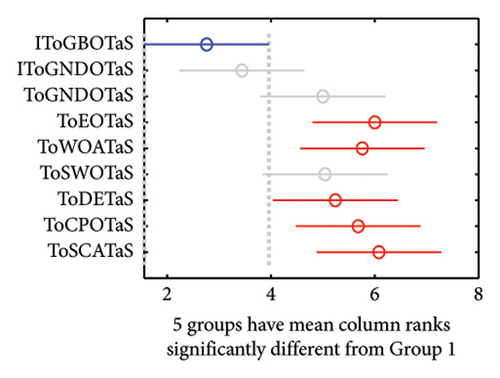
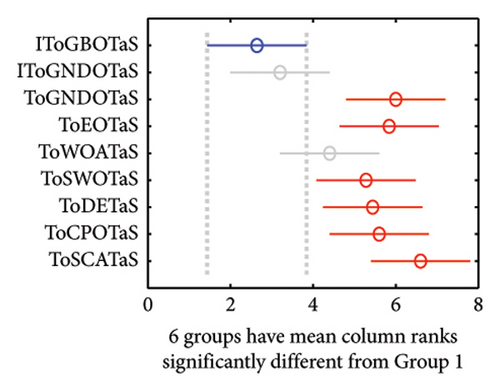
In addition, the WRS test and the multiple comparison test are used to show the difference between the outcomes of IToGBOTaS and those of the other algorithms. Table 5 shows the results of the WRS test, which reveals that IToGBOTaS is significantly different from all compared algorithms, with the exception of IToGNDOTaS, which could achieve outcomes slightly comparable to IToGBOTaS. Figure 9 shows the results of the multiple comparison test for some instances. This figure illustrates that the means of IToGBOTaS are significantly different from all algorithms except for IToGNDOTaS.
| 100 | 200 | 300 | 400 | 500 | 600 | 700 | |
|---|---|---|---|---|---|---|---|
| IToGNDOTaS | 3.22E − 01 | 2.14E − 01 | 5.35E − 01 | 6.14E − 01 | 9.91E − 02 | 1.30E − 01 | 1.21E − 01 |
| ToGNDOTaS | 2.66E − 06 | 2.20E − 06 | 1.13E − 04 | 1.67E − 04 | 1.28E − 03 | 1.43E − 04 | 3.19E − 03 |
| ToEOTaS | 2.65E − 04 | 1.97E − 05 | 8.32E − 03 | 7.35E − 04 | 1.81E − 04 | 1.43E − 04 | 3.61E − 02 |
| ToWOATaS | 1.38E − 05 | 3.90E − 05 | 1.95E − 04 | 2.09E − 02 | 3.02E − 05 | 5.53E − 03 | 1.94E − 02 |
| ToSWOTaS | 6.42E − 05 | 1.55E − 04 | 5.94E − 04 | 6.85E − 04 | 4.13E − 04 | 5.14E − 04 | 4.16E − 02 |
| ToDETaS | 2.00E − 06 | 6.75E − 06 | 1.43E − 04 | 1.53E − 02 | 4.45E − 04 | 3.57E − 04 | 4.48E − 02 |
| ToCPOTaS | 8.10E − 06 | 3.53E − 06 | 9.72E − 04 | 4.24E − 05 | 5.44E − 05 | 1.81E − 04 | 3.82E − 02 |
| ToSCATaS | 2.32E − 03 | 2.00E − 06 | 3.57E − 04 | 6.85E − 04 | 7.39E − 06 | 3.02E − 05 | 2.78E − 02 |
- Note: Bold text highlights the p value less than 0.05, indicating the number of cases in which the proposed IToGBOTaS could produce different outcomes significantly.
7.3. Comparison With Six Rival Optimizers Under Improved Upper Layer Optimization
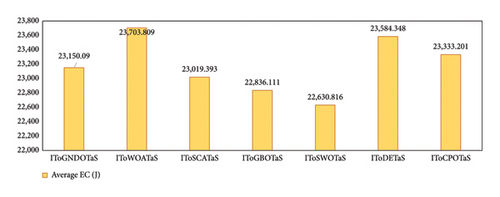
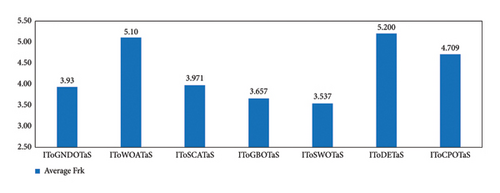
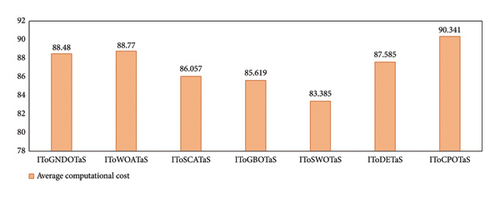
This section gives the findings of a thorough comparison between the proposed algorithms and six competing optimizers based on the improved upper layer optimization. Each algorithm is conducted 25 times independently on each instance, and the results are displayed in Table 6 as AEC, CR, and Frk. This table shows that all algorithms can complete all mobile tasks. However, IToSWOTaS surpasses all algorithms in terms of AEC for four of the seven mobile tasks, IToGBOTaS could outperform in two instances (200 and 700), and IToGNDOTaS could outperform in only one instance. To help comprehend the results in this table easily, Figure 10 is presented to show the average AEC obtained by each approach on all observed instances. This figure reveals that IToSWOTaS is the best with an average value of 22,630, IToGBOTaS is the second best with a value of 22,860, and ToWOATaS is the worst with a value of 23,703. Furthermore, Figure 11 shows that IToSWOTaS is the best-performing algorithm since it can reach a better value for the Frk measure. To demonstrate each algorithm’s efficiency, the average computational cost on the observed instances is computed and reported in Figure 12, which demonstrates that IToSWOTaS and IToGBOTaS outperform all compared algorithms somewhat.
| m | IToGNDOTaS | IToWOATaS | IToSCATaS | IToEOTaS | IToGBOTaS | IToSWOTaS | IToDETaS | IToCPOTaS | |
|---|---|---|---|---|---|---|---|---|---|
| 100 | AEC | 5507.138 | 5427.318 | 5507.157 | 6146.903 | 5706.954 | 5427.251 | 5577.123 | 5587.143 |
| CT | 100 | 100 | 100 | 100 | 100 | 100 | 100 | 100 | |
| FR | 3.68 | 4.72 | 3.96 | 6.36 | 3.88 | 3.48 | 6 | 3.92 | |
| 200 | AEC | 11,618.793 | 11,858.712 | 11,658.982 | — | 11,538.914 | 11,738.790 | 11,698.913 | 11,978.589 |
| CT | 200 | 200 | 200 | 199.88 | 200 | 200 | 200 | 200 | |
| FR | 3.88 | 5.16 | 4.12 | 5.48 | 3.36 | 4.12 | 4.88 | 5 | |
| 300 | AEC | 17,340.200 | 18,059.472 | 17,580.117 | — | 17,739.431 | 17,499.963 | 17,900.035 | 18,259.288 |
| CT | 300 | 300 | 300 | 299.96 | 300 | 300 | 300 | 300 | |
| FR | 3 | 4.8 | 4.12 | 5.68 | 3.72 | 3.72 | 5.24 | 5.72 | |
| 400 | AEC | 22,391.353 | 23,670.305 | 22,871.411 | — | 22,790.780 | 22,311.567 | 23,390.946 | 22,991.165 |
| CT | 400 | 400 | 400 | 399.96 | 400 | 400 | 400 | 400 | |
| FR | 3.52 | 5.4 | 4.28 | 6.44 | 3.72 | 3.48 | 4.68 | 4.68 | |
| 500 | AEC | 28,313.837 | 29,472.506 | 27,794.751 | — | 27,993.897 | 27,435.025 | 28,553.980 | 28,274.382 |
| CT | 500 | 500 | 500 | 499.92 | 500 | 500 | 500 | 500 | |
| FR | 3.84 | 5.76 | 3.72 | 5.92 | 4.04 | 3.2 | 5.16 | 4.36 | |
| 600 | AEC | 34,661.623 | 35,221.240 | 33,944.466 | 35,222.710 | 33,423.877 | 32,944.484 | 34,822.468 | 34,303.435 |
| CT | 600 | 600 | 600 | 600 | 600 | 600 | 600 | 600 | |
| FR | 5.12 | 5.16 | 3.76 | 5.00 | 3.52 | 3.08 | 5.44 | 4.92 | |
| 700 | AEC | 42,217.690 | 42,217.107 | 41,778.866 | — | 40,658.925 | 41,058.631 | 41,578.494 | 41,938.406 |
| CT | 700 | 700 | 700 | 699.96 | 700 | 700 | 700 | 700 | |
| FR | 4.68 | 4.72 | 3.84 | 6.36 | 3.36 | 3.68 | 3.75 | 4.36 | |
- Note: Bold values represent the best and most competitive results. “—” represents infeasible solutions.
7.4. Comparison Between Improved and Original Upper Layer Optimization
- •
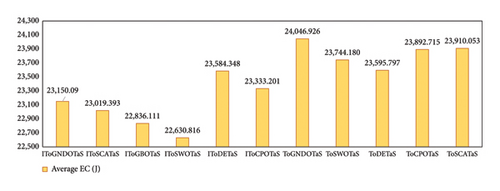
The improved upper layer optimization is better than the original one since it could improve the performance of all used metaheuristic algorithms when applied to optimize the deployment of UAVs.
- •
Also, both IToGBOTaS and IToSWOTaS are the most effective algorithms for optimizing the deployment of UAVs in the multi-UAV-enabled MEC system.
- •
ToGNDOTaS is the worst-performing algorithm.
7.5. Scalability Analysis
In this section, the proposed IToSWOTaS and IToGBOTaS are tested and evaluated using three large-scale instances with a number of mobile users equal to 1000, 1100, and 1500 to analyze their scalability. In addition, those algorithms are compared to four highly performing algorithms such as ToGBOTaS, ToSWOTaS, IToDETaS, and ToDETaS using three performance metrics (AEC, CT, and AEC) to investigate their efficiency and effectiveness. The findings of this comparison are shown in Table 7, which shows that, for 1000 and 1100 IoT devices, ITOSWOTaS is the best and is followed by ToGBOTaS as the second-best algorithm, while TOSWOTaS is the best for 1500 IoT devices and is followed by IToDETaS as the second best. In brief, the proposed IToSWOTaS outperforms for instances with a number of IoT devices smaller than or equal to 1100, and ToSWOTaS performs better for instances higher than that. Those experiments show that the performance of IToSWOTaS is gradually degraded but still better than all algorithms as the number of IoT devices increases up to 1100, which is its main limitation to be addressed in the future.
| m | IToGBOTaS | ToGBOTaS | IToSWOTaS | ToSWOTaS | IToDETaS | ToDETaS | |
|---|---|---|---|---|---|---|---|
| 1000 | AEC | 61,897.440 | 60,452.605 | 59,299.956 | 63,247.075 | 61,998.342 | 61,348.847 |
| CT | 1000 | 1000 | 1000 | 1000 | 1000 | 1000 | |
| FR | 3.50 | 3.65 | 2.65 | 4.00 | 3.65 | 3.55 | |
| 1100 | AEC | 68,736.431 | 67,691.484 | 67,089.034 | 68,338.824 | 68,937.724 | 67,989.179 |
| CT | 1100 | 1100 | 1100 | 1100 | 1100 | 1100 | |
| FR | 3.70 | 3.40 | 2.80 | 3.50 | 4.20 | 3.40 | |
| 1500 | AEC | 128,201.219 | 131,327.006 | 126,950.311 | 121,827.713 | 123,201.647 | 129,075.348 |
| CT | 1500 | 1500 | 1500 | 1500 | 1500 | 1500 | |
| FR | 3.88 | 4.88 | 3.50 | 2.25 | 3.00 | 3.50 | |
- Note: Bold values represent the best findings.
8. Managerial Implications
- •
How are the IoT tasks scheduled for multiple UAVs with the purpose of minimizing total energy consumption?
- •
Is it better to execute tasks on their own devices or submit them to the edge servers on the UAV?
Those questions needed a response to achieve two purposes: The first is to ensure that all tasks have been completed, and the second is to minimize the overall energy consumption in this system. Therefore, several algorithms, such as ToDeTaS, have been recently presented to address those issues. Those algorithms suffered from low-quality final results, so the proposed IToGBOTaS and IToSWOTaS are presented to better optimize the deployments of multiple UAVs, leading to better scheduling and low energy consumption. The better UAVs are deployed, the better IoT tasks are scheduled. Those algorithms suffered from low-quality final results, so the proposed IToGBOTaS and IToSWOTaS are presented to better optimize the deployments of multiple UAVs, leading to better scheduling and low energy consumption. The better UAVs are deployed, the better IoT tasks are scheduled. Smart agriculture, smart vehicles, smart cities, and smart pollution control are some of the most popular IoT applications in the world. For those applications supported by the multi-UAV-enabled MEC system, the proposed IToSWOTaS could be used for better deploying various UAVs and accurately scheduling the received tasks to various UAVs, thereby minimizing energy consumption and lowering response time. In brief, the better the deployment, the faster the IoT tasks are received and the lower the energy consumption. The better the scheduling of various tasks, the lower the response latency.
9. Conclusion and Future Work
Recently, an optimization technique based on two optimization layers: Upper layer optimization and lower layer optimization have been proposed for optimizing task scheduling and deployments of UAVs in the multi-UAV-assisted MEC system. The lower layer was responsible for optimizing task scheduling, while the upper layer was in charge of optimizing UAV deployment to improve mobile user coverage and task scheduling, hence reducing overall energy usage. However, the upper layer optimization needs further improvement to aid in attaining better deployments. Therefore, in this paper, this layer is improved based on two folds: The first fold is based on avoiding the random selection of the solutions to be replaced and relying on the sequential selection. This will preserve the exploration and exploitation characteristics of each individual within the whole optimization process, thereby aiding in achieving better outcomes. The second fold is adapting some of the recently published metaheuristic algorithms, such as SWO, GNDO, and GBO for optimizing the deployments of UAVs. Both improved upper layer and lower layer optimization help present new more effective optimization techniques, namely, IToGBOTaS, IToGNDOTaS, and IToSWOTaS. Those techniques are tested using nine instances with a variety of mobile tasks ranging from 100 to 1500 to determine their stability and then compared to different optimization techniques to determine their effectiveness. First, various experiments were carried out to compare IToDETaS and IToGBOTaS to the very effective method, namely, ToDETaS. This comparison used a lot of statistical information to determine the superiority and difference between their outcomes. The results of this comparison demonstrated the success of IToGBOTaS for all performance indicators across all used instances, except for one instance with 900 tasks that could be completed more efficiently by IToDETaS. Second, to demonstrate the usefulness of the proposed algorithms, they are compared to several metaheuristic algorithms that are adapted using the same two layers. The results of this comparison demonstrate that the performance of IToGBOTaS and IToSWOTaS is slightly competitive and better than all the other compared algorithms. Although these algorithms have shown superior performance for numerous IoT tasks, they still have some drawbacks that need further improvement in future work. For example, their performance is a little degraded as the number of mobile users increases. Hence, for large-scale instances, they might not be better than, but competitive with, the latest ToDETaS. Also, relying on a dual-layer framework to address both deployment optimization and task scheduling makes the proposed algorithms more complicated and hard to grasp. Therefore, our future work includes presenting an alternative to the dual-layer framework for optimizing both task scheduling and deployment optimization more simply and straightforwardly. In addition, we will adapt the metaheuristic algorithms for better scheduling IoT tasks in a reasonable amount of time. Finally, there are several other optimization problems for UAVs, such as 3-D routing planning for UAVs, UAV-assisted IoT data collection systems, and lost target search with UAVs, which we will try to solve using some of the latest metaheuristic algorithms.
Nomenclature
-
- M
-
- Number of mobile users
-
- N
-
- Number of UAVs
-
- Ti
-
- Task to be executed locally or offloaded on UAVs
-
- Ci
-
- CPU workload (i.e., the total number of CPU cycles required to complete a task)
-
- Di
-
- The task size of the ith mobile user
-
- H
-
- Altitude of UAV
-
- Q
-
- Execution pattern
-
- ai,q
-
- Computation offloaded decision
-
- fi,q
-
- Computation resources allocated
-
- (xi, yi)
-
- Mobile users’ horizontal coordinates
-
- (Xj, Yj)
-
- UAV’s location coordinates
-
-
- Distance between two UAVs
-
- di,j
-
- Distance between mobile user and UAV
-
- β0
-
- Channel power gain
-
- B
-
- Channel bandwidth
-
- N0
-
- Noise power
-
- P
-
- Transmission power
Conflicts of Interest
The authors declare no conflicts of interest.
Author Contributions
Mohamed Abdel-Basset: conceptualization, methodology, investigation, resources, supervision, visualization, writing–original draft, review, and editing.
Reda Mohamed: conceptualization, methodology, investigation, writing–original draft, review, and editing.
Amira Salam: conceptualization, methodology, writing–original draft.
Karam M. Sallam: investigation, methodology, software, validation, writing–review and editing.
Ibrahim M. Hezam: validation, investigation, resources, writing–review and editing.
Ibrahim Radwan: validation, investigation, writing–review and editing.
Funding
This research was supported by the Researchers Supporting Project (RSP2024R389), from King Saud University, Riyadh, Saudi Arabia.
Acknowledgments
We acknowledge the support provided to the project by the Researchers Supporting Project (RSP2024R389), from the King Saud University, Riyadh, Saudi Arabia.
Open Research
Data Availability Statement
The data supporting this study findings are provided within the paper. Additionally, the code can be made available upon request from the corresponding author for further reference.


