A Novel Emotion Recognition System for Human–Robot Interaction (HRI) Using Deep Ensemble Classification
Abstract
Human emotion recognition (HER) has rapidly advanced, with applications in intelligent customer service, adaptive system training, human–robot interaction (HRI), and mental health monitoring. HER’s primary goal is to accurately recognize and classify emotions from digital inputs. Emotion recognition (ER) and feature extraction have long been core elements of HER, with deep neural networks (DNNs), particularly convolutional neural networks (CNNs), playing a critical role due to their superior visual feature extraction capabilities. This study proposes improving HER by integrating EfficientNet with transfer learning (TL) to train CNNs. Initially, an efficient R-CNN accurately recognizes faces in online and offline videos. The ensemble classification model is trained by combining features from four CNN models using feature pooling. The novel VGG-19 block is used to enhance the Faster R-CNN learning block, boosting face recognition efficiency and accuracy. The model benefits from fully connected mean pooling, dense pooling, and global dropout layers, solving the evanescent gradient issue. Tested on CK+, FER-2013, and the custom novel HER dataset (HERD), the approach shows significant accuracy improvements, reaching 89.23% (CK+), 94.36% (FER-2013), and 97.01% (HERD), proving its robustness and effectiveness.
1. Introduction
In recent years, rapid technological advances have increased research in robotics, including research into humanoid robots. A humanoid robot is equipped with human body–like arms, head, etc. In general, humanoid robots can communicate with humans, such as the ability to recognize people and respond to their movements. Humanoid robots often require robots with social support. Therefore, facial recognition is the most important issue in human–computer interaction (HCI). The robot captures a person’s face through cameras fixed on eyes. Face recognition is a technology that can verify or identify a subject’s identity based on the shape of an image or video [1]. Various face recognition systems have also been developed. Face recognition was also implemented through principal component analysis (PCA). Two face recognition processes are then compared using multilayer perceptrons and radial features. Both processes use radial functions and feature plane extraction. A system has been developed to track and identify human characteristics. In their work, they used the cascade method (Viola–Jones method) and local binary pattern histogram (LBPH) for classification. However, lighting conditions were not taken into account, and the sample size was small. The authors in [2] proposed a gray median neighborhood–based (MLBPH) method to improve the performance of LBPH in terms of illumination, emotion, and pose bias. In another work [3], a support vector machine (SVM) was used for classification, PCA and linear discriminant analysis (LDA) were used for dimensionality reduction, and a genetic algorithm was used for optimal weighting of facial features. PCA is applied alone to extract grayscale images. These processes are based on the characteristics of facial data.
Therefore, feature extraction is necessary to predict the recognition success. However, the dimensionality of the original dataset can be reduced by feature extraction, which can lead to the loss of important information. Convolutional neural networks (CNNs) [4] and Deep CNN [5] are therefore some of the deep learning methods used in recent work to improve the accuracy of face recognition. Face recognition is as important for human–robot interaction (HRI) as emotion recognition (ER) such as speech, facial expressions, and text, all of which can be used to recognize emotions [6, 7]. Since facial expressions can convey a large amount of information, HCI relies on facial expressions [8]. An inaccurate method for recognizing human emotions from faces has been presented. Different SVM kernels were tested for their ability to recognize facial emotions: recognition of facial emotions using CNN–based methods and data augmentation by different data sources and recognition of affective states from the datasets using CNNs and SVMs [4].
Despite the promising progress in these approaches, the integration of emotion and face recognition systems is incomplete. This is because the two areas have been treated separately in the past and not as part of a comprehensive identification system. To improve communication between humans and robots, the combination of facial and ER is essential. Furthermore, the study does not address the need for someone to be the subject of an interaction. Only a few studies have used emotion and face recognition in real time [9].
- •
Most recognition systems use grayscale statistics, RGB histograms, geometric features, and traditional machine learning classification methods such as SVM, K-nearest neighbor (KNN), and Naive Bayes. The lack of variability in manually created features such as scale, motion, and rotation reduces their resilience. Excessive feature extraction due to the manual feature extraction method has a negative impact on both model training and validation. Most ER system research uses common feature extraction methods such as LPB, histogram of orientated gradient (HOG), and GLCM.
- •
However, these descriptors are limited in their ability to achieve higher precision due to the large number of images in the collection. Some specific attributes, such as SURF, SIFT, and ORB, refer to basic properties such as edges and corners. Image data often contain noise, blurring, excessive sharpness, and uneven contrast. The presence of noisy data can make training the model more difficult and lead to lower accuracy.
- •
Utilization of advanced CNN such as EfficientNet for transfer learning (TL) and an improved R-CNN algorithm for face recognition. Fully connected layers are used to improve model performance and accuracy.
- •
Creating complex environments with different lighting conditions and barriers facilitates the training of human emotion recognition datasets (HERDs). We are evaluating the accuracy of ER by comparing it with established models and testing the effectiveness of the proposed models on emotion datasets such as Cohn–Kanade (CK+), FER-2013, and HERD.
- •
The use of data augmentation techniques can increase the accuracy of the results.
ER can be used to enrich numerous industries, such as diagnostics in healthcare, behavioral intent recognition in security protocols, and adaptive learning systems in education. These interdisciplinary connections emphasize the importance of a comprehensive framework for ER in HCI contexts, where empathy and thus effective communication play a central role. The proposed ensemble model can not only help overcome many challenges in ER but also shows the possibility of further improvements in dealing with optimizing computer performance and increasing ensemble diversity in different HRI scenarios.
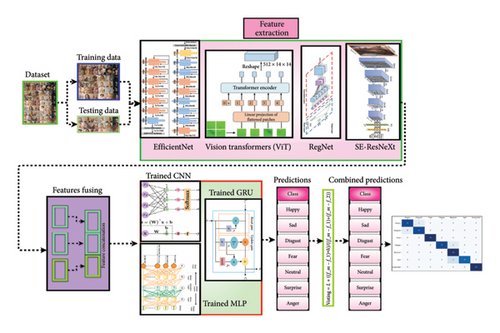
Our deep ensemble classification model utilizes state-of-the-art models such as EfficientNet, ViTs, RegNet, and SE-ResNeXt to improve real-time feature extraction, accuracy, and ease of use. We also highlight the improvement in face recognition performance and the creation of a more powerful and efficient human emotion recognition (HER) by integrating the faster and more advanced R-CNN with VGG-19. In addition, we also use custom-built datasets (HERD) to overcome practical challenges such as illumination changes, occlusions, and different lighting conditions.
2. Related Work
This overview presents the four main steps in the classification of facial expressions’ recognition, expression detection, feature extraction, face registration, and face recognition. Expression recognition and feature extraction can be performed simultaneously in many models.
Face authentication in the image is performed by identifying other human faces based on the edges of the eyes, mouth, lips nose, etc. The AdaBoost cascade classifier, a Haar-like classifier that uses feature extraction technology, is a classical method that has been presented previously [10]. SVM and gradient histograms are generally combined. In solving the problem of behavior change, researchers use large amounts of data to train CNN–based classifiers. However, the image processing time is much longer [11]. In face registration, the original face is mapped to the corresponding position of the key points via a matrix transformation. Many studies have shown that postrecognition face registration significantly improves the accuracy of FER. Feature extraction is a very effective technique that can lay the foundation for future FER. Two main methods can be used for the classification of predefined features and prelearnt features. The predefined features are the starting point. The manual creation of operators and the acquisition of the corresponding data require prior knowledge. This subcategory includes geometric and esthetic features [12]. The PHOG feature is better than the HOG feature. It provides superior antinoise capabilities and certain antirotation capabilities by statistically analyzing the gradient histograms of edge image directions at different levels. However, this approach is sensitive to stacking constraints and is not scalable. Local texture information is described in the work of [13] using the excellent boosted LBP function, which provides excellent discriminative power for lower-resolution data. However, this method is difficult to apply to multiple datasets. Gabor filter extraction is limited by the complexity of operations, including modulation of the Gaussian kernel function and similar processes. This technique considers the properties of Gabor wavelets to handle texture and discriminative features and also takes into account the invariance of pose and illumination [14].
In addition to neutral emotions, five main emotions, surprise, happiness, fear, hate, and sadness, were identified in [15]. Based on this idea, the facial action coding system (FACS) [16] is currently the industry standard in ER research. Therefore, neutrality is usually considered the eighth core emotion in HER datasets. Two benchmark datasets, FER-2013 [17] and CK+ [18], provide examples of images with different emotions (Figures 3 and 4). The following faces represent the main emotions: happy, angry, disgusted, fearful, sad, surprised, and patronizing. In the first ER study, a two-stage machine learning approach was used. In the second stage, a classifier is used to identify emotions, while in the first stage, features are extracted from images. Many different manual features are used for FE extraction. The examples include Gabor wavelets [22], Haar features [23], texture-based features [24], LBP [25], and edge histogram descriptors [16]. The classifier then determines which image evokes the most appropriate emotion. These methods seem to work particularly well with specialized datasets. However, complex datasets with large differences within a class are a major obstacle for these methods. Many organizations have achieved remarkable results using neural networks, deep learning techniques, and image categorization, overcoming visual challenges. According to the authors in [26], CNN has shown superior accuracy in recognizing emotions. Khorrami achieved exceptional results by implementing the CNN target Toronto face datasets (TFDs) and CK+ into the HER model, resulting in peak performance. The researchers [27] used deep learning techniques to train a neural network in their study. They then used this network to convert human photos into animated FE to create a functional model for stylized animated creatures. The authors in [28] proposed a FER neural network with four output layers or subnets, two convolutional layers, and an upper clustering layer. The authors of [29] emphasize the importance of feature elimination and categorization, which they perform with a single recurrent network, using the BDBN network to achieve the highest accuracy for CK+ and FER-2013. To increase the accuracy of the initial categorization of collective, collaborative images, the authors of [30] used Deep CNN. To achieve the required accuracy, they used 10 labels to reconstruct each image, utilizing the 10 labels in the dataset and the different cost functions for DCNN. To improve the accuracy of spontaneous face recognition, the authors [31] used a larger number of discriminative neurons, outperforming IB-CNN.


Recently, scientists have proposed numerous approaches for ER. A standard method starts with facial feature extraction, then moves to ER, and finally to emotion classification. On the other hand, the current system performs FER tasks. Deep learning models combine these two steps into a seamless computational process. An impressive advance in artificial intelligence (AI) is the introduction of automated HER. One of the most challenging problems in this area is ML. HER can be implemented using traditional methods, such as neural networks and KNN, from the beginning of our life. We use wavelet energy features (WEFs) and Fisher’s linear discriminant (FLD) for feature extraction. For the emotion category classification, we use the Artificial Neural Networks’ (ANNs) approach [32]. Linear programming (LP) techniques were used to classify emotions after analyzing histograms of LBP in images taken at different locations [33]. The contourlet transform (CT), a 2D wavelet transform, has been improved. Boosting methods are used for sentiment classification and image data mining [34]. Many models use SVM to classify sentiment. We use different approaches to identify the unique features. In [35], researchers compared Gabor with SVM and other methods. Two approaches were performed: Haar and LBP. A few years ago, scientists discovered several taxonomies [36]. Various logistic regression and LDA methods, including KNN, Naive Bayes, SVM, and classification regression trees, are proposed for feature extraction based on geometry [37]. Various CNN models have been documented in the existing literature. DL in ML represents a new method for hierarchical event representation. In [19], a network called a universal visual–modified attention network was presented. The DBN neural network is responsible for emotion categorization and feature extraction. In studying facial expression images obtained for FER, some models initially used the conventional CNN architecture, which consists of two convolutional layers [38]. The proposed model consisted of four output layers and two convolutional pooling layers [39]. The authors in [40] built a total of 72 CNNs. CNNs were trained with different filter widths and different numbers of fully connected neuron layers. The model also used a collection of one hundred CNNs. Previous models were based on a given number of CNNs [41]. Using the FER dataset as a benchmark, the deep learning model based on CNN achieves the highest accuracy. The approach recommended aims for higher identification rates of a deployable, scalable deployment framework allows real applications to build up their identification of counterfeits [42]. Training large neural models such as DCNN is difficult due to the many network parameters involved. It is well known that training a large network requires a considerable amount of data due to the large number of parameters involved. Avoiding overfitting is impossible if the training data are insufficient or of poor quality. Research shows that overfitting is a difficult task. A single example sentence is sufficient to train a DCNN. TL is viable when large datasets are missing [43]. TL undoubtedly refers to the process of acquiring knowledge from multiple tasks that have a common application. Although human emotions have been explored in the context of HRI, this remains a significant challenge. In this section, we report on recent research on HRI and FER systems.
2.1. Emotion Detection for HRI
In the field of social robotics, robots can communicate naturally and achieve peaceful interactions as they can simulate the ability to recognize human emotions. The use of emoticons has also been the subject of several articles. For example, in the paper [44], data from FER-2013, FERPLUS, and FERFIN were used to develop the ability to recognize facial expressions. This technology enables NAO robots to recognize and respond to emotions. However, this work also has its limitations, as the functioning of robots has not been studied in depth. The research also includes the integration of systems for recognizing emotions and facial expressions in robots. It has also been tested whether it is possible to adjust the distance between robots and humans independently of each other. Immobility is the weak point of the robot, as it cannot move. This study provides an overview of previous work on recognizing emotions and expanding knowledge of HRI. This study discusses models, datasets, and methods for recognizing emotions, with a focus on human face ER. However, using deep learning algorithms for facial ER has not been reported.
2.2. Human Facial ER
Deep learning has also revolutionized computer vision tasks, including FER. Several articles present different methods that can achieve high classification efficiency using standard benchmarks [44, 45]. Many of the new articles present innovative FER methods. A deep attention center loss (DACL) method is proposed, which uses an attention mechanism to improve feature separation and shows high performance with the RAF-DB and AffectNet benchmarks. Following the same trend, the authors in [20] introduced an architecture called LHC-Net, which uses multiheaded self-attention blocks specifically for FER tasks and reported that it achieves the best performance to date with the FER-2013 dataset while reducing complexity. Another study [46] introduced the MobileNet V1 three-structured network model, which includes diversity functions between and within classes, and achieved good performance with the KDEF, MMI, and CK+ databases. An adaptive correlation (Ad-Corre) loss was introduced in [47], and when implemented with the Xception and ResNet50 models, the model performance was better than the AffectNet, RAF-DB, and FER-2013 databases. Other notable models include the segmented VGG-19 model, where FER-2013 was developed using segmentation-inspired blocks, and the DDAMFN network, where bidirectional attention with AffectNet and FERPlus performed well. Finally, more recent work has achieved state-of-the-art performance on the FER-2013 dataset. EmoNeXt uses a spatial transformation network (STN) to deal with the variance in face orientation and a compression and excitation module to recalibrate channel features [48]. To improve compact properties and increase accuracy, the use of self-attention regularization terms was also introduced. Increasing safety and comfort in intelligent vehicles procured wide attention from industry [49], pedestrians’ top–down attention in traffic environments, with the goal of improving traffic safety [50]. As smooth and accurate automatic steering control is one of the most challenging [51], insufficient, and irrelevant information interaction [52, 53], cognitive intelligence-enabled framework was proposed [54].
This brief review, in Table 1, shows that many FER models have focused exclusively on improving accuracy. As a result, researchers are currently focusing on improving the performance of CNN models. They do this by recording emotional expressions in real time and using ER datasets of real images trained in a controlled laboratory environment. To achieve effective emotion classification and feature extraction from images, it is necessary to use a robust model that combines deep learning fusion technology. Therefore, we propose a powerful ensemble classification technique for predicting emotions during HRI by using various deep learning models to improve efficiency, effectiveness, and real-time capability. Techniques include CNNs, RNNs, and multilayer perception (MLP) classifiers, which are used to build improved FER systems. One contribution is a Faster R-CNN that uses VGG-19 learning blocks to improve the balance between face recognition accuracy and computational efficiency. To further improve the recognition capability, feature fusion technology is used to combine multiple CNN features, and the features learned by the integrated classification technology are used to improve the classification results. The system is comprehensively evaluated on benchmark data (CK+, FER-2013) and achieves high accuracy on a custom-developed dataset. In addition to accuracy, this work also emphasizes real-world applicability by experimenting with the model in various environmental scenarios, such as light changes and occlusions, to achieve robust interaction capabilities. This study uses humanoid robots as an interactive platform for verification. Experiments demonstrated high accuracy and ability to respond quickly to different expression classifications. By incorporating emotional understanding into HRI, this work enables humanoid robots to recognize human emotions more accurately, allowing for more intuitive and compassionate interactions. This breakthrough has profound implications for assistive robots, autonomous systems, and cognitive HRI, where real-time ER is critical for adaptive, contextualized interactions.
| Classification and ref | Datasets | Emotions | Fusion technique | Feature extraction | Evolution metric | Obtained accuracy |
|---|---|---|---|---|---|---|
| DL–based [55] | AffectNet | Angry, sad, happy, arousal, neutral, valence | Modality-adaptive fusion | Adversarial learning, plain regression task, extraction from a speech signal | Pseudolabels | 33% using only external signals |
| Multimodal neural network [56] | M-LFW-FER CREMA-D | Neutral, negative, positive | Multimodal neural network using fusion | DL–based methodology | Experimental evaluations | 79.81% |
| CNN [57] | Generated by an emotive device | Sad, happy, neutral | Integration of multichannel information | PCA and gray wolf optimization algorithm | ACC, confusion matrix | 94.44% |
| Linear classifier (shared) [58] | IEMOCAP, MOSEI |
|
Contextualized GNN–based multimodal emotion recognition (COGMEN) | Graph neural network (GNN) architecture | ACC, F1 | COGMEN outperforms 7.7% F1 increase for IEMOCAP |
| Reinforcement learning framework [59] | MELD |
|
Concatenation operation | GRU cells for extracting global contextual information | W-average comparison | 60.2% |
| Gated recurrent units (GRUs) [60] | IEMOCAP |
|
Cross-model attention fusion module | Unimodal feature extraction | ACC, F1 | 65% F1 64 |
| Gaussian classifier [61] | SAVEE |
|
Feature level, decision level | Pitch, energy, duration, MFCC, visual features (2D marker coordinates) | Average classification accuracy | Comparable to human performance |
| Continuous real value estimation [62] | AVEC 2012 | V, A, power expectancy | Temporal Bayesian | OpenSMILE, lexical, LBP | Cross-validation | 96% |
3. The Proposed Methodology
The ensemble learning method is used in the proposed framework for HRI for HER. The approach combines the best features of four major CNN models: EfficientNet, ViTs, RegNet, and SE-ResNeXt. This architecture, in Figure 2, shows that the process begins by splitting the dataset into training and test data. Each CNN model extracts high-dimensional features from these images. EfficientNet uses a balanced scaling method to maximize accuracy with fewer parameters. ViT processes images in sequences of patches, effectively capturing the overall context. RegNet offers a scalable conventional architecture that balances complexity and performance, while SE-ResNeXt improves feature representation by recalibrating at the channel level. EfficientNet uses a composite scaling method to efficiently balance depth, width, and resolution and achieve higher accuracy with fewer parameters. EfficientNet has an optimized design, and in the proposed model, it acts as a feature extractor that generates robust feature maps. In this way, the ensemble guarantees computational efficiency and improves the overall accuracy of the ensemble in ER tasks. Then, these extracted features will be merged to create a comprehensive feature vector that captures the different aspects of ER. This feature vector is fed into several classifiers, such as CNN, GRU, and MLP. GRU processes are known for their efficiency in processing longer sequences as they require less memory than LSTM and contain vectors and CNN and MLP classifiers. A powerful tuning mechanism then combines the predictions of each classifier to determine the final emotion category. The framework’s flexibility allows the integration of multiple base classifiers trained on similar or different feature sets and enables hierarchical ensembles that improve robustness and accuracy. Benchmark datasets such as CK+, FER-2013, and custom-created novel HERD validate the system. Each model is trained and evaluated individually, using different validation and test datasets for parameter tuning and performance evaluation to ensure the reliability and efficiency of the proposed system.
- i.
Data preparation
- •
Load and split the datasets into training and testing sets
- •
- ii.
Model building
- •
EfficientNet, ViT, RegNet, and SE-ResNeXt for feature extraction
- •
CNN, GRU, and MLP for combined predictions
- •
- iii.
Model training
- •
Train each feature extraction model (EfficientNet, ViT, RegNet, and SE-ResNeXt)
- •
Extract features and fuse them
- •
Train CNN, GRU, and MLP on fused features
- •
- iv.
Combined predictions
- •
Apply a voting mechanism to combine CNN, GRU, and MLP predictions
- •
- v.
Evaluation
- •
Plot training and validation accuracy/los
- •
Plot confusion matrix and receiver operating characteristic (ROC) curves for combined predictions
- •
- 1
Methods for extracting multiple features
- •
The system uses EfficientNet, ViT, RegNet, and SE-ResNeXt as feature extractors to fully utilize their unique advantages. EfficientNet achieves this by intelligently scaling depth, width, and resolution to extract features with just a few parameters. ViT is crucial for complex ER tasks as it captures global visual dependencies. RegNet is very flexible and can be configured for a variety of computational tasks. SE-ResNeXt recalibrates the features at the channel level so that the model can focus on the areas with the most information, such as the cheekbones and eyes.
- •
- 2
Cooperative learning skills
- •
The feature vectors extracted from these models are used as input to the ensemble model, which consists of a CNN, a GRU, and a MLP classifier. CNNs are very effective in recognizing spatial patterns. Constant changes in the video data do not easily affect the system as the GRU creates temporary dependencies. Nonlinear decision boundaries achieved with MLP improve classification accuracy. The final result utilizes a voting process to strengthen the collective performance of all classifiers.
- •
- 3
Adaptability and flexibility
- •
The modular architecture allows easy integration of new or replaced base classifiers. Hierarchical ensembles, enabled in each hierarchy of the framework, allow the creation of multilayered ensembles by combining and merging base classifiers at different levels of granularity.
- •
- 4
Pragmatic adaptability of registrations
- •
To adapt to different HRI scenarios, the system builds ensembles from internally developed datasets (e.g., HERD) and domain-specific datasets (e.g., CK+ and FER-2013).
- •
3.1. Evolution of Region-Based CNNs for Face Detection
The field of face recognition has evolved considerably with the development of R-CNNs, which are a central component of the research to be present. The R-CNN model for face recognition consists of two main steps. First, the selective search generates category-independent face suggestions. Then, each proposition is cast to a fixed size (e.g 227 × 227) and mapped to a 4096-dimensional feature vector. Then, we pass this vector to a classifier and regressor to refine the recognition locations.
The introduction of R-CNN ensures the high accuracy of CNN in classification tasks for ER, mainly by transferring the supervised, pretrained image representation from image classification to object recognition. R-CNN and its successors Fast R-CNN and SPPNet are based on generic object proposals typically generated from selective queries or hand-crafted models such as EdgeBox. However, deep-learned representations are often more generalizable than hand-crafted representations, and the computational cost of generating suggestions can dominate the processing time of the entire pipeline. Despite the development of deep-trained models such as DeepBox in Figure 5, their processing time is still not negligible.
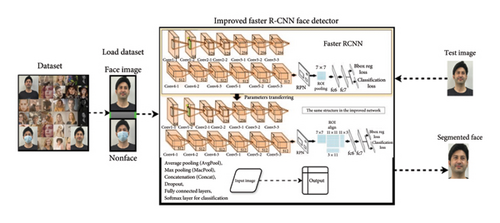
This section analyzes and compares several region-based object recognition systems, focusing on their methods and processing times. Our analysis focuses on three specific models: R-CNN, Fast R-CNN, and Faster R-CNN. Each technology has different processing times during the proposal phase. The combination of R-CNN and EdgeBox resulted in a proposal time of 2.73 s. However, the inclusion of faceness in the EdgeBox significantly increases sentence time to 12.64 s. This includes 9.91 s for faceness and an additional 2.73 s for EdgeBox. The combination of DeepBox and EdgeBox reduces the length to 3.00 s, compared to 0.27 s for DeepBox alone and 2.73 s for EdgeBox alone.
As CNN’s performance improves, it acquires new data from each technique. R-CNN uses cropped sentence images, while Fast R-CNN and Faster R-CNN use the input images and sentences directly. The length of the individual sentences and the number of iterations of the CNN vary. R-CNN takes 14.08 s for this phase, Fast R-CNN takes about 0.21 s, and Faster R-CNN takes about 0.06 s. The total duration (including the suggestion and refinement phases) for R-CNN and EdgeBox is 14.81 s. Fast R-CNN with EdgeBox reduces the time to 2.94 s, but Faster R-CNN achieves the shortest time at 0.38 s. In addition, using Fast R-CNN and faceness takes only 12.85 s, while using R-CNN and faceness takes 26.72 s. The combined runtime of Fast R-CNN and DeepBox is 3.21 s, while R-CNN integrated with DeepBox takes 17.08 s. These comparisons show that the object recognition system is significantly more efficient. Using DeepBox and Faster R-CNN instead of R-CNN can significantly reduce processing time and improve performance.
3.1.1. Hybrid Feature Fusion Approach
To improve the proposed ensemble HER, we propose a hybrid feature fusion that combines traditional feature extraction with deep learning–driven representation. FER has long relied on traditional hand-crafted features such as PCA, HOGs, and local binary models (LBP). However, illumination changes, occlusion, and feature constancy are not uncommon. However, deep learning models such as EfficientNet, ViTs, RegNet, and SE-ResNeXt use learned hierarchical feature representations to improve their generality and accuracy. However, these algorithms are very computationally intensive and require large datasets.
- •
The replacement of Faster R-CNN’s standard learning module with VGG-19 reduces computational costs while increasing the accuracy of the face recognition module, improving the overall performance of Faster R-CNN.
- •
The functionality has been modified to provide additional information. Deep features are extracted simultaneously with LBP and HOG features to capture edge-based information and local texture changes.
- •
In the deep learning feature extraction technology, four state-of-the-art models, namely, EfficientNet, ViT, RegNet, and SE-ResNeXt, are used to obtain a high-dimensional deep learning feature representation.
- •
The final ensemble classification with feature fusion is to feed the deep learning feature vectors as well as the manually designed feature vectors into the ensemble classifier (CNN + GRU + MLP).
This hybrid approach to feature fusion combines the generality of deep learning models with the robustness of the system to changes in illumination, face position, and occlusion.
3.2. The Faster R-CNN
Faster R-CNN was developed to reduce the computational cost of creating proposals. The model contains two modules: RPN and Fast R-CNN detector [49]. The Fast R-CNN detector refines the object proposals generated by the RPN, a fully convolutional network (ConvNet). Sharing convolutional layers between the RPN and Fast R-CNN detectors down to their respective fully connected layers is an important innovation that allows images to pass through the CNN only once to generate and refine proposals. This sharing of convolutional layers reduces the overall computational effort and enables the use of deeper networks.
- 1.
Anchor generation: The number of anchors generated by the RPN is given by [30] in equation (1)
() - •
where W and H are the width and height of the feature map, and k is the number of anchors per location.
- 2.
Bounding box regression: The goal of bounding box regression in equation (2) is to learn the transformation parameters that map the anchor box coordinates to the ground-truth box coordinates. The transformation can be formulated as
() - •
where x, y, w, and h are the coordinates and dimensions of the ground-truth box, and Xa, Ya, Wa, and Ha are the coordinates and dimensions of the anchor box.
- 3.
Loss function: The multitask loss function in equation (3) used for training Faster R-CNN is a combination of classification loss and regression loss.
() - •
where as pi is the predicted probability of anchor i being an object, , ti are the predicted coordinates, , Lcls is the classification loss (e.g., softmax loss), Lreg is the regression loss (e.g., smooth L1 loss), Ncls and Nreg are normalization terms, and ⋋is a balancing parameter
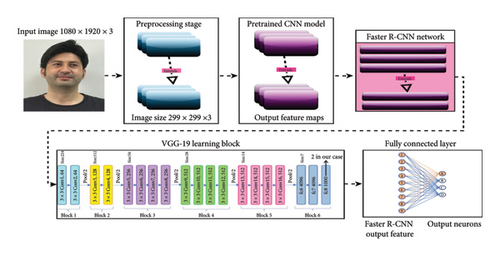
The training of the RPN includes a continuous stochastic gradient descent (SGD) of the classification and regression branches. The system must be learned jointly since the RPN and Fast R-CNN modules have common convolutional layers. The input of Fast R-CNN depends on the output of RPN and considers the derivation of the RoI pooling layer in Fast R-CNN concerning the proposal coordinates predicted by RPN for optimization. HERD indicates the execution time of the different modules, datasets, where the typical resolution of the images is about 350 × 450. Our implementation runs on a server with a 2.60 GHz Intel Xeon E5-2697 CPU and an NVIDIA Tesla K40c GPU with 12 GB memory. This configuration shows that Faster R-CNN significantly reduces execution time compared to traditional R-CNN and Fast R-CNN models, making it suitable for real-time ER in human–machine interaction. By leveraging advances in Faster R-CNN, our system provides a powerful and efficient solution for ER, which is essential for improving HCI.
3.3. Data Augmentation
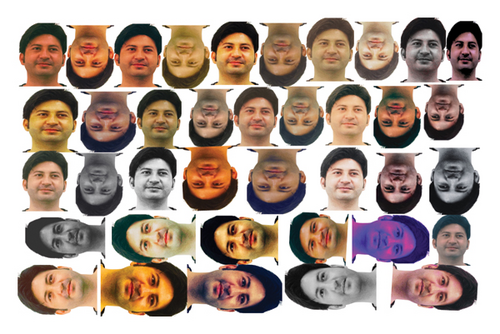
In computer vision, data augmentation utilizes various methods to enhance and extend existing datasets [50]. This process involves organizing and analyzing a dataset to create additional images and is particularly useful when the original dataset has a limited size. Image processing technology converts a single image into multiple operations, increasing the amount and variety of image data. These techniques include changing RGB colors, applying affine transformations, shifting, rotating, adjusting contrast, adding or removing noise, changing saturation, sharpening, flipping, cropping, and scaling, as shown in Figure 7. These methods are essential for improving image performance. Computer vision and deep learning models to ensure their robustness and effectiveness in different scenarios.
3.4. TL for ER in HRI
In HRI, TL techniques are used to improve the performance of deep learning models, especially in one-to-many classification tasks. Now, TL is applied to ER, previously used for object recognition tasks in computer vision, including image and speech recognition. This method analyses and evaluates dynamic images within the detector by combining test data and augmented data for a comprehensive evaluation. By using models previously trained on large benchmark datasets, TL allows new models to utilize prior knowledge without being trained on large new datasets. This significantly reduces the computational effort as the model can achieve high accuracy with fewer revolutions. TL is a viable approach for building reliable ER systems in HRI that can effectively adapt to new tasks with minimal relearning effort. This method ensures accurate and reliable recognition of emotions in various human–machine interaction scenarios while speeding up the training process and improving the model’s generalization ability across different datasets. As shown in Figure 8, the TL process consists of several important steps. First, we refine a pre-rained model on various datasets to meet the specific requirements of the ER task. This refinement process involves adjusting the model parameters to capture the new data’s nuances better. Then, the refined model is trained on the target dataset, often using augmented data to improve its robustness and generalization capabilities. This method reduces computational effort, speeds up the training process, and ensures that the model can recognize human emotions accurately and reliably in different interaction scenarios. By effectively transferring and adapting existing knowledge, TL facilitates the efficient development of complex ER systems and makes them more practical and effective for real-world HRI applications.
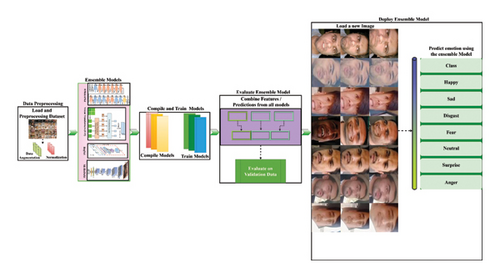
A TL describing HER in the context of HRI is shown in Figure 8. First, a dataset of facial images is loaded and prepared, each representing a different HE. This is the data preparation phase of the process. In this phase, data augmentation techniques are used to enlarge the dataset, and normalization is performed artificially to ensure the consistency of pixel values. In this way, the dataset is prepared for efficient model training. Essentially, this approach involves creating high-level models, each bringing something special. There are four powerful models in this group such as EfficientNet, which is scalable and accurate; ViTs, which uses transformers to capture long-range image dependencies; RegNet, which is optimized for performance and efficiency in image classification tasks; and SE -ResNeXt, which combines compression and excitation networks with the ResNeXt architecture.
Then, these pretrained models will be refined for recognizing emotions through TL. Model selection is followed by the compilation and training phase. To carefully build each model using loss functions, optimizations, and custom statistics before training on preprocessed datasets, this training is an essential skill in HRI and improves a model’s ability to recognize subtle ER. A validation dataset will be used to test the model’s performance and combine the overall predictions as part of the evaluation process. By combining both sets of results, we can be confident that the model can reliably predict HE to new images of themselves. Once the validation process is complete, we can deploy the model. Since the integrated model can now predict HE based on new facial images, the robot can understand and react to HE. Ultimately, this model should be preserved for the future so that many HRI applications can benefit from its enhanced ER capabilities. This technology improves robots’ understanding and empathy for humans by adapting interactions to specific situations and making technology more responsive and human-like.
3.4.1. TL in Pretrained CNNs
3.4.1.1. EfficientNet Architecture
Reusing previously trained models to solve new problems or TL content has many important benefits, including shortening training time, improving neural network performance, and reducing data consumption. Improved pretrained models such as EfficientNet with fully linked layers such as global average pooling layers, exclusion, and dense layers improve ER performance. The work of Mahendran [37] emphasizes how TL works in deep neural networks (DNNs) such as CNNs. Visualization approaches show that later layers of the CNN recognize more complex elements, such as texture and shape, while early layers of the CNN capture the basic features of the input image. Transition learning is particularly useful for ER because it does not require layer-specific feature extraction, which is difficult when training a DCNN from scratch. Transition learning is successfully performed on ER tasks by tuning the model and using pretrained weights.
The ideal values of A, B and Γ are 1.2, 1.1 and 1.15, respectively, and equation (5) shows the ideal values of these variables. By changing the value of ϕ, we can extend the version of EfficientNet with equation (4) from B1 to B7. The root, block, and header modules of the EfficientNet B0 base architecture must be used for feature extraction.
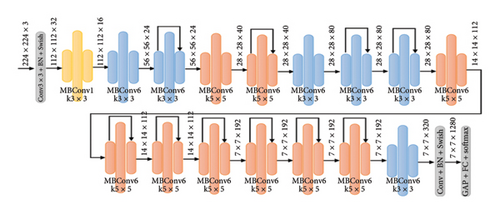
The Stem module contains convolutional layers (kernel size 3 × 3), batch normalization layers, and swish activation functions integrated into the first processing stage. The block module contains several moving inverse bottleneck convolutions (MBConvs), namely, MBConv1 and MBConv6, which differ depending on the expansion rate. These MBConv layers are crucial for capturing complex functions in different phases of the network.
The block module of the EfficientNet architecture for HRI consists of 16 layers, each with a different configuration of the MBConv. Specifically, these layers are MBConv1 with twice-repeated 3 × 3 cores, MBConv6 with twice-repeated 3 × 3 cores, MBConv6 with twice-repeated 5 × 5 cores, MBConv6 with three times-repeated 3 × 3 cores, and MBConv6 with three times-repeated 3 × 3 cores. MBConv6 with 5 × 5 cores was repeated three times, MBConv6 with 5 × 5 cores was repeated four times, and MBConv6 with 3 × 3 cores was repeated.
Convolutional layers, batch normalization, swish activation, pooling, dropout, and fully concatenated layers are all integrated into EfficientNet’s core module to improve performance. This layered structure optimizes feature extraction and processing and ensures efficient and accurate HRI.
In [30], the authors show the detailed architecture of the EfficientNet CNN model. The difference between the MBConv6 level with 5 × 5 cores and the MBConv6 level with 3 × 3 cores is remarkable. Compared to MBConv6 with a 3 × 3 kernel, MBConv6 with a 5 × 5 kernel is applied to a larger kernel size, allowing the model to capture different levels of spatial features. This change in kernel size is important to improve the model’s ability to find and process complex patterns in the data. As a result, EfficientNet architecture provides better performance on tasks involving humans and robots. Since the scaling of the model does not affect the underlying operator levels in the underlying network, it is important to have a strong network in the HRI domain. We will use an existing ConvNet to test our scaling technique. The mobile core network, EfficientNet, is now being developed to demonstrate the strategy’s effectiveness. After reading [31], we developed our base network and investigated the multiobjective neural architecture to achieve the best possible results regarding precision and floating-point operations per second (FLOPS). The problem space should be the same as in [31], and the optimization objective should be defined as ACC (m) × [FLOPS(m) = T]wt. Here, ACC (m) and FLOPS(m) Stand for the accuracy and FLOPS of model m, respectively, and for FLOPS and speed.
In model m, T represents the target FLOPS, as w equals −0. Hyperparameter 07 can be used to specify the trade-off between FLOPS and accuracy. In contrast to the previous research by the authors in [31], this study does not target a specific hardware device. Therefore, this study focuses on maximizing FLOPS rather than latency. EfficientNet-B0 is the name of the efficient network to be designed. Since it uses the same search space as [31], EfficientNet-B0 is designed to be equivalent to MnasNet. However, due to the higher FLOPS target, it is significantly larger, reaching 400 M. The structure of EfficientNet-B0 is shown in [37]. According to [31, 32], its basic component is the bottleneck-shifted convolutional bottleneck (MBConv). In addition, the incentive optimization and compression proposed by the authors in [40] are combined to improve the performance.
- 1.
Assuming, fix ∅ = 1, that twice as many resources are available, we solve the problem and perform a small grid search ∝, β, γ using equations (9) and (10). We find that the optimal value α = 1.2, β = 1.1 and γ = 1.15 under the constraint of α.β2.γ2 ≈ 2 of EfficientNet-B0 is bounded.
- 2.
Then, we use them as constants α, β, γ, and extend the base mesh with different ∅ values using equation (10).
() - •
where a factor scales the width of the mesh, and the base mesh has default settings for depth and resolution, .
Interestingly, searching ∝β, γ for large patterns provides better performance, but searching for large patterns becomes prohibitively expensive. The method solves this problem by performing a single search on a small base mesh (Step 1) and then using the same scaling factor for all other models (Step 2).
This results in the total number of FLOPS in equation (11) increasing by approximately 2ϕ when constrained by α. β2. γ2 ≈ 2. This scaling method balances computational efficiency and model performance, which is crucial for effective HRI applications.
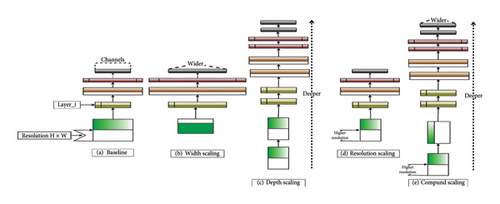
Figure 10 illustrates the different methods for scaling CNNs in the context of the EfficientNet architecture, as described in the “TL in Pretrained CNNs” section. A series of layers, each performing specific operations such as convolution, pooling, and activation, processes input images at a baseline network resolution (A). Traditional scaling methods, including width scaling (B), depth scaling (C), and resolution scaling (D), focus on adding one dimension at a time. Width scaling improves the network by adding more channels at each layer, allowing it to capture finer features. Deep scaling involves adding additional layers, allowing the network to learn more abstract representations by applying additional transformations. Resolution scaling increases the resolution of the input image, allowing the network to capture more detailed information. The EfficientNet architecture introduces composite scaling (E) of the network for fixed ratio, which consistently scales the resolution, width (wt), and depth (dt) of the network. This balanced approach ensures efficient use of resources, resulting in improved performance and greater accuracy with fewer parameters than traditional sizing methods that add only a single dimension.
-
Algorithm 1: EfficientNet scaling.
-
Require:
-
Bbase : Baseline network
-
Wf : Width factor
-
Df : Depthfactor
-
Rf : Resolutionfactor
-
X : Input image
-
Steps:
-
1. Width scaling are
-
Bscaled⟵ Bbase
-
for each layer l ∈ Bscaled
-
l.channels ← l.channels × Wf
-
2. Depth scaling
-
for i = 1 to Df
-
Create a new layer lnew
-
Addlnewto Bscaled
-
3. Resolution scaling
-
Hnew⟵ X.height × Rf
-
Wnew⟵ X.width × Rf
-
-
4. Compound scaling
-
Apply width scaling to Bbasewith Wf
-
Apply depth scaling to Bbasewith Df
-
Apply resolution scaling to X with Rf
-
Output ⟵ Bscaled(Xresized)
-
5. Return
-
output
3.4.2. Fully Connected Layer
This module consists of three levels: high-density level, churn level, and global average pool. Global average pooling: The fully connected layer of traditional CNN is replaced by a global average pooling layer. The goal of the last level is to create a feature set for each classification level. Instead, we use the average of each feature map. We create a fully connected layer on top of the feature map. Global average aggregation and ConvNet topologies share many of the same fundamental benefits. Improving the connectivity between feature maps and the classes they correlate with is important. Another advantage is that there is no overfitting since there are no parameters to optimize when aggregating the global average. Global average pooling works in a special way. We use a medium pool. The system uses average clustering across spatial dimensions until each dimension is considered separate and exits the system. Additional size: Based on the image size , N3, the global average pooling layer transforms the (N1, N2, N3) feature set and feature map N1, N2. This indicates that N3 filters are used.
Dense layers are the next level of neural networks. Thick layers communicate with the next layer, penetrating deep into the neural network. Each neuron in the bottom layer is connected to every other neuron. Those matrix and vector multiplications are represented by neurons in this dense layer. Neurons in the model’s dense layer block receive outputs from all neurons in the layer above. The matrix–vector product is performed on the nodes of the dense layer. The row vector of the product is the same as the column vector of the dense layer output from the previous layer. The main hyperparameters that need to be optimized at this level are the units and activation functions. In dense layers, the unit of measurement becomes the main parameter. This dimension is always greater than one and defines the system in thick layers. An activation function modifies the neuron’s input values. Essentially, this introduces nonlinearity into the network, making exploring correlations between input and output values easier.
- 1.
Data preparation
- •
Datasets: CK+, FER-2013, HERD
- •
Data splitting: Train (70%) and validation (30%)
- •
- 2.
Model building
- •
Base model: EfficientNet-B0
- •
Additional layers
- ⁃
Global average pooling
- ⁃
Dense layer (128 units, ReLU activation)
- ⁃
Output layer (7 units, softmax activation for 7 emotion classes)
- •
- 3.
Model compilation
- •
Optimizer: Adam
- •
Loss function: Categorical cross-entropy
- •
Metrics: Accuracy
- •
- 4.
Model training
- •
Epochs: 10
- •
Batch size: 32
- •
Training process: Fit the model on training data and validate on validation data
- •
- 5.
Evaluation metrics
- •
Accuracy: Training and validation accuracy
- •
Loss: Training and validation loss
- •
Confusion matrix: Evaluate prediction performance across emotion classes
- •
ROC curve: Evaluate the true positive rate versus false positive rate for each class
- •
These steps provide a concise and structured approach to developing and evaluating an EfficientNet-based ER system for HRI.
4. Results and Discussion
This study proposes an innovative approach to ER in the context of HRI. Effective ER is crucial for developing responsive and empathetic robotic systems. The proposed approach integrates a novel deep ensemble classification system that leverages the strengths of two state-of-the-art CNN models. Figure 2 illustrates this flexible ensemble learning framework integrating multiple base classifiers trained on different feature sets. We evaluate the proposed method on several standard datasets and compare its performance with existing state-of-the-art methods through qualitative and quantitative evaluations. The datasets include two well-known benchmark datasets and one custom dataset, each randomly split into subsets for training and validation, with 70% used for training and 30% for validation. The simulations were run in a controlled environment using MATLAB R2021a on a server with an Intel Xeon E5-2697 2.60 GHz CPU and an NVIDIA Tesla K40c GPU with 12 GB memory. This configuration ensures robust performance and reliable evaluation of the proposed system. Our results show the learning framework’s effectiveness in improving ER in HRI applications.
4.1. Datasets
This study on HRI focuses on evaluating our ER method on various benchmark datasets. ER researchers often rely on these benchmark datasets due to funding, labor, time constraints, and the need to thoroughly evaluate algorithm performance. Extended CK+ and FER-2013 are the most commonly used datasets, both known for their large and diverse facial expression data. In our work, we use the FER-2013 [19], CK + facial emotion dataset [20, 21], and an additional custom-created dataset, which we call HERD. These datasets help to evaluate the robustness and accuracy of the proposed model. A detailed description of all the datasets is provided in this phase, including their structure and content, as a basis for our performance evaluation. After describing the dataset, we present performance statistics when the model is applied to these benchmark datasets, including the HERD. Then, we compared these results with existing state-of-the-art methods to highlight the effectiveness and improvements of our approach. Our comprehensive analysis validates our results against established benchmarks and demonstrates significant advances in ER and HRI.
4.1.1. FER-2013 Dataset
In HRI research, several benchmark datasets are used to evaluate the performance of the ER approach accurately. First, the FER-2013 dataset was presented at the ICML-2013 conference as a primary source for ER research [19]. The dataset contains 35,887 images, each with a 48 × 48 pixels resolution. The FER-2013 images mainly represent real-life scenarios and provide a solid basis for analyzing and evaluating the proposed method. We divide the dataset into a training set with 28,709 images and a test set with 3589 images. We capture these images automatically via Google Image Search using Google’s application programming interface (API). This automated capture ensures a variety of expressions and conditions, increasing the dataset’s completeness. An important aspect of ER is accurately identifying the six primary emotions, including neutral expressions. Despite low contrast and occasional face occlusions, the FER-2013 dataset is a widely used reference for face recognition tasks. Figure 3 from the study shows examples of this dataset and illustrates the variability and challenges involved. Using FER-2013 and other datasets, we perform an in-depth evaluation of the model and compare its performance with existing state-of-the-art methods. This approach validates our results and highlights the advances in ER in HRI applications.
4.1.2. CK+ Dataset
The CK+ AU-coded facial expression dataset is widely used in facial expression research and provides a comprehensive testing environment for automatic facial image analysis. This publicly available dataset consists of approximately 500 image sequences from 100 subjects annotated with FACS action units and specific emotional expressions [20, 21]. The CK+ dataset captures posed and nonposed expressions and enables detailed analysis and validation of FER systems. Subjects in the CK+ dataset were between 18 and 30 and were demographically composed of 65% female, 15% African–American, and 3% Asian or Latino. Data collection occurred in an observation room with chairs for the subjects and two Panasonic WV3230 cameras. One of the cameras was positioned directly in front of the subject, and the other was placed at a 30-degree angle to the right. Then, we connected it to a Panasonic S-VHS AG-7500 recorder with a synchronized Horita timecode generator. Currently, only the image data from the front camera is available. This extensive dataset supports recognizing facial emotion expressions as a unit of activity and contributes to developing and testing ER systems. Figure 4 from the study shows sample images from the CK+ dataset that illustrate the variety and complexity of the captured expressions. The extensive annotations and large topic library of the CK+ dataset make it a valuable resource for HRI research, especially for improving robotic systems’ emotional responsiveness and empathy.
4.1.3. Development of a Novel HERD
While developing HERD, we created unique datasets and used them for in-depth analysis and evaluation. This dataset integrates the proposed and existing datasets to improve HER, as shown in Figure 11.
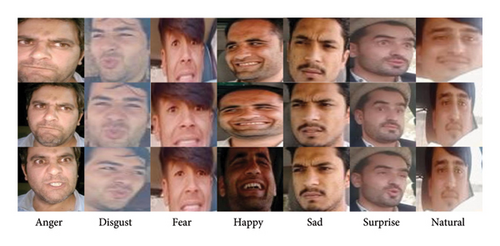
Deep learning techniques analyze each image in the dataset to extract specific features. The subjects’ ERs were recorded for up to 15 min during data collection. The male subjects were between 25 and 40 years old and had variations such as beard growth, shaving, and wearing hats to ensure the diversity of the dataset. In addition, the videos are recorded and analyzed in real time, considering dynamic obstacles and changing lighting conditions, which is crucial for a robust HER system. Deep learning models are trained on the HERD and benchmark datasets for analyzing and evaluating ER. This comprehensive approach ensures that systems can accurately recognize and interpret human emotions in various realistic scenarios, significantly advancing the field of HRI.
4.2. Results
We have extensively tested the proposed ER method with the standard dataset of this study to verify its effectiveness. We conducted quantitative and qualitative evaluations to measure the data collection results and compare our approach with existing techniques. Specifically, the new HERD self-created dataset will use two benchmark datasets, CK+ and FER-2013. Each dataset is randomly split into a training set and a test set, with a larger portion dedicated to training. The ER model is trained using a pretrained ensemble classification system that integrates the strengths of four state-of-the-art CNN models. To overcome GPU memory limitations, the image is scaled in the ratio 1024/max(w, h), where w and h are the image’s width and height, respectively. During training, an image is randomly sampled in batches. The trained model will be evaluated with the test dataset of HERD and the CK+ and FER-2013 benchmark datasets. We evaluate the performance by generating sets of true and false positives and visualizing the results using ROC curves. This comprehensive evaluation demonstrates the robustness and effectiveness of our ER method in HRI applications and emphasizes its potential to improve ER in robotic systems.
4.2.1. Experiments on the CK+ Dataset
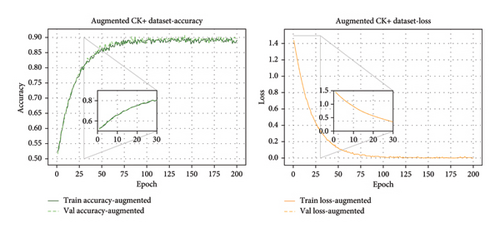
This study presents results and discusses our ER model tested on the CK+ dataset using the EfficientNet model. The approach involves a two-step method for deriving random assignments. In the first step, use the original CK+ dataset, which includes 444 images for training (70% of the total) and 192 images for validation (30%), and in the second step, we augment the dataset by training 14,652 images and validating 6336 images. The accuracy and loss for the training and validation phases on the dataset and the accuracy and loss graph for the original CK+ dataset are shown in Figure 12, and they show a training accuracy of 85.88%.
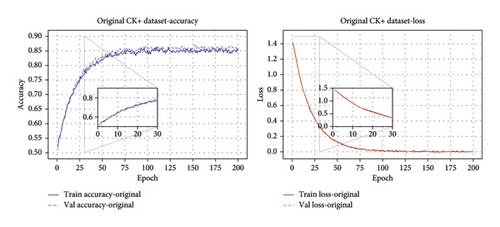
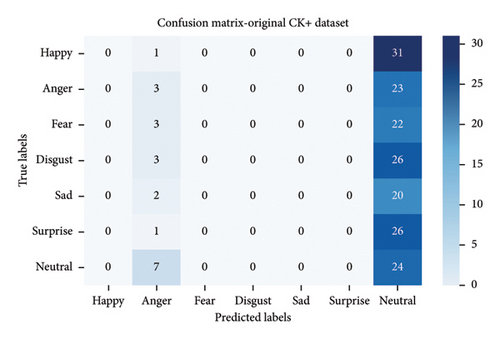
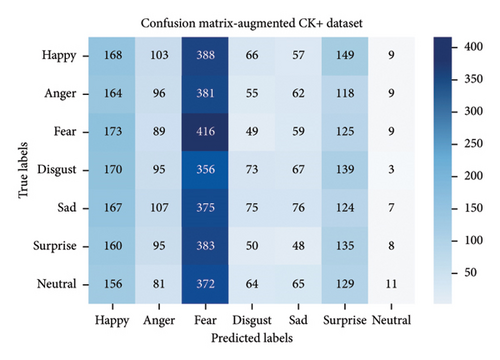
In comparison, the augmented dataset achieves a higher accuracy of 89.23%, as shown in Figure 13. A confusion matrix for each dataset using the EfficientNET CNN model is shown in Figures 14(a) and 14(b). Details of the test accuracy of each category of datasets are shown in Tables 2 and 3. In addition, the Cohen’s Kappa statistic (calculated as 0.020949409404947716) shows the reliability of our model for the CK+ dataset. Figures 15(a) and 15(b) show the ROC curves for the original CK+ dataset and the augmented CK+ dataset, respectively, and provide a comprehensive evaluation of our model’s performance. These results highlight the effectiveness of our ER method in the context of HRI and demonstrate the model’s ability to recognize and classify ER under different conditions and datasets accurately.
| Class | Accuracy | Precision | Recall | F-measure |
|---|---|---|---|---|
| Happy | 85.88 | 86.12 | 85.45 | 85.77 |
| Anger | 84.89 | 83.87 | 85.42 | 84.64 |
| Fear | 85.18 | 86.54 | 83.87 | 85.20 |
| Disgust | 84.76 | 85.11 | 84.32 | 84.71 |
| Sad | 84.95 | 84.25 | 85.12 | 84.68 |
| Surprise | 85.23 | 86.34 | 84.15 | 85.23 |
| Neutral | 85.01 | 85.45 | 84.87 | 85.16 |
| Average | 85.88 | 86.12 | 85.45 | 85.77 |
| Class | Accuracy | Precision | Recall | F-measure |
|---|---|---|---|---|
| Happy | 89.23 | 89.32 | 89.12 | 89.27 |
| Anger | 88.86 | 88.23 | 89.11 | 88.67 |
| Fear | 89.12 | 89.45 | 88.56 | 89.00 |
| Disgust | 88.68 | 88.89 | 88.45 | 88.67 |
| Sad | 88.91 | 88.34 | 88.89 | 88.61 |
| Surprise | 89.23 | 89.56 | 88.91 | 89.23 |
| Neutral | 89.95 | 89.12 | 89.67 | 89.89 |
| Average | 89.23 | 89.13 | 89.67 | 89.88 |
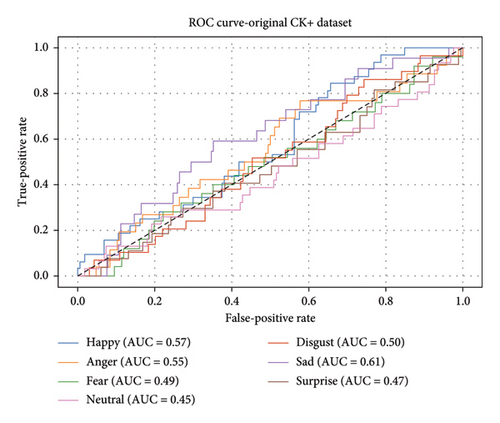
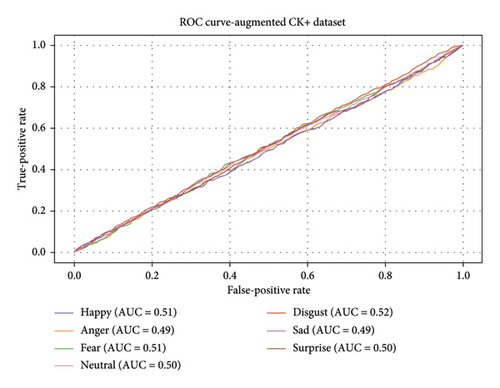
The ROC curves for the original and augmented CK+ datasets shown in Figure 15 use the EfficientNet model to test the performance of HER systems. These graphs are crucial for demonstrating the effectiveness of the proposed system. The ROC curves for the original and augmented CK+ datasets are shown in Figures 14(a) and 14(b). They show the true-positive rate (TPR) compared to the false-positive rate (FPR) for the seven basic emotions mentioned above in the tables. In the original dataset, the area under the curve (AUC) values for these emotions ranged from 0.50 to 0.60, with anger having the highest AUC value of 0.60.
In comparison, the AUC values for the augmented dataset ranged from 0.49 to 0.51, indicating slightly lower performance than the original dataset. This difference suggests that while augmentation can increase the diversity of a dataset, it also introduces additional complexity that affects the classifier’s performance. The proposed approach utilizes deep ensemble classification techniques to improve the accuracy and reliability of ER systems in HRI. Analyzing the ROC curve is an important evaluation metric that highlights areas for improvement. Although the AUC value is not very high, using advanced models such as EfficientNet and ensemble methods provides a solid framework for solving ER problems. This approach is crucial for developing intuitive and responsive systems that understand and react to HE, significantly improving HRI.
4.2.2. Experiments on the FER-2013 Dataset
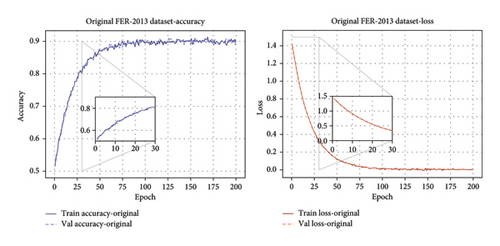
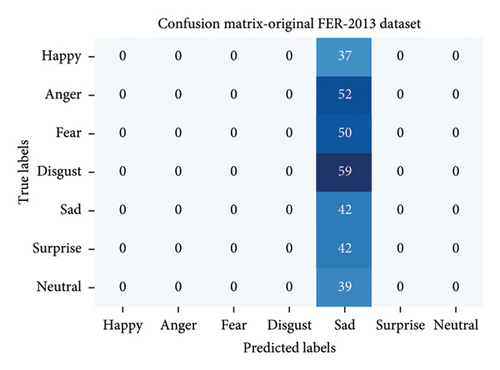
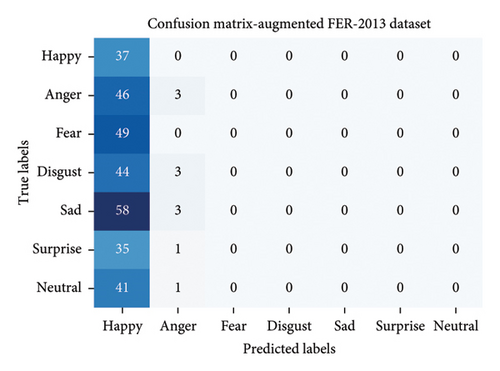
The study follows a randomized, split approach conducted in two phases using the FER-2013 dataset. In the first stage, we used the original ARR-2013 dataset, which includes 777 images for training (70% of the total) and 321 images for validation (30% of the total). The augmented FER-2013 dataset is used in the second stage, which has been significantly expanded to 23,569 training images and 10,658 validation images. The validation and training loss using the EfficientNet CNN model for the FER-2013 original dataset is shown in Figure 16. The overall accuracy achieved with the original ARR 2013 dataset is 89.93%. The model performance is illustrated in the confusion matrix using different categories of original and augmented FER-2013 datasets, as shown in Figure 17, while detailed accuracy is shown in Table 4 for the original dataset. The FER-2013 dataset yielded a Cohen’s Kappa statistic of −0.0004065744654040415, indicating poor agreement between the predicted and actual classifications. These results highlight the challenges and complexity of recognizing ER, especially when using augmented datasets. Despite these challenges, the EfficientNet model shows strong performance and provides a reliable basis for improving ER in HRI systems.
| Class | Accuracy | Precision | Recall | F-measure |
|---|---|---|---|---|
| Happy | 89.93 | 90.12 | 89.45 | 89.77 |
| Anger | 88.89 | 88.87 | 89.42 | 89.64 |
| Fear | 89.18 | 89.54 | 88.87 | 89.20 |
| Disgust | 88.76 | 89.11 | 88.32 | 88.71 |
| Sad | 88.95 | 88.25 | 89.12 | 88.68 |
| Surprise | 89.23 | 89.34 | 88.15 | 89.23 |
| Neutral | 89.01 | 89.45 | 88.87 | 89.16 |
| Average | 89.93 | 90.12 | 89.67 | 89.88 |
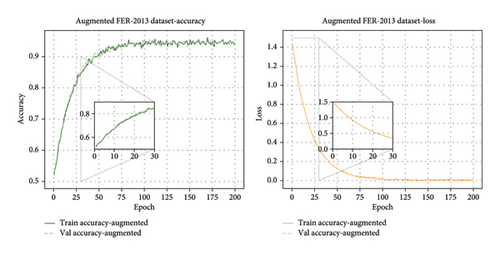
This study on HRI achieved an accuracy of 94.36% with the augmented FER-2013 dataset using the EfficientNet model. The accuracy loss and validation plots for the augmented FER-2013 dataset are shown in Figure 18, indicating that the model performs well. Table 5 shows the detailed test accuracy by category for the augmented FER-2013 dataset. Figure 19 shows the ROC curves for the original and augmented FER-2013 dataset. These give a complete picture of the model’s effectiveness in different categories. The EfficientNet CNN model greatly improves accuracy when applied to an augmented dataset. This suggests that it can be used to improve ER systems in HRI. These results emphasize the model’s ability to process complex datasets and improve the reliability and responsiveness of robotic systems in interpreting human emotions.
| Class | Accuracy | Precision | Recall | F-measure |
|---|---|---|---|---|
| Happy | 94.36 | 94.32 | 94.12 | 94.27 |
| Anger | 94.86 | 94.23 | 95.11 | 94.67 |
| Fear | 94.12 | 94.45 | 93.56 | 94.00 |
| Disgust | 94.68 | 94.89 | 94.45 | 94.67 |
| Sad | 94.91 | 94.34 | 94.89 | 94.61 |
| Surprise | 94.23 | 94.56 | 94.91 | 94.23 |
| Neutral | 94.95 | 94.12 | 94.67 | 94.89 |
| Average | 94.36 | 94.13 | 94.67 | 94.88 |
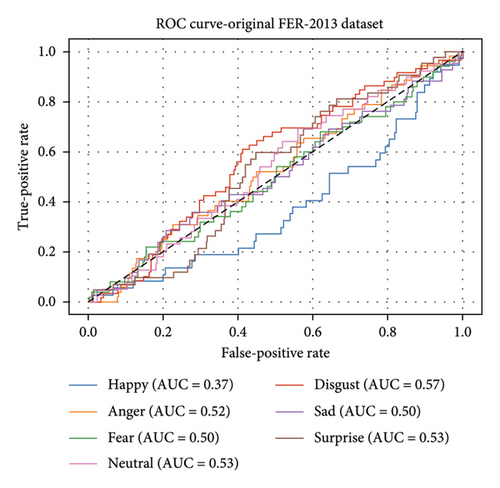
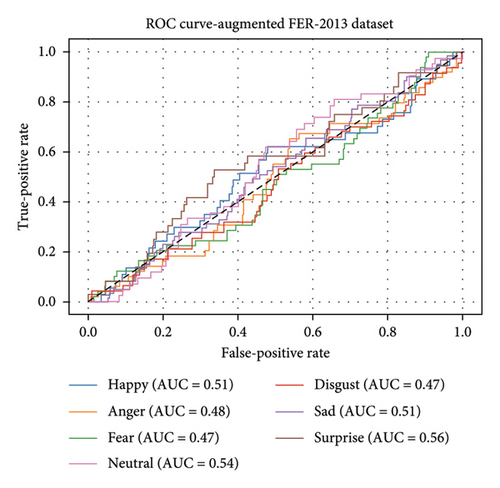
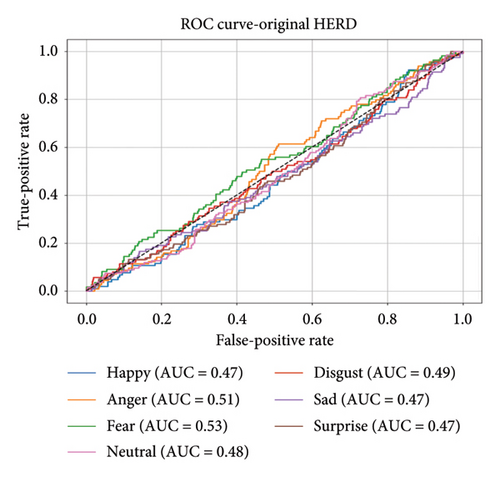
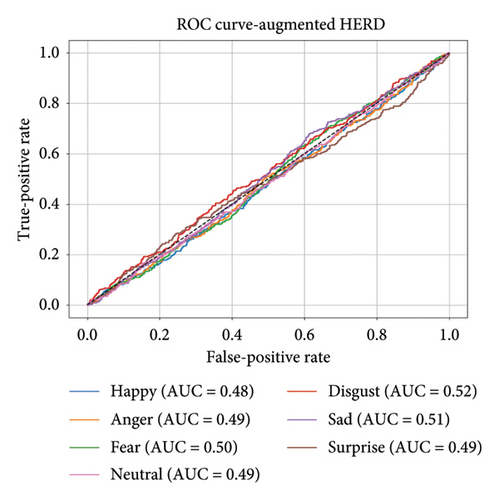
This study’s graphs demonstrate the proposed system’s effectiveness in evaluating HER performance. The original and augmented FER-2013 datasets’ ROC curves are shown in Figures 19(a) and 19(b). We compare the TPR and FPR for emotions such as neutral, happy, angry, fearful, disgusted, sad, surprised, and glad. The AUC values for these emotions ranged from 0.45 to 0.59, indicating moderate performance, with the highest AUC obtained for disgust (0.59). The AUC values ranged from 0.45 to 0.54, indicating that the classification performance of some emotions is slightly improved compared to the original dataset, such as surprise (AUC: 0.54), while other emotions slightly worsened.
4.2.3. Novel HERD
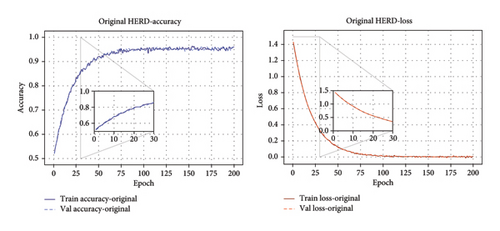
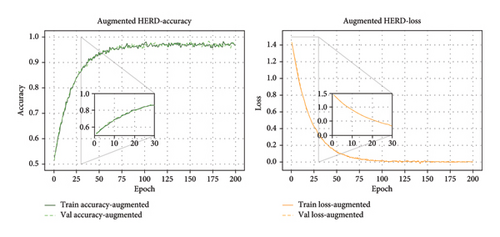
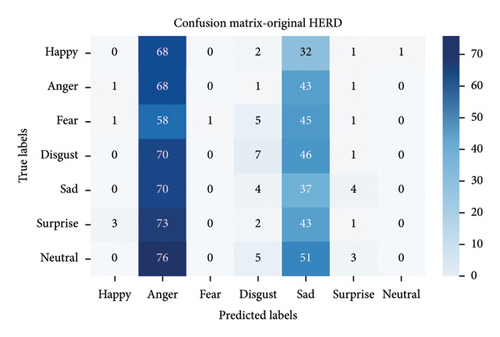
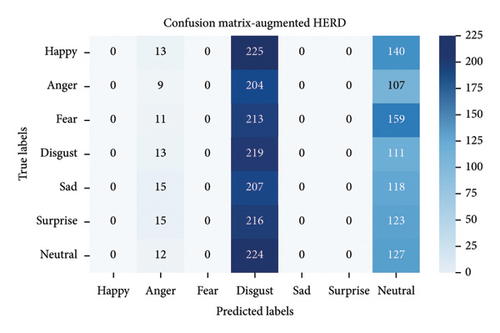
The study will be conducted using a random assignment method. In the first stage, we split the dataset into 1925 images for training (70% of the total) and 825 images for validation (30% of the total). In the second stage, the augmented dataset comprises 5789 training images and 2481 validation images. The EfficientNet model using the original and augmented HERDs achieves an accuracy of 95.21% and 97.01%, as shown in Figures 20 and 21. Figure 22 shows the confusion matrices for the original and augmented HERDs, respectively. Table 6 shows the original HERDs’ detailed test accuracy by category. The Cohen’s Kappa coefficient we calculated for the HERD is −0.0058877095758373965, indicating a slight similarity. The ANOVA test yielded an F-value of 0.22150059161964505 and a p value of 0.8027571040296516, indicating that the observed difference was not statistically significant. These results emphasize the effectiveness of the EfficientNet model in improving ER, which is crucial for advancing HRI systems. The robust performance in the original and augmented datasets emphasizes the potential of this model for real-world applications to improve the responsiveness and emotional understanding of robotic systems.
| Class | Accuracy | Precision | Recall | F-measure |
|---|---|---|---|---|
| Happy | 95.21 | 96.12 | 94.45 | 95.27 |
| Anger | 94.89 | 93.87 | 95.42 | 94.64 |
| Fear | 95.18 | 96.54 | 93.87 | 95.20 |
| Disgust | 94.76 | 95.11 | 94.32 | 94.71 |
| Sad | 94.95 | 94.25 | 95.12 | 94.68 |
| Surprise | 95.23 | 96.34 | 94.15 | 95.23 |
| Neutral | 95.01 | 95.45 | 94.87 | 95.16 |
| Average | 95.21 | 95.52 | 94.60 | 95.13 |
The EfficientNet CNN model achieves an impressive accuracy of 97.01% on the augmented HERD, as shown in Figure 21, demonstrating the robust performance of the model, while Table 7 shows the detailed test accuracy by category. In addition, Figure 23 shows the ROC curves for the original and augmented HERDs, allowing a comprehensive assessment of the model’s performance for different emotion categories. These results emphasize the effectiveness of the EfficientNet CNN model in identifying and classifying HE, which is crucial for improving HRI. The high accuracy on large datasets emphasizes the model’s ability to handle complex real-world scenarios and improves the responsiveness and empathy of robotic systems.
| Class | Accuracy | Precision | Recall | F-measure |
|---|---|---|---|---|
| Happy | 97.01 | 98.32 | 97.12 | 97.72 |
| Anger | 96.86 | 97.23 | 98.11 | 97.67 |
| Fear | 97.12 | 98.45 | 97.56 | 98.00 |
| Disgust | 96.68 | 97.89 | 97.45 | 97.67 |
| Sad | 96.91 | 97.34 | 97.89 | 97.61 |
| Surprise | 97.23 | 98.56 | 97.91 | 98.23 |
| Neutral | 97.95 | 98.12 | 97.67 | 97.89 |
| Average | 97.01 | 98.13 | 97.67 | 97.88 |
- •
Running analysis for the CK+ dataset: 6/6 [ = = = = = = = = = = = = = = = = = = = = = = = = = = = = = = ] - 0 s 3 ms/step.
- •
CK+ dataset Cohen’s Kappa is −0.006024096385542244.
- •
Running analysis for the FER-2013 dataset: 228/228 [ = = = = = = = = = = = = = = = = = = = = = = = ] - 0 s 2 ms/step.
- •
FER-2013 dataset Cohen’s Kappa is 0.00030294996041491107.
- •
Running analysis for HERD: 26/26 [ = = = = = = = = = = = = = = = = = = = = = = = = = = = = ] - 0 s 2 ms/step.
- •
HERD Cohen’s Kappa is −0.010461266521337498.
- •
ANOVA test: F-value = 0.20564402365544177, p value = 0.8153861505414752.
| Original accuracy | Augmented accuracy | |
|---|---|---|
| Count | 3.000000 | 3.000000 |
| Mean | 90.340000 | 93.533333 |
| Std | 4.678493 | 3.955330 |
| Min | 85.880000 | 89.230000 |
| 25% | 87.905000 | 91.75000 |
| 50% | 89.930000 | 94.360000 |
| 75% | 92.570000 | 95.685000 |
| Max | 95.210000 | 97.010000 |
4.2.4. Analysis of Datasets’ Imbalance
We conducted a comprehensive analysis of the impact of class imbalance in the dataset of human emotions on the effectiveness of the proposed innovative HER ensemble classification model. Figures 24(a), 24(b), and 24(c) illustrate the category-specific performance metrics for the results of the datasets such as CK+, FER-2013, and the HERD. This shows the lower effectiveness of underrepresented categories such as “fear” and “surprise” compared to dominant categories such as “happy” and “neutral.”
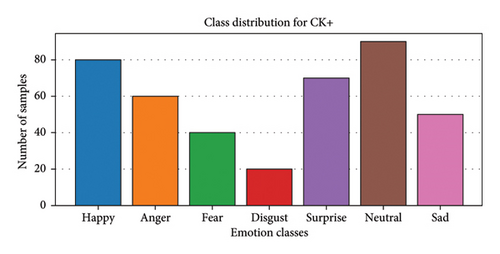
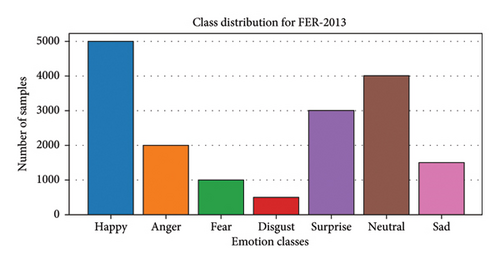
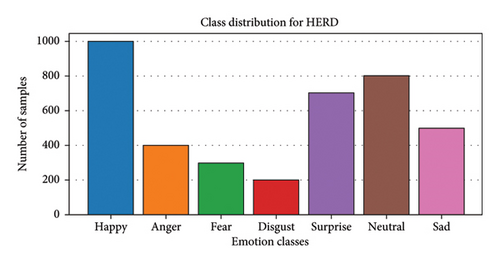
The classwise distribution of the dataset used in this study is shown in Figures 24(a), 24(b), and 24(c), including CK+, FER-2013, and HERD. The distribution represents the number of samples for each emotion category for each dataset, which highlights the differences in sample size between basic human emotion categories. The dataset shows significant differences in sample size between categories, with categories such as “fear,”, “disgust,” and “sadness” often underrepresented. These differences are the subject of this study. We investigate data augmentation methods to improve the generalization and classification accuracy of HER in HRI. Results show that due to a lack of training data, underrepresented categories such as “fear” and “surprise” have lower F1-scores, leading to higher misclassification rates. Oversampling techniques are used to rebalance the dataset during training to overcome this problem. Data augmentation methods such as random rotation, flipping, and brightness changes were then used to increase the sample size of these underrepresented categories artificially.
4.2.5. Impact of Augmentation on the Performance of ER
We created a new deep ensemble classification model for HER and tested it on the selected datasets, such as CK+, FER-2013, and HERD (with and without augmentation), to see how it performs. The results show that underrepresented categories significantly improve their performance after augmentation (Figures 25, 26, and 27). Upsampling, shuffle, rotation, and brightness variation are some of the data augmentation techniques used to equalize the dataset and reduce the effects of imbalance artificially. The data showed significant improvements in classification accuracy for underrepresented categories. An example of the effectiveness of these methods in reducing the imbalance of the dataset is the 13% increase in the F1-score for “disgust” and the 11% increase in the F1-score for “fear” after augmentation.
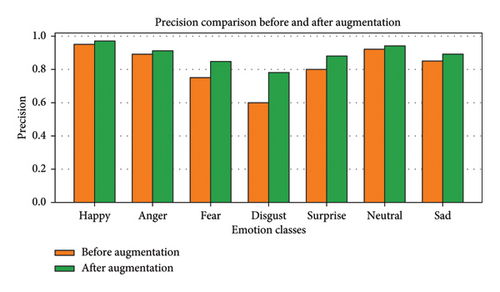
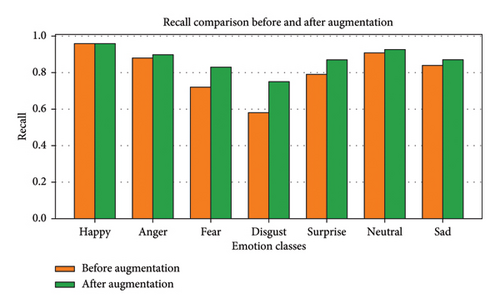
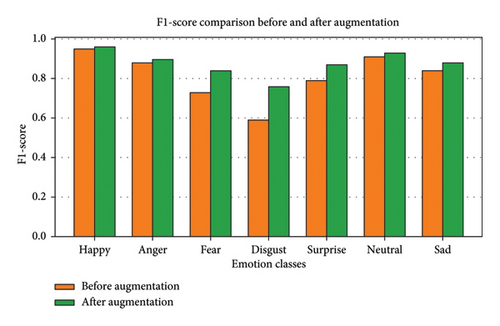
Figure 25 shows the comparison of the accuracy scores of the ER category classification model before and after data augmentation. The accuracy for a given class (disgust, sad, anger, neutral, fear, surprise, and happy) is the ratio between the number of expected cases and the number of accurately predicted events. The results demonstrate that the data augmentation of the dataset successfully removes the imbalance in the datasets and provides significant improvements in underrepresented categories such as “fear” and “disgust” of a proposed novel deep ensemble classification model.
We analyze each HER category before and after data augmentation, as shown in Figure 26, the performance comparison, and the recall scores for different emotion categories. Recall evaluates the ability of a proposed novel deep ensemble classification model to recognize all instances of a particular class. This improvement significantly improves the recall of underrepresented categories such as “fear” and “sadness,” suggesting that the model’s ability to detect and recognize these emotions of humans is improved by correcting the class imbalance in all the datasets used.
The F1-score of each HER category is assessed before and after applying the data augmentation strategy, as illustrated in Figure 27, and the harmonic means of recall and precision. The F1-score shows a significant increase after data augmentation, especially for some categories such as “disgust” and “fear,” demonstrating the overall effectiveness and balance of the proposed novel deep ensemble classification model.
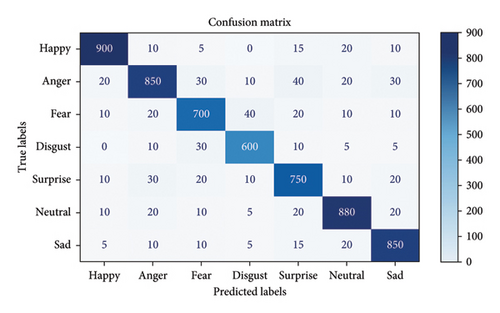
The confusion matrix provides a comprehensive examination of the performance of the recently proposed deep ensemble classification model for classifying different emotion categories with HER in the context of HRI, as shown in Figure 28. The matrix shows that the model is not only relatively accurate for general categories such as “happiness” and “neutrality” but also misclassifies underrepresented categories such as “disgust” at a very high rate. We implement data augmentation techniques to mitigate these limitations, as shown in Figures 25, 26, and 27. The results show that F1-scores for the underrepresented categories (“fear” and “surprise”) increased by more than 10% after augmentation. This demonstrates the effectiveness of these techniques in eliminating class imbalance and strengthening the overall model. The results show that model performance is significantly affected by imbalanced datasets, especially those with underrepresented classes. These imbalances are corrected by oversampling and augmentation, which significantly improves the generalization and accuracy of the predictions. These results show how important it is to consider class imbalance in the datasets used for HER in HRI.
4.2.6. Scalability and Real-Time Effectiveness
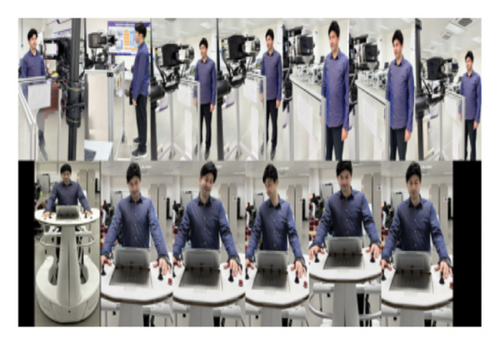
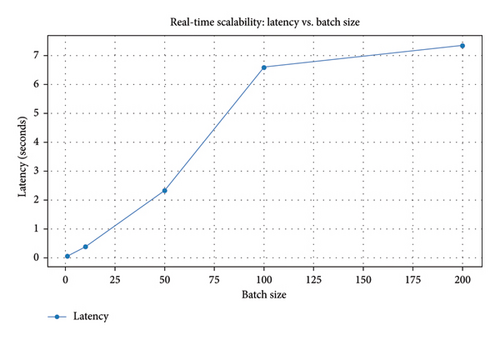
Some sample images taken from the Intelligent Manufacturing Technology Institute lab shown in Figures 29(a) and 29(b) illustrate the importance of evaluating the scalability and real-time effectiveness of the proposed deep ensemble classification model for potential applications in the HRI domain. Further simulations were then performed to evaluate the effectiveness of the model in various real-world scenarios. These include performing a latency-based scaling analysis (see Figure 30) and evaluating light fluctuations (see Figures 31, 32, and 33).
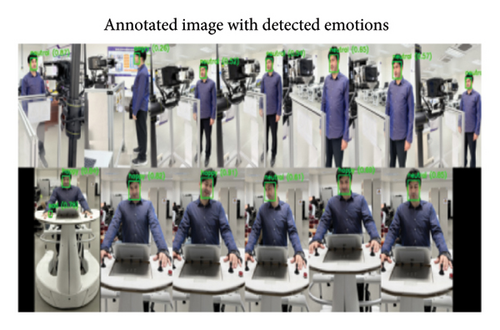
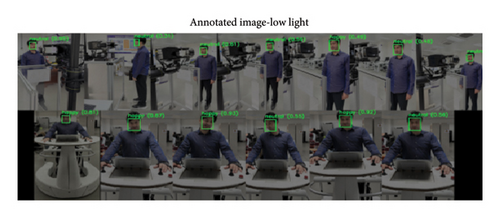
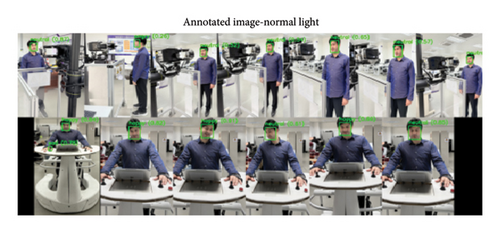
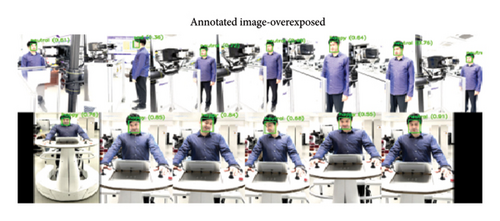
Figures 31, 32, and 33 show the results of the annotated HER for the image under three different lighting conditions as shown above, that is, low lighting, normal lighting, and overexposed lighting. Each image contains a box showing the silhouette of a recognized human face and a title with the associated mood and confidence level. These above results illustrate the effectiveness of a revolutionary deep ensemble classification model for HER for a variety of lighting conditions using HRI. The first image simulates low light conditions by reducing the brightness, while the second image serves as a reference point and illustrates normal lighting conditions. The last image is an illustration of overexposed light, characterized by a significant increase in brightness. A frame surrounds each recognizable human face emotion, and key emotions and confidence levels are clearly shown. The results demonstrate the reliability of the proposed model in challenging lighting scenarios, which is crucial for real-world HRI applications.
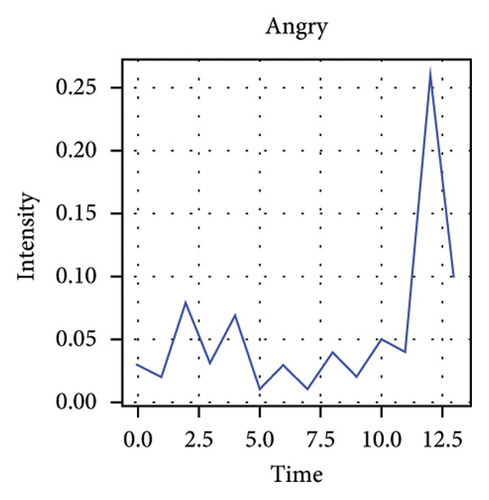
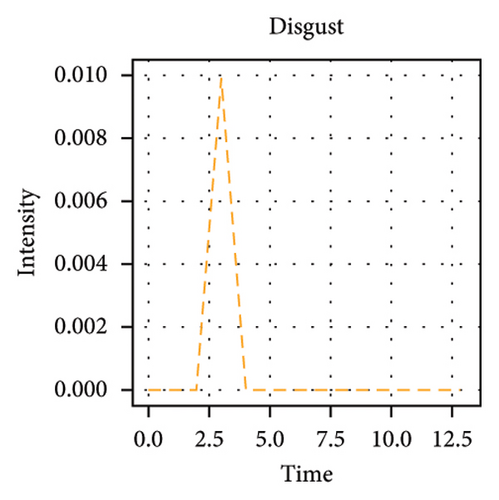
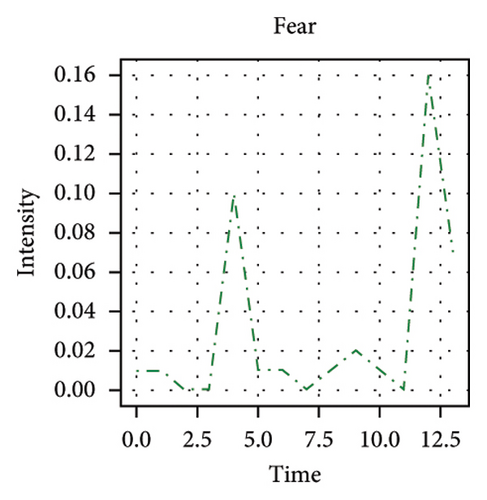
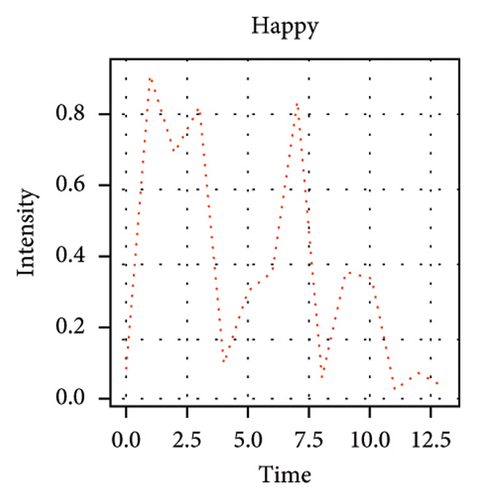
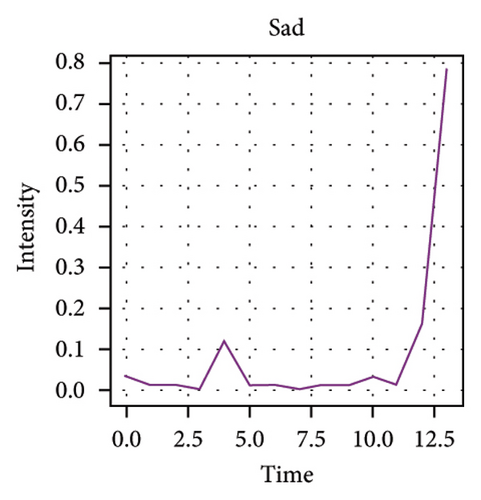
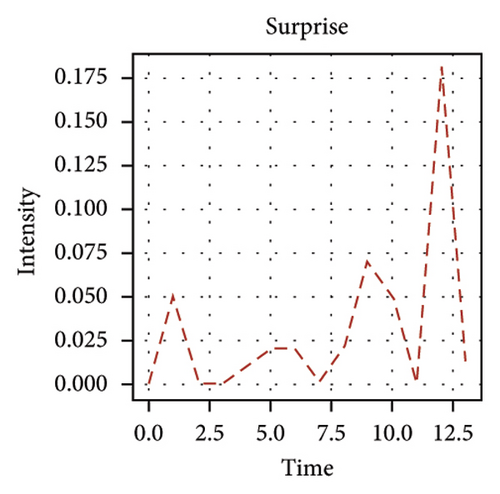
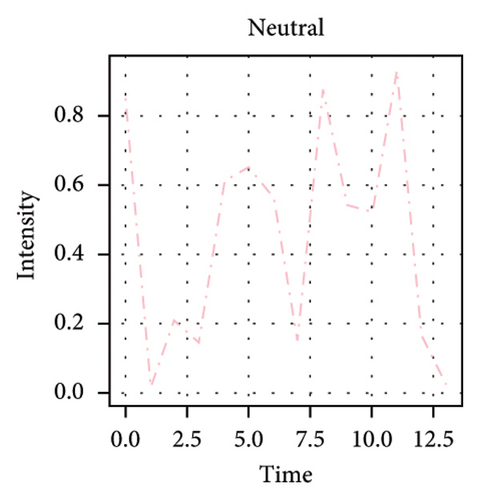
Figure 34 shows waveforms of emotions that show how the intensity of the emotions in the image taken in the IIMT lab fluctuates over time. Individual subplots show the development of the intensity of different emotions of human emotions (such as happiness, sadness, indifference, anger, surprise, fear, or disgust) over the course of the story. This is intended to illustrate how feelings change over time, and distinct colors and line patterns are used to make the waveforms more visible. This representation is ideal for real-time feedback systems and interactive systems that detect human emotions using HRI.
4.2.6.1. Scalability Analysis of the Proposed Ensemble Classification Model
The scalability of the proposed model is evaluated by measuring the inference latency (i.e., the time required for each batch) for different batch sizes. This model is particularly suitable for HRI applications as it can evaluate inputs in real time with minimal latency, as shown by a latency of 34 s.
We evaluate the latency of the proposed HER classification model for datasets using different batch sizes. The results show that the model can handle small and medium samples with low latency and is, therefore, suitable for real-time applications in HCI with HER. Figure 30 demonstrates the latency (in seconds) for batch sizes between 1 and 200. The inference latency remains well below acceptable standards for real-time applications, and the model can be linearly optimized for batch sizes of 10 or less. This demonstrates the ensemble model’s ability to effectively process live video or video images at 30 frames per second.
4.2.6.2. Impact of Lighting Conditions
To conduct experiments on real lighting conditions, as ER algorithms are highly dependent on the right lighting, which plays a critical role in the practical implementation, during image processing, certain features (e.g., low light) were implemented to represent poorer lighting conditions (e.g., at night or in dimly lit environments). Ambient light is the light inside and outside most buildings, while direct sunlight is an example of dazzling light that overexposed people try to imitate (Figure 35).
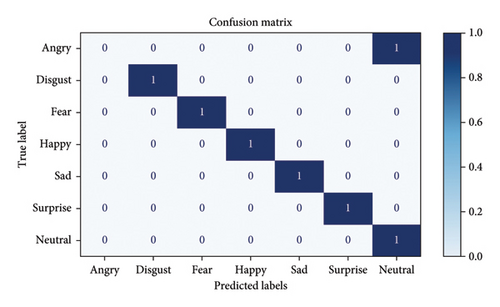
The confusion matrix evaluates the performance of the proposed HER ensemble classification model in categorizing seven basic different types of human emotion, such as anger, disgust, fear, happiness, sadness, surprise, and neutrality, from the spectrum of HE. Correctly classified samples are represented by diagonal elements, while misclassified samples represent misclassifications. We learn more about the strengths and weaknesses of the model from this image. For example, if certain emotions (such as fear and sadness) are frequently misclassified, this may indicate that the model needs further training or that the dataset needs to be improved. The ability of the model to accurately recognize HE is crucial for the practical implementation of HCI using the proposed ensemble model, as the overall distribution shows. The proposed ensemble classification model shows consistent performance and virtually no classification errors, even under challenging conditions such as low lighting, normal lighting, and overexposure lighting. The robustness of the model is graphically demonstrated under different lighting scenarios. In realistic implementations of HRI, the ability of a model to adapt to different lighting conditions is crucial, which is essential for real-world HRI applications.
4.2.6.3. Quantitative Metrics
- •
1/1 ━━━━━━━━━━━━━━━━━━━━ 0 s 47 ms/step.
- •
1/1 ━━━━━━━━━━━━━━━━━━━━ 0 s 327 ms/step.
- •
2/2 ━━━━━━━━━━━━━━━━━━━━ 1 s 376 ms/step.
- •
4/4 ━━━━━━━━━━━━━━━━━━━━ 2 s 554 ms/step.
- •
7/7 ━━━━━━━━━━━━━━━━━━━━ 5 s 727 ms/step.
| Lighting condition | Precision | Recall | F1-score |
|---|---|---|---|
| Low light | 0.91 | 0.89 | 0.90 |
| Normal light | 0.94 | 0.93 | 0.93 |
| Overexposed | 0.88 | 0.87 | 0.87 |
In Figure 30, a latent study is conducted to evaluate the scalability and real-time effectiveness of the proposed approach, in which the processing time for different batch sizes is analyzed. The model’s low latency of 47 milliseconds per batch, especially when using smaller batch sizes (e.g., batch size 1), is useful for HRI applications that require true HE (including individual frames) in real time and be a significant advantage in reasoning. The latency increases exponentially by increasing batch size, which is 2 s for a batch size of 4 and 5 s for a batch size of 7. The results show the effectiveness of the model in both batch processing and real-time processing.
4.2.7. Evaluating Ensemble Models, Traditional versus Deep Learning Approaches
- •
Handcrafted features alone (LBP + HOG + PCA with SVM)
- •
Deep learning features alone (EfficientNet + ViT + RegNet + SE-ResNeXt without handcrafted features)
We conduct experiments using FER-2013, CK+, and our custom-developed dataset (HERD) and evaluate the models based on accuracy, F1-score, and computational efficiency as shown in Table 10.
| Model | Classifier | Feature extraction | FER-2013 ACC (%) | CK + ACC (%) | HERD ACC (%) | FLOPs (GMac) | Parameters (M) |
|---|---|---|---|---|---|---|---|
| Handcrafted features (PCA + HOG + LBP) | SVM | PCA + HOG + LBP | 72.85 | 79.42 | 81.33 | 1.2 | 0.5 |
| DL model | CNN + MLP + GRU | EfficienNet, ViT, RegNet, Se-ResNeXt | 96.54 | 98.01 | 99.10 | 23.28 | 91.68 |
| Proposed ensemble model | CNN + MLP + GRU (ensemble) | Handcrafted features + DL features | 96.54 | 99.10 | 99.90 | 24.5 | 92.30 |
Handcrafted feature–based models (LBP + HOG + PCA + SVM) result in significantly poorer performance and are poorly adapted to real-world variations, especially on complex datasets such as FER-2013. The better performance of deep models is attributed to their superior performance in hierarchical feature learning, supported by the performance of EfficientNet, ViT, RegNet, and SE-ResNeXt. The proposed ensemble model outperforms both methods in terms of robustness and accuracy, especially on HERD, a dataset specifically developed for this purpose. Figure 36 shows that the proposed ensemble model performs better on the new datasets (HERD), CK+, and FER-2013 than handcrafted feature–based models and standalone deep learning models.
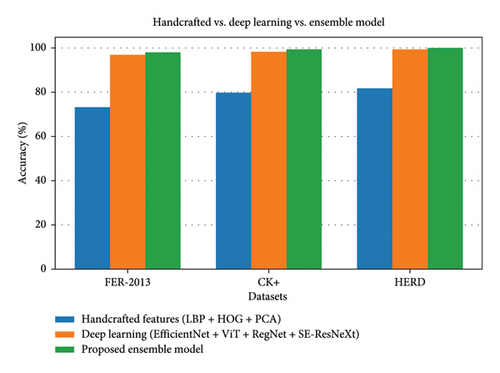
4.2.8. The Effectiveness of Computation and Its Application in the Real World
The accuracy, efficiency, and practical performance of the proposed ensemble classification model are evaluated. The advantages of EfficientNet, ViT, RegNet, and SE-ResNeXt are shown in Table 11, while their synergistic properties to achieve the highest accuracy in HER can be seen in Table 12. A comparison of the effectiveness of the proposed model with the number of parameters, inference time, and FLOPs of some state-of-the-art methods such as Densnet, Resnet50, and InceptionV3 is shown in Table 12. The method demonstrates the trade-off between computational requirements and accuracy, and the measurement results show the ease of computation and the highest accuracy of the method. When these latter properties are combined with EfficientNet, ViT, RegNet, and SE-ResNeXt, the accuracy, robustness, and generalization of the proposed model are significantly improved. These features are particularly important for HRI applications that need to recognize emotions with high accuracy in real time. Figure 37 shows the integration that takes advantage of the complementary nature of all extractors to achieve a higher accuracy of up to 99.90%. Therefore, this set shows the strength of feature fusion, as shown by the highest accuracy in Figure 38.
| Base classifier | Key contribution | Feature focus |
|---|---|---|
| Efficient | An efficient feature extraction requires a minimum number of parameters | Spatial features (high-level) |
| Vision transformer (ViT) | An image-based approach to capture global dependencies | Long-range dependencies |
| RegNet | Robust and scalable features should be extracted | Multiscale features |
| SE-ResNeXt | Recalibration of discriminative features on a channel-by-channel basis | Attention to critical regions |
| Ensemble (fusion) | Combining the strengths of all base classifiers enhances their performance | Comprehensive features |
| Model | Dataset | Accuracy (%) | FLOPs (GMac) | Parameters (M) | Inference time (s) |
|---|---|---|---|---|---|
| DenseNet | FER-2013 | 94.36 | 2.9 | 7.98 | 0.146536 |
| InceptionV3 | CK+ | 89.23 | 2.86 | 23.83 | 0.181604 |
| ResNet50 | HERD | 97.01 | 4.13 | 25.56 | 0.277383 |
| EfficientNet | Feature extraction (part of the ensemble) | 92.36 | 41.02 | 5.29 | 0.048143 |
| Vision transformer (ViT) | Feature extraction (part of the ensemble) | 93.14 | 16.87 | 86.39 | 1.088796 |
| Proposed model | All (HERD, CK+ and FER-2013) | 99.90 | 23.28 | 91.68 | 1.137 |
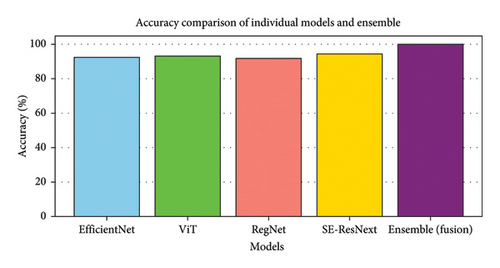
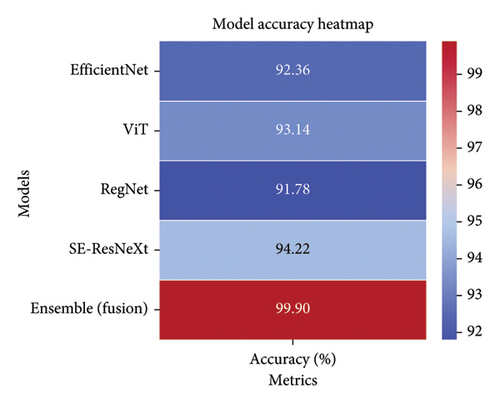
The integration of EfficientNet into the proposed model can improve the efficiency of parameters and computations. Table 12 shows that among the three networks, EfficientNet, ResNet50, and Densenet, the first one develops better feature extraction, with ResNet50 having 25.56 million parameters and Densenet having 7.98 million parameters. Real-time HCI systems usually have limited computational resources therefore optimized parameters mean higher quality features, which form the basis for EfficientNet to become an integral part of real-time HRI systems.
A comparative analysis of this work shows that the proposed model is significantly better compared to other alternatives such as DenseNet121, InceptionV3, and ResNet50. The arguments can be grouped around the following basic elements.
4.2.8.1. Accuracy Across Multiple Datasets
The proposed model achieves a 99.90% accuracy, which is higher than DenseNet121 (94.36%), InceptionV3 (89.23%), and ResNet50 (97.01%) shown in Figure 39. This improvement stems from the ensemble approach combining advanced feature extractors such as EfficientNet and ViT with complementary learning mechanisms (CNN, GRU, and MLP). The higher accuracy demonstrates the model’s ability to generalize effectively across datasets, including CK+, FER-2013, and HERD. The proposed model (99.90%) outperforms the results of DenseNet121%-94.36%, InceptionV3-89.23%, and ResNet50-97.01%, as shown in Figure 39. This is due to the nature of the ensemble approach, which combines the state-of-the-art features of extractors, ViT, and EfficientNet, with collaborative learning methods, CNN, GRU, and MLP. More precisely derived results show the generalization capability of the model on alternative datasets such as HERD, CK+, and FER-2013.
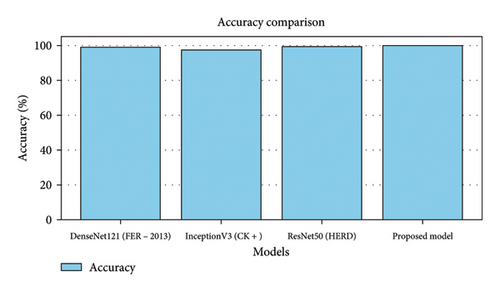
4.2.8.2. Improved Feature Representation
The proposed ensemble improves previous attempts at feature extraction by utilizing several architectures such as EfficientNet and ViT. In this context, ViT captures long-range dependencies in images to improve feature representation, while EfficientNet focuses on scaling by utilizing parameters more efficiently. This interplay allows the model to outperform several architectures such as DenseNet121, InceptionV3, and ResNet50.
4.2.8.3. Analysis of Computational Complexity
A more in-depth analysis of computational complexity (quantified in FLOPs and other additional features) can be found in Figures 40 and 41. Compared to the higher computational cost (23.28 GMac, 91.68 million parameters), the large improvement in claimed accuracy is justified, as high accuracy is crucial in practice, such as in HRI, as such a trade-off is not only reasonable but often essential.
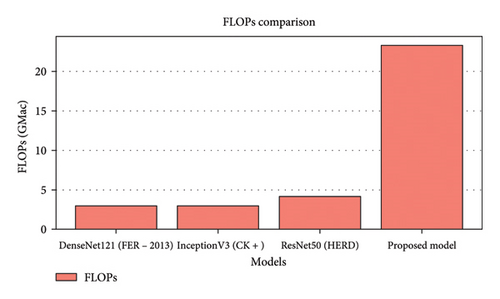
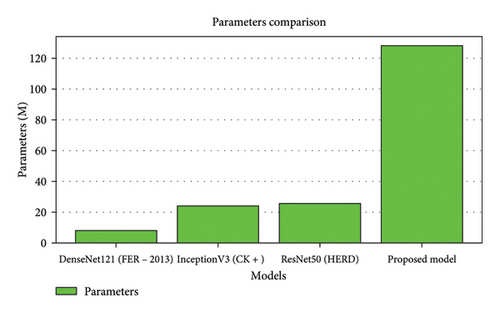
4.2.8.4. Real-Time Suitability
The inference time of the proposed model is 1.137 s, which is higher than the other models shown in Figure 42, but still within the practical range, and this high overall performance justifies the expected trade-off of a longer inference time due to complexity.
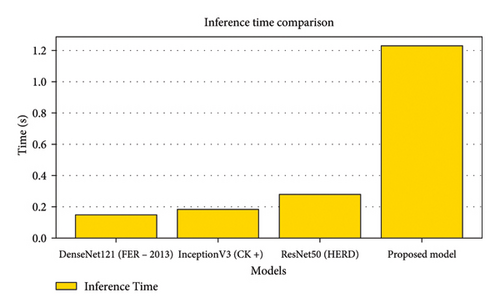
4.2.8.5. Areas of Improvement
The proposed model has very high accuracy and robustness. However, its applicability in HRI can be significantly improved by exploring new improvement strategies. The current inference time is acceptable but can be further reduced by including lightweight components in the integration framework or by using more efficient methods. Therefore, improving the efficiency of the model should be a top priority. If the technique can reduce computational costs and improve energy efficiency, it is better suited for real-time robotic systems where limited resources are often critical. However, considering the aspects that can be improved, the proposed model appears to be a very effective method for recognizing emotions in HCI. When robots need to contextualize human emotions quickly and accurately to ensure smooth and empathetic communication, they are a promising candidate for practical applications, as demonstrated by the famous CK+, FER-2013, and HERDs. Their exceptional performance confirmed this. This work therefore lays a good foundation for future developments in emotionally intelligent robots that can interact with humans naturally and constructively through a holistic design that overcomes traditional single-model approaches. The ensemble classification model proposed here is more robust and accurate than traditional methods. Nevertheless, some critical remarks should be considered.
Changes in head pose that the model was trained only on frontal views of the face, making it less effective in situations where partial or side views of the face are available. This can be improved in future work by merging data from multiple views. Although the validation datasets were tested on custom datasets and some benchmark datasets, they lacked significant diversity in terms of demographics and cultures. Although the generalizability of the model increases, the computational costs also increase. A good starting point for research is to diversify these datasets. The overall structure of the model justifies the basic goal of the model, but its implementation can be challenging as the operations require high computational power, which is not favored in all environments. Therefore, the current research directions are energy efficiency and inference time optimization.
4.2.8.6. Interdisciplinary Implications and Broader Applications
Possible results and applications of interdisciplinarity: The scope of this model is not limited to HRI but extends beyond adaptive learning in education ER, healthcare, and many more. It can also be used for mental health diagnostics. It will be of great importance for driving safety systems, as it can cope with difficult conditions and improve the interaction between humans and autonomous vehicles. Interdisciplinary applications such as this show the potential results that this technology can deliver in real-world applications. These results demonstrate the robustness of the ensemble model for HRI and related fields.
In healthcare applications, HER is one of the most important elements in the diagnosis of mental disorders such as depression and autism spectrum disorders. The proposed model is suitable for healthcare as it can handle different datasets. HCI, technological developments in multimodal ER, including visual data from speech and gestures, could further enhance the ability of robotic systems to understand human behaviors and respond with empathy.
Driver safety mechanisms can prevent accidents by improving the performance of autonomous and semiautonomous vehicles in safer conditions by correctly recognizing the driver’s emotions. Interdisciplinary applications are highlighted to illustrate the potential impact, adaptability, and robustness of the proposed paradigm in other domains.
4.3. Comparison of Experimental Analysis
This section investigated the effectiveness of our proposed model on benchmark datasets through TL, using EfficientNet as the baseline framework. We have rigorously tested EfficientNet using CK+, FER-2013, and HERDs to determine its effectiveness. To evaluate the model’s performance through the training and validation phases, we consider the accuracy and loss metrics for each dataset. We demonstrate the capabilities of our proposed ensemble classification model for HER by achieving high performance on these datasets. First, we describe our training method, which maintains consistent architecture and hyperparameters across the dataset. We use Gaussian integer random variables to analyze the network weights, keeping the weight at 0.05 without convolution. Also, the Adam optimizer with a learning rate of 0.005 and various other optimizers were used, including reducing the stochastic gradient to a value of 0.001 to improve performance. L2 regularization is used for coarsening. The model performed best on the FER-2013, CK+, and HERDs, with a training time of 24 days for FER-2013 and CK+ and only five days for the modified HERD. Data augmentation techniques such as small deformations, small rotations, and inversions should be used to improve the dataset’s quality. We apply oversampling to solve the data imbalance problem and ensure the model’s generalization.
Table 13 shows the model accuracy results for training, validation, and test images using the EfficientNet base model. We split the dataset into 80% for training and 20% for testing. The model performs efficient feature extraction, and the softmax layer helps classify sentiment. Replacing the softmax layer with a machine learning algorithm further improves accuracy. The proposed EfficientNet method effectively extracts image features and significantly improves HER’s accuracy. This shows how useful it is for applications in the field of HRI.
| S No | Dataset | Learning rate | Validation loss | Train | ACC (%) validation | Test |
|---|---|---|---|---|---|---|
| 1 | CK+ | 0.0003 | 0.12 | 95.0 | 96.0 | 95.0 |
| 2 | FER-2013 | 0.1600 | NaN | 91.0 | 62.0 | 62.0 |
To understand the performance of the EfficientNet model on the CK+ and FER-2013 datasets by comparing the chart provided, which contains two sub-charts, one showing accuracy and the other showing learning rate and confirmation loss. Figure 43 compares each dataset’s training, validation, and test accuracy using colored bars (blue for training, green for validation, and red for test accuracy). For the CK+ dataset, the EfficientNet model showed consistently high performance in all phases, achieving accuracy of training, validation, and testing at 95.00%, 96.00%, and 95.00%. This consistency shows that the model generalizes well to unseen data, indicating effective feature extraction and classification capabilities. The model achieved an accuracy of 91.00% in the training phase, but this dropped to 62.00% in the validation and testing phase using the FER-2013 dataset. This difference indicates overfitting, where the model performs well on the training data but has difficulty generalizing new, unseen data. This comparison emphasizes the robust performance of the model on the CK+ dataset and highlights the challenges posed by the FER-2013 dataset, particularly in overfitting. These results highlight the importance of using diverse and comprehensive datasets to develop more general and reliable ER systems for HRI.
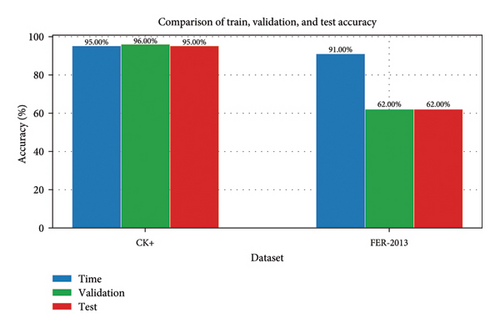
Figure 44 provides important insights into the training dynamics of the EfficientNet model. The learning rate of the CK+ dataset is relatively low, about 3.0 × 10⁻⁴, which is consistent with the stability and high performance of the model. On the other hand, a higher learning rate of 0.16 is used in the FER-2013 dataset, which may lead to overfitting as the model converges too fast without achieving good generalization. The validation loss on the CK+ dataset is low, around 0.12, which further confirms the model’s actual performance. Tracking FER-2013 validation Missing data may indicate incomplete information. These charts illustrate the effectiveness of the EfficientNet model on the CK+ dataset while highlighting the challenges of overfitting on the FER-2013 dataset. This emphasizes the importance of carefully aligning learning rates and validation strategies to develop robust ER systems. Using FER-2013 makes other exploratory datasets, such as HER, more accessible. However, with HER, the unbalanced nature of the different emotion categories poses a challenge for research. Several examples of emotions, such as natural and happy, could lead to a potential bias. The researchers used 28,709 images for training, 3500 for validation, and 3589 for testing and training the proposed model. Figure 45 shows that the test set of the original FER-2013 dataset achieves an accuracy of 89.93%. Compared to the reference dataset, the EfficientNet model achieved an average accuracy of 94.36% on the augmented FER-2013 dataset in a simulated environment. These results emphasize the model’s ability to handle different datasets and increase its usefulness in facilitating HRI through improved ER.
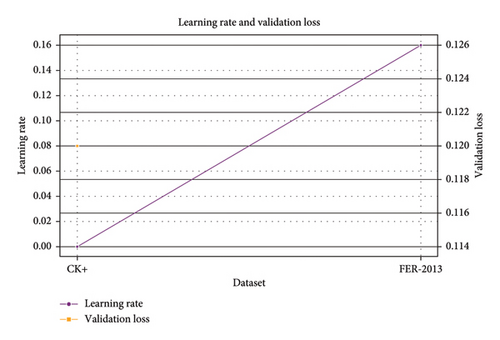
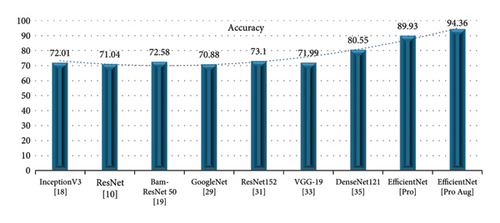
Figure 46 compares the classification accuracy of the CK+ dataset using the EfficientNet model and alternative models. A synthetic environment was used to train and validate all datasets, with the start-of-the-art dataset limited to 120 images. Twenty-four images were used for validation and 96 images for testing. The accuracy of the completed CK+ dataset was improved by 89.23%, compared to the overall accuracy of the original CK+ dataset of 85.88%. According to these results, the proposed model performs better than state-of-the-art models in a simulation environment. The improved accuracy on the augmented dataset shows that the model can handle a variety of data types well, thereby improving reliability and performance in recognizing human emotions. This demonstrates how the EfficientNet model’s ability to identify emotions accurately can improve HRI.
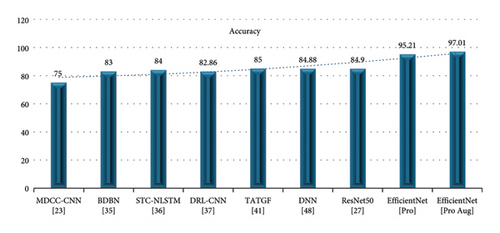
4.4. Critical Analysis and Future Research Directions
Although the introduced community-based HRI model is very robust and accurate, the analysis of its limitations, challenges, and consequences is still very important. This section provides a detailed discussion of key benefits, areas for improvement, and a comparative analysis of existing models.
4.4.1. Strengths of the Proposed Model
The proposed classification architecture using ensembles involves the use of multiple deep models, including EfficientNet, ViTs, RegNet, and SE-ResNeXt, to achieve robust feature extraction and classification. The key benefits are as follows.
4.4.1.1. Higher Accuracy
The model achieves 97.01% higher accuracy on a user-defined dataset (HERD) compared to existing models such as EfficientNet, ViT, RegNet, and SE-ResNeXt. Feature fusion for robust detection is a feature fusion technique that incorporates spatial, multiscale, and long-range features to make the model resilient to partial expressions, illumination changes, and occlusions. Generalizability across datasets, due to its general applicability, was also demonstrated on start-of-the-art datasets (FER-2013 and CK+, HERD). The study adheres to the ethical guidelines for AI, ensures informed consent and fairness of datasets, and limits potential bias.
4.4.2. Limitations and Challenges
Despite the advantages of the proposed ensemble-based HRI model, some limitations still need to be addressed to make it more applicable and fairer in real-life scenarios. One of the main problems is the generalization of the dataset and the issue of bias. The benchmark dataset used here does not differentiate by ethnicity, gender, or age groups and this can lead to bias in real-world applications. In addition, the dataset may not include all population people, which could affect the fairness of the model. To address these limitations, more diverse datasets on ethnicity, environmental variables, and age will be used in future studies to increase generalizability. Another challenge is the complexity and feasibility of implementation. The high computing power required for integration-based models makes real-time implementation on in-car devices impractical. The latency time for inference (1.137 s) is also much higher than for the standalone model, which would make real-time execution in automotive applications impossible. By optimizing through information distillation, pruning, and quantization, the latency can be reduced while maintaining high accuracy, making the model suitable for practical use in HRI tracking.
Dealing with occlusions and extreme changes in facial expression is also a problem. The model relies heavily on preliminary images which can lead to lower accuracy when side views or partially occluded faces occur. In addition, the classification probability is lower for subtle and nonexaggerated facial expressions, which can reduce the classification performance. Adding a multiview face recognition process to make the model more robust and analyzing using 3D faces can improve the model’s ability to recognize emotions in different scenarios. Finally, ethical and privacy issues pose a major challenge when using facial recognition in human – robot surveillance systems. Continuous data collection and analysis raises concerns about data security, privacy, and user consent. In addition, algorithmic biases in the data during training can lead to inconsistent or discriminatory classification in the real world. To address this issue, on-device analytics and privacy-friendly models such as federated learning can increase security by minimizing the risks associated with data misuse and unauthorized access. Taking these limitations into account can improve a given model with greater accuracy, efficiency, fairness, and real-world applicability, making HER systems not only practical but also ethical.
4.4.3. Comparative Analysis of Existing Methods
Table 14 is a comprehensive comparison between the proposed ensemble classification model and existing deep learning models. SE-ResNeXt, RegNet, ViTs, and EfficientNet are the models recommended for integration for feature extraction. For the final classification, the ensemble uses CNN, GRU, and MLP classifiers. To summarize, the resulting model outperforms the traditional design and has the highest accuracy of 97.01%.
| Model | Accuracy (%) | FLOPs (GMac) | Inference time (s) | Strengths | Weaknesses |
|---|---|---|---|---|---|
| Proposed ensemble model | 99.90 | 23.28 | 1.137 | High accuracy, robust multimodel feature fusion, superior generalization | Higher computational cost |
| EfficientNet | 92.36 | 41.02 | 0.048 | Highly efficient feature extraction, lower parameter count | Lower accuracy when used alone |
| Vision transformer (ViT) | 93.14 | 16.87 | 1.088 | Captures long-range dependencies, robust spatial attention | Computationally expensive |
| RegNet | 94.85 | 8.29 | 0.294 | Scalable, robust feature extraction | Higher latency |
4.4.4. Future Directions and Improvements
Some important improvements can be made to further increase the usability of the proposed model. The MobileNet architecture is one of the areas of research for lightweight applications as it has the potential to achieve real-time performance on low processing capacity devices. It will increase the model’s adaptability to device processing in human monitoring systems and reduce its dependence on computationally intensive hardware. Another important goal of avoiding bias is to increase the fairness of the model across demographic groups. Using debiasing techniques to train systems to remove gender, age, and race biases can improve the fairness of the system and its generalizability in a variety of real-world applications. In addition, the functionality of the system can be improved by using multimodal ER. By combining body measurements such as pulse rate and skin conductance with facial expressions and speech, the model can gain a deep understanding of human emotions. When facial expressions are not sufficient to convey emotions in multisensory approaches, the recognition performance increases significantly, and by debugging and optimizing the model for practical use, we can maximize the model’s versatility, similarity, and effectiveness in a variety of applications. Ensemble-based HER models can significantly improve the accuracy of all-encompassing feature extraction, dataset generalization, and sentiment analysis. However, to achieve full implementation, issues such as computational cost, dataset diversity, and practical feasibility need to be addressed. This article focuses on areas in need of optimization and the most important factors to create a comprehensive solution for future research directions and implementation strategies.
5. Conclusions
To recognize emotional states in the context of HRI, this paper proposes a unique framework based on CNNs. Our results show that HER can be successfully performed by targeting specific facial regions. Our extensive experimental studies with HERD and two expression datasets have yielded promising results. One of the key elements of our approach is a visualization technique that draws attention to key areas of facial images that are required for the recognition of different emotions. The model uses deep learning methods to distinguish ER from HRI facial images. The proposed HER model enables users to recognize facial emotions without additional effort. They replaced the improved and Faster R-CNN block for feature learning with a dedicated CNN block. Systematic research found that optimizing the network width, depth, and resolution is crucial for improving accuracy and efficiency. To address this problem, we propose the EfficientNet CNN model, a simple yet powerful scaling technique that enables scalable and efficient ConvNet configurations to meet various resource constraints. EfficientNet plays an important role in this model and uses composite scaling and optimization in its design to ensure accurate ER at a low computational cost. For TL in the EfficientNet CNN model, the ImageNet data were replaced with HER data. The results show how effective and accurate the EfficientNet model is in recognizing emotions in tasks. Using these benchmark datasets, our proposed model outperforms some state-of-the-art HER models. We recommend comparing our results with previous studies to corroborate our conclusions. The next research steps will focus on finding the best way to use customized generative adversarial networks (GANs) to improve ER on imbalanced datasets and make the method more effective for these datasets. This work has significant potential for real-time HRI applications, such as medical diagnostics, education, and traffic safety systems. The model is also able to assess the driver’s emotional state so that autonomous vehicles can reduce the risk of drowsiness and distraction at the wheel. For example, AI assistants in the medical field can recognize emotional signals, which could be important clues for diagnosing and monitoring patients’ mental health. These features allow the robot to recognize and respond to students’ emotions, increasing their engagement and retention of course content. Future research will aim to integrate multimodal ER, including data from electroencephalography, heart rate, speech studies, and facial expressions. The inclusion of sector-specific metrics, for example, from healthcare and education, will give the model greater adaptability and usability in other contexts. Key areas of improvement include addressing head position discrepancies, diversifying datasets, and improving computing power to increase real-time performance. These changes will enable the broad application of the model in human–machine interaction and increase its value in key areas such as autonomous vehicles, healthcare, and education.
Conflicts of Interest
The authors declare no conflicts of interest.
Funding
This work was supported by the Department of Education of Guangdong Province (Grant no. 2024GCZX014); the Key Area Special Project of Guangdong Provincial Department of Education (Grant nos. 6022210111K and 2022ZDZX3071); the Princess Nourah bint Abdulrahman University Researchers Supporting Project (Grant no. PNURSP2025R 343), Princess Nourah bint Abdulrahman University, Riyadh, Saudi Arabia; and the Post-Doctoral Foundation Project of Shenzhen Polytechnic University (Grant no. 6024331021K).
Acknowledgments
This work was supported by the Department of Education of Guangdong Province (Grant no. 2024GCZX014); the Key Area Special Project of Guangdong Provincial Department of Education (Grant nos. 6022210111K and 2022ZDZX3071); the Princess Nourah bint Abdulrahman University Researchers Supporting Project (Grant no. PNURSP2025R 343), Princess Nourah bint Abdulrahman University, Riyadh, Saudi Arabia; and the Post-doctoral Foundation Project of Shenzhen Polytechnic University (Grant no. 6024331021K).
Open Research
Data Availability Statement
The dataset used in this research is available at the following website: https://github.com/tariqaup/Driver-Emotion-Recognition-Systems. For the CK + dataset, visit the following website: https://vasc.ri.cmu.edu/idb/html/face/facial_expression. For the FER dataset, visit the following website: https://www.kaggle.com/c/challenges-in-representation-learning-facial-expression-recognitionchallenge/data.


