ARIMA-Based Virtual Data Generation Using Deepfake for Robust Physique Test
Abstract
Physique testing plays a crucial role in health monitoring and fitness assessment, with wearable devices becoming an essential tool to collect real-time data. However, incomplete or missing data from wearable devices often hamper the accuracy and reliability of such tests. Existing methods struggle to address this challenge effectively, leading to gaps in the analysis of physical conditions. To overcome this limitation, we propose a novel framework that combines ARIMA-based virtual data generation with deepfake technology. ARIMA is used to predict and reconstruct missing physique data from historical records, while deepfake technology synthesizes virtual data that mimic the physical attributes of the test subjects. This hybrid approach enhances the robustness and accuracy of physique tests, especially in scenarios where data are incomplete. The experimental results demonstrate significant improvements in the accuracy and reliability of data prediction and test reliability, offering a new avenue to advance the monitoring of health and fitness.
1. Introduction
In recent years, wearable devices have gained significant popularity because of their ability to monitor various physiological parameters in real time. These devices are widely used in fitness tracking, healthcare, and personalized medicine, providing valuable insights into a person’s physical condition [1–3]. By continuously recording data such as heart rate, body temperature, physical activity, and sleep patterns, wearable devices offer a convenient and noninvasive way to assess and improve overall health. However, despite their increasing usage and technological advancements, wearable devices face several challenges that hinder their effectiveness, particularly when it comes to accurate physical tests and health assessments [4, 5]. One of the primary challenges is the occurrence of missing or incomplete data, which often arises due to sensor malfunctions, user compliance issues, or environmental factors. Such data gaps can lead to unreliable results and limit the usefulness of physique tests for long-term health monitoring and fitness assessments.
The importance of physical examination goes beyond fitness tracking; it plays a crucial role in diagnosing potential health risks, managing chronic diseases, and tailoring personalized training programs [6–8]. Accurate and reliable data are essential to understand an individual’s physical condition, and missing data can undermine the integrity of this process. For instance, in high-stakes environments such as sports performance or rehabilitation, the ability to continuously monitor and evaluate physical metrics without interruptions is critical for ensuring optimal outcomes [9]. As such, there is a growing need for methods that can address data incompleteness and improve the robustness of physique testing.
Various approaches have been proposed in recent studies to handle missing data in wearable devices. Traditional methods, such as imputation techniques and statistical interpolation, attempt to fill in missing values based on the available data [10]. While these methods have some success in certain applications, they often fall short when the missing data are substantial or when the underlying data patterns are complex. Furthermore, these methods may introduce bias or fail to capture the temporal dependencies inherent in many physiological measurements [11]. Therefore, a more sophisticated approach is needed to accurately predict missing physique data and ensure reliable health monitoring.
This paper proposes a novel framework that integrates AutoRegressive Integrated Moving Average (ARIMA)–based virtual data generation with deepfake technology to address the challenges of incomplete or missing data in physique testing. The goal of this framework is to improve the robustness, accuracy, and reliability of physique tests, particularly in cases where real-world data are incomplete or sparse. The ARIMA model is employed to predict missing data based on historical physique measurements, capturing the temporal dependencies in the data. Simultaneously, deepfake technology is used to generate synthetic data that align with the real data, augmenting the dataset and enhancing the overall accuracy of the test. By combining these two approaches, we aim to create a hybrid system that not only predicts missing data with high precision but also generates realistic virtual data to complement the real-world measurements.
The contribution of this research is twofold. First, we demonstrate the effectiveness of ARIMA in predicting missing physique data, showing how time-series models can improve the reliability of wearable device-based health assessments. Second, we explore the application of deepfake technology for virtual data generation in the context of physique testing, highlighting its potential to augment real-world data and provide a more robust testing environment. Through experimental validation, we show that our proposed hybrid approach significantly improves the accuracy and consistency of physique tests, making it a valuable tool for monitoring health and fitness.
This paper is organized as follows. Section 2 presents the related work, discussing previous studies on physique testing, data prediction, and virtual data generation techniques. Section 3 outlines the methodology of our proposed approach, including the ARIMA model for time-series prediction and the use of deepfake technology for virtual data generation. Section 4 presents the experimental setup and results, showing the improvements achieved by our hybrid framework. Section 5 concludes the paper with a summary of the key findings and suggestions for future research.
2. Related Work
2.1. Physique Testing and Data Collection Using Wearable Devices
The study [12] evaluates the feasibility and accuracy of wearable devices for continuous monitoring of vital signs in patients undergoing lung cancer surgery. It focuses on data collection related to heart rate, oxygen saturation, and body temperature, comparing these parameters between different wearable devices. The results show that the wearable devices provide continuous and reliable monitoring, which can aid in the early detection of postoperative complications. The study presented in [13] focuses on the development of an intelligent wearable sensor system aimed at early detection of lumpy skin disease (LSD) in cattle. By integrating IoT technologies, the system is capable of collecting real-time physiological data, such as body temperature and heart rate, with the aim of improving disease detection accuracy. This approach reduces the need for frequent veterinary check-ups and promises to improve livestock disease management practices. In [14], the research examines the application of wearable devices to monitor cardiorespiratory responses in athletes during physical exertion. Leveraging time-series data analysis, the study explores how wearable technologies can track physiological changes throughout exercise, offering valuable insights to optimize athlete performance. By integrating these wearable devices with traditional fitness tests, the research aims to refine and increase the precision in performance tracking.
A groundbreaking method for noninvasive blood glucose monitoring is proposed in [15]. Using wearable sensors combined with photoplethysmography (PPG), the study decodes PPG signals to estimate blood sugar levels in diabetic patients. This noninvasive approach to glucose monitoring is expected to improve diabetic care, providing continuous and hassle-free blood sugar management via wearable technology. In [16], the “Motion Shirt,” a specialized wearable device, is introduced to track upper limb movements in patients recovering from shoulder joint replacement surgery. By collecting motion data from various regions of the body, the device enables a comprehensive analysis of the patient’s rehabilitation process. Validation studies confirm the accuracy and reliability of the data, establishing the Motion Shirt as an essential tool for long-term recovery monitoring. Research in [17] introduces an innovative hybrid energy harvesting system designed to power wearable biosensors. Combining piezoelectric and electrostatic harvesting techniques, the system generates energy from natural body movements, extending the operational lifespan of wearable devices. Experimental data reveal the potential for uninterrupted use of medical biosensors without the need for external power, thus increasing their practicality and convenience in real-world applications.
2.2. Time-Series Forecasting for Missing Data Prediction
The work in [18] conducts an extensive evaluation of various imputation strategies to handle missing values in time-series prediction. It emphasizes that conditional imputation techniques outperform others, particularly when data gaps are substantial, leading to significant improvements in predictive accuracy for incomplete time-series datasets. In [19], the authors address the challenge of missing dynamics in time-series forecasting using machine learning methods. Their approach reconstructs hidden patterns from historical data, allowing for more accurate predictions even when key information is missing. This framework shows clear improvements in forecasting tasks involving incomplete data. Research in [20] introduces a hybrid model that integrates ARIMA, a traditional statistical method, with deep learning models like LSTM to predict long-term air pollution trends. To handle missing data, a unique univariate imputation technique is proposed, which enhances the model’s resilience in real-world scenarios where data can often be incomplete. When applied to air quality data, this hybrid approach significantly outperforms individual models, offering a more robust solution by combining the strengths of both statistical and machine learning methods. Its practical implications extend to urban planning and public health, where accurate air quality forecasting is essential for policy decisions. The study in [21] presents a Bayesian temporal factorization model designed to manage missing values in multidimensional, large-scale time series. By combining Bayesian inference with temporal dynamics, the model achieves higher forecasting accuracy and provides a powerful tool for imputing missing data across a wide range of datasets.
In [22], the authors present a semisupervised generative learning model designed to address missing values in multivariate time-series data. The approach employs an iterative learning process, in which missing data are imputed while simultaneously improving prediction accuracy. A generative adversarial network (GAN) is the core of this model, generating plausible data points by learning from the distribution of available data. This method proves particularly effective for multivariate time series, where interactions between variables are complex. Demonstrated on healthcare and financial datasets, this approach significantly surpasses traditional imputation techniques, capturing intricate data structures and temporal dependencies with greater precision. The study in [23] introduces a neural gate controlled unit (NGCU), a cutting-edge RNN architecture for predicting time-series data. To manage missing data, the authors opt for a straightforward strategy—filling gaps with average values—ideal for cases with limited data. NGCU is compared against RNN, LSTM, and GRU models, showcasing its superiority in capturing long-term dependencies and maintaining robustness even when data are incomplete. This model excels in domains such as financial forecasting and environmental monitoring, where missing data frequently arise. By integrating imputation directly into its architecture, NGCU enhances prediction accuracy, making it a valuable tool in data-scarce environments. ImputeGAN, a GAN that aims to handle missing data in multivariate time series, is the focus of [24]. The model generates realistic values to fill in the missing entries, thus improving the predictive power of the forecasting models. The authors showcase the effectiveness of ImputeGAN on long, multivariate datasets, demonstrating its strength in handling incomplete data and significantly improving forecasting accuracy over conventional methods. In [25], the authors explore the use of graph neural networks (GNNs) for imputing missing values in multivariate time-series data. Their proposed framework leverages the relational structure among variables, modeling the time series as a graph to predict missing data. This method diverges from traditional models by capturing the interactions between variables, offering more accurate imputations. The framework proves highly applicable in sensor networks and healthcare, where interdependent and often incomplete data are common. The results reveal that GNN-based imputation outperforms methods like vector autoregression (VAR), particularly in cases where large portions of data are missing over extended sequences.
2.3. Virtual Data Generation and Deepfake Technology in Health Monitoring
The paper [26] delves into the use of deepfake technology beyond its controversial beginnings, particularly within livestock farming. Traditionally known for creating synthetic videos, deepfake technology is repurposed here to generate virtual stimuli that mimic specific animal health conditions. This enables more accurate monitoring and early disease detection. Using AI-generated data, veterinarians can simulate various health scenarios to train machine learning models to detect abnormalities. The study emphasizes the transformative potential of virtual data to refine precision in animal health monitoring and hints at broader applications in human health, such as enhancing medical training and advancing telemedicine capabilities. Although the paper [27] primarily addresses the risks associated with deepfake technology, it also explores its potential for generating virtual data for health monitoring. The authors provide a detailed analysis of deepfake creation algorithms and the detection mechanisms used to combat their misuse. In health applications, synthetic data could be used to simulate medical conditions, improving diagnostic models. However, the authors stress the need for ethical oversight to prevent misuse. The paper concludes by advocating for a balanced approach—harnessing the benefits of deepfake technology in healthcare while protecting against its potential threats.
In [28], a case study is presented that focuses on the generation and detection of deepfakes, highlighting the technical hurdles in both the creation and identification of synthetic media. Specifically, the authors propose that deepfakes could be leveraged to build training datasets for medical AI systems, improving their ability to recognize rare or underrepresented medical conditions. However, the study also warns about risks, such as manipulation of health records or patient data, which could erode trust in healthcare systems. It calls for the development of robust detection tools to ensure that fake technology is ethically used within the medical field. Paper [26] investigates the use of deepfake technology in livestock farming but extends its implications to broader health monitoring in both animals and humans. The study highlights how virtual stimuli, generated by deepfakes, could be instrumental in improving health monitoring systems by simulating a variety of health conditions and behaviors. The synthetic data produced could strengthen the capacity of machine learning models to detect health anomalies, particularly in telemedicine and remote health settings. This virtual approach could reduce the reliance on invasive monitoring, allowing for more advanced simulations in diagnosis and treatment planning. Although focused on livestock, the findings are equally relevant to human healthcare, showcasing the potential for AI-driven systems to become more robust and effective in detecting complex health issues.
3. Methodology
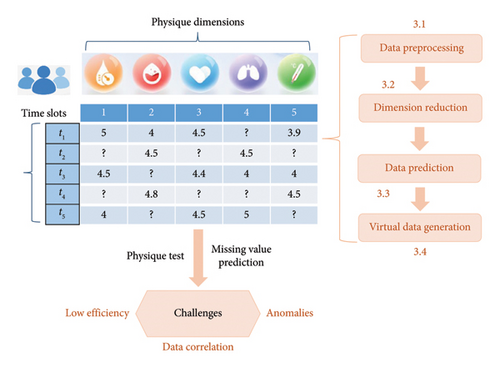
This section provides a comprehensive explanation of the steps involved in the methodology, which includes data preprocessing, dimensionality reduction, missing data prediction using ARIMA, and virtual data generation through deepfake technology. The concrete research framework of our proposal is illustrated in Figure 1. The entire process in Figure 1 is designed to ensure robustness and accuracy in physique testing, especially when dealing with missing or incomplete data from wearable devices. In concrete, data preprocessing step is performed in Section 3.1 to eliminate possible noise data and unify data formats; in Section 3.2, the principal component analysis (PCA) technique is applied for several reasons: (1) After preprocessing, the data might contain features that are highly correlated with each other, leading to redundancy. For example, in health data, measurements like heart rate and blood pressure can show correlated patterns. PCA helps by transforming these correlated features into a smaller set of uncorrelated principal components, which reduces redundancy and improves model performance; (2) high-dimensional data can increase computational complexity and may lead to overfitting, where the model learns noise instead of meaningful patterns. By reducing the dimensionality, PCA helps in lowering the number of features the model needs to process, thus making the learning process more efficient and less prone to overfitting; (3) Data after preprocessing might still contain noise, especially when dealing with complex real-world data like health monitoring data. PCA can help filter out noise by focusing on the components that explain the most variance in the data, leaving less important, noisy components behind.
3.1. Data Preprocessing and Outlier Removal
The data collected from wearable devices typically contains noise, inconsistencies, and sometimes outliers due to sensor errors, user behavior, or environmental factors. To ensure reliable results, raw data must be preprocessed, and any outliers must be removed before applying the prediction and virtual data generation techniques.
Outliers can significantly affect the performance of predictive models by distorting the learning process [31, 32].
3.2. Dimensionality Reduction to Eliminate Feature Correlation (Using PCA)
In high-dimensional datasets, features are often correlated, leading to redundancy and inefficiency in data representation [33–35]. To clarify, PCA is used in our study to reduce dimensionality and decorrelate features that exhibit linear dependencies. For example, in the context of health monitoring using wearable devices, features such as heart rate, blood pressure, and activity level often exhibit correlation. These correlations can introduce redundancy and multicollinearity issues, which can affect the performance of predictive models. To provide a concrete example, consider the case where both heart rate and activity level increase during physical exercise, leading to a positive correlation between these features. By applying PCA, we transform these correlated features into a set of linearly uncorrelated components. This transformation effectively separates the shared variance (due to physical activity) from the unique variances of each feature, allowing us to analyze the independent effects of each physiological signal more accurately. This process of reducing feature correlation helps simplify the models, improve interpretability, and potentially improve predictive performance by focusing on the principal components that capture the most significant variance in the data, thereby eliminating redundancy and improving model efficiency.
Please note that PCA works by identifying the directions (called principal components) in which the data vary the most. It does this through the covariance matrix, which captures the relationship between different dimensions (or features) in the data. The covariance matrix measures how much two dimensions change together. If the covariance is high between two dimensions, they are strongly correlated. PCA aims to reduce the dimensionality by transforming the original features into a new set of uncorrelated components (principal components). The key here is that PCA removes linear correlations between features, as it finds the orthogonal axes that best capture the variance in the data. When PCA is applied, each principal component represents a combination of the original features that are not correlated with each other. Here, in terms of data dimension correlations that can be eliminated by PCA, we can have the following analyses: (1) PCA can remove certain kinds of dimension correlation, specifically linear correlations. This is because the covariance matrix represents the linear relationships between the features, and PCA uses the eigenvalues and eigenvectors of this matrix to transform the data into a set of orthogonal (uncorrelated) components. In essence, PCA rotates the feature space in such a way that the resulting components (principal components) are uncorrelated. Suppose that there are two features: height and weight, which are correlated because taller individuals tend to weigh more. The covariance matrix will show a high covariance between these two features. PCA will then find the direction of maximum variance (which is along the diagonal of the covariance matrix) and project the data into a new space where height and weight are no longer correlated. The new principal components will be uncorrelated. (2) If there are two features that have a nonlinear relationship, such as X and Y, where Y = X2, PCA will not be able to fully remove this type of correlation. Although PCA can capture the variance along the main direction (the axis of maximum variance), it will not transform the data in a way that removes the nonlinear dependence between X and Y.
3.3. Missing Data Prediction Using ARIMA
One of the key challenges in physique testing is dealing with missing or incomplete data. In this section, we apply the ARIMA model to predict the missing values based on the historical data patterns. Although there are already many prediction solutions for missing or incomplete data in data-driven smart applications [36–40], we argue that the ARIMA model has unique advantages, which are briefly explained as follows: (1) ARIMA is particularly well-suited for time-series data where future values are dependent on past observations. In the context of wearable devices, physiological data like heart rate, step count, or blood pressure often exhibit temporal dependencies, making it a natural choice for predicting missing data based on historical trends; (2) ARIMA is relatively simple and computationally efficient. Given the potentially real-time nature of data collection from wearable devices, ARIMA offers a good balance between accuracy and computational efficiency, particularly in scenarios where resources are limited or quick predictions are needed; (3) ARIMA can be easily adapted to different types of time-series data with varying patterns (e.g., seasonal, trend-based). This flexibility allows it to model and predict missing values even when the data exhibit nonstationary behaviors, which is common in health monitoring scenarios.
- •
ACF measures the correlation between xt and xt−k for different lags k
- •
PACF measures the correlation between xt and xt−k after removing the influence of intermediate lags.
3.4. Virtual Data Generation Using Deepfake Technology
In addition to predicting missing values, we generate virtual physique data to augment the real data. Deepfake technology, which leverages generative models such as GANs, is used to synthesize realistic virtual data that mimic the distribution of the real data. The advantages of using deepfake in a health condition monitoring context can be summarized briefly as follows: (1) Deepfake technology fills gaps in incomplete or missing data from wearable devices, ensuring more accurate and reliable physique tests; (2) it enriches the dataset by generating synthetic data that mimics real-world variations, improving the model’s robustness and generalization capabilities; (3) generating synthetic data avoids privacy and security issues associated with using sensitive real health data; (4) synthetic data allow testing under a broader range of conditions than might be available with real data alone, supporting comprehensive testing and analysis.
The augmented dataset Xaugmented is used for the final physique test, ensuring robustness even in the presence of incomplete real-world data. The combination of predicted and virtual data improves the accuracy and consistency of the physique test, providing more reliable results for health monitoring and fitness assessments.
4. Evaluation
In this section, we perform a series of experiments to show the effectiveness of the method.
4.1. Experimental Configuration
In the evaluation part, we use WS-DREAM 2.01 to simulate the user physique test. The dataset records the performances on different metrics (here, we only use the data about throughput metric) of 4532 objects accessed by 142 users at 64 time slots. Therefore, we can use it to simulate the physique data of 142 users over 4532 health dimensions at 64 time slots. Since the dataset is very dense (approximately 100%), we randomly delete partial records to simulate the data sparsity issue in physique test applications. More formally, we use sparsity (%) to represent the sparsity degree of the user-physique-time matrix in WS-DREAM 2.0. More concretely, if the matrix density is 10%, then the corresponding sparsity would be 90%. Moreover, we use the records of previous T-1 time slots to predict the missing record of the Tth time slot. The final prediction results are used to calculate the prediction performances such as MAE and RMSE. Regarding the experiment comparisons with related literature, we select three SOTA baselines in the same field: (1) SerRectime-LSH [10]; (2) U-RCF [41]; (3) CPA-CF [42].
The experimental setup is detailed as follows: (1) Hardware: The system used included a 2.60 GHz CPU and 8.0 GB of RAM; (2) software: Windows 10 operating system and Python version 3.6. Each experiment was carried out 100 times to ensure reliability, with the final results reflecting the averaged results in all trials.
4.2. Experiment Results
In total, we have implemented three groups of experiments to record and observe the performance of our proposal with the remaining three methods.
4.2.1. Accuracy Comparison With Related Methods (w.r.t. Data Sparsity)
The algorithm performance especially the accuracy is an important performance evaluation metric for our proposal as well as other prediction methods. In addition, from the perspective of information theory, more data often means more useful information for any information system [43–45]. Inspired by such observations, we first evaluate the accuracy performance of four methods with respect to the data sparsity of the user-physique time matrix. Here, the sparsity value is changed from 30% to 90%; parameter T is set 64. The number of users is equal to 142, and the number of health dimensions is equal to 4532. The concrete results are shown in Figures 2 and 3.
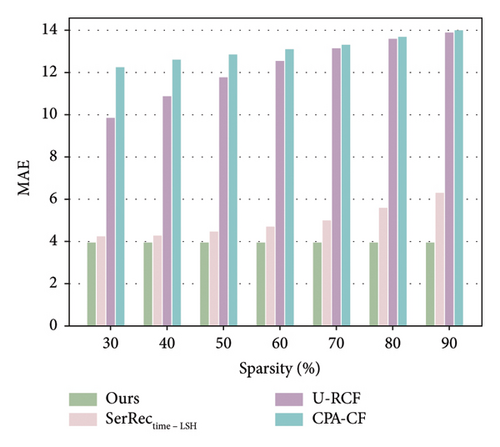
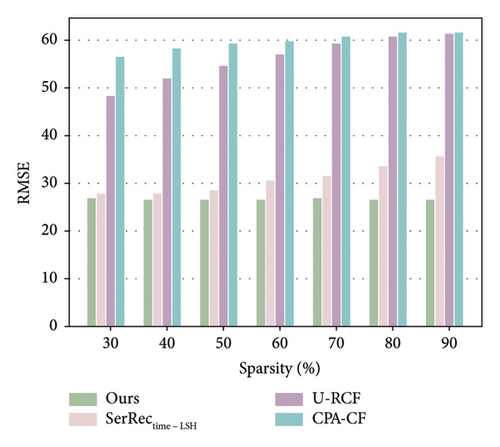
As illustrated in Figures 2 and 3, the MAE and RMSE values for the methods U-RCF, CPA-CF, and SerRectime-LSH all rise as matrix sparsity increases. This trend occurs because, with fewer user-physique-time records, the matrix holds less meaningful information; consequently, the accuracy of physique test decreases, causing higher MAE and RMSE values. In contrast, our proposed method maintains a more stable accuracy despite varying levels of matrix sparsity, showcasing its robustness in sparse data environments. Furthermore, the MAE and RMSE values for our work are consistently lower than those of the other methods, owing to our effective integration of ARIMA and PCA techniques, which ensures high accuracy even under significant data sparsity.
4.2.2. Accuracy Comparison With Related Methods (w.r.t. Number of Time Slots)
As analyzed in this section, we use the records of previous T-1 time slots to predict the missing record of the T time slot. Therefore, the parameter T probably influences the performance of various methods, including ours and other baselines. Motivated by such a hypothesis, we conducted a set of experiments to observe and analyze the fluctuation trend of the accuracy performance of different methods with respect to the parameter T. Here, the sparsity value is set 90%; parameter T is changed from 20 to 64. The number of users is equal to 142, and the number of health dimensions is equal to 4532. The concrete results are shown in Figures 4 and 5.
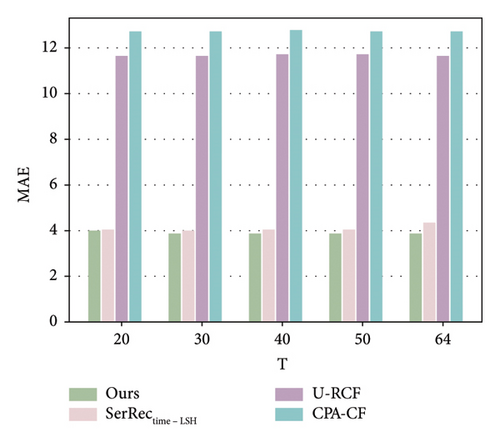
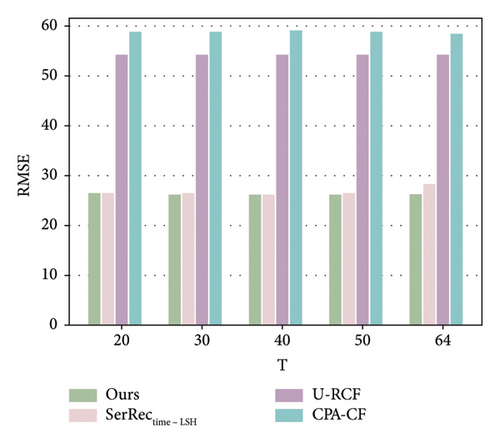
As demonstrated in the two figures, we have the following three observations. First, the accuracy of SerRectime-LSH decreases with the growth of the T value, because it becomes more difficult to find similar timeslots when there are too many time slots in the user-physique-time matrix. Second, for the U-RCF and CPA-CF methods, their MAE and RMSE values do not obviously fluctuate since the average idea (i.e., the MAE and RMSE values are not related to T values directly) for finding similar neighbors is adopted in these two methods, which indicate a stable accuracy performance with respect to the number of time slots used for missing data prediction. Third, similar to U-RCF and CPA-CF, our method also achieves stable accuracy performance when parameter T varies; however, the MAE and RMSE values of our method are much lower than those of the U-RCF and CPA-CF methods, indicating a better accuracy performance of our method in physique test.
4.2.3. Time Cost With Related Methods
Efficiency is often a key evaluation criterion for information systems with massive data [46–48]. Therefore, we also need to observe and analyze the time efficiency of different methods, since physique test also involves a large volume of health data accumulated over time. Inspired by such a hypothesis, we design a set of experiments to achieve the above performance evaluation goal. In concrete, we vary the values of parameters sparsity and T and observe the variance of time costs for different methods. Here, the sparsity value is changed from 30% to 90%; parameter T is changed from 20 to 64. The number of users is equal to 142, and the number of health dimensions is equal to 4532. Comparisons are made, and the final results are presented in Figures 6 and 7. Here, please note that the unit of time cost is ms and we use log function to make the experiment results more observable.
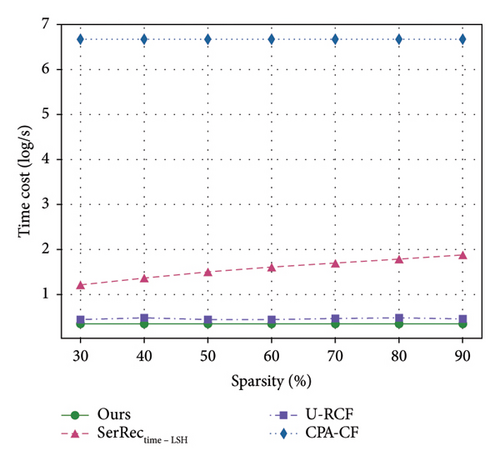
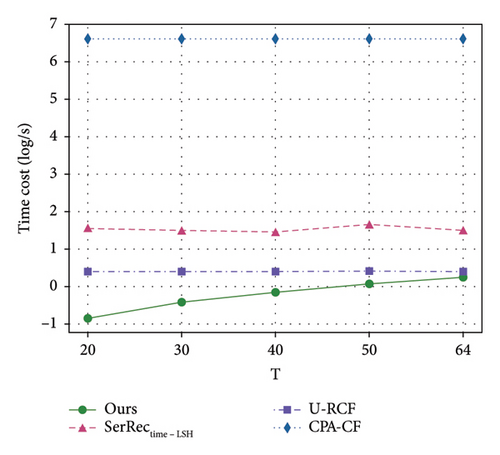
Here, two findings are available from these two figures. First of all, the computational time of all four methods stays stable or increases with the two parameters; this is because larger sparsity or time slots often means unchanged or more computing tasks as well as the resulted static stability or slow increment of time costs. Another finding from Figures 6 and 7 is that the efficiency of our method is superior to those of other methods since the ARIMA technique taken in our method can guarantee a quick online query since the decision-making data can be processed beforehand in an offline way. This means that our proposal in this paper can achieve good time efficiency, especially in the face of the massive physique data produced continuously with time.
5. Conclusion
Wearable devices are increasingly being used for health monitoring, yet incomplete or missing data present significant challenges to an accurate assessment. In this paper, we proposed a novel framework that integrates ARIMA-based virtual data generation and deepfake technology to enhance the robustness of physique testing systems. Concretely, leveraging time series forecasting through the ARIMA model, we effectively predicted missing data based on historical physique measurements. Furthermore, deepfake technology, implemented through GANs, was utilized to generate realistic virtual data that mimic the distribution of real-world measurements, thus augmenting the dataset and improving the general reliability of the test. The experimental results demonstrated that the combination of ARIMA predictions and deepfake-generated data offers superior performance in terms of both accuracy and efficiency compared to traditional methods.
Future work could explore integrating more advanced machine learning models or enhancing the deepfake component to further improve the realism of the generated data. Furthermore, investigating the scalability of the system to handle larger datasets or real-time applications would be a valuable direction for practical implementation.
Nomenclature
-
- ABC
-
- A black cat
-
- DEF
-
- Doesn’t ever fret
-
- GHI
-
- Goes home immediately
Conflicts of Interest
The authors declare no conflicts of interest.
Funding
The authors received no specific funding for this work.
Acknowledgments
The authors have nothing to report.
Endnotes
Open Research
Data Availability Statement
The data that support the findings of this study are available from the corresponding author upon reasonable request.


