An Efficient Integrated Radio Detection and Identification Deep Learning Architecture
Abstract
The detection and identification of radio signals play a crucial role in cognitive radio, electronic reconnaissance, noncooperative communication, etc. Deep neural networks have emerged as a promising approach for electromagnetic signal detection and identification, outperforming traditional methods. Nevertheless, the present deep neural networks not only overlook the characteristics of electromagnetic signals but also treat these two tasks as independent components, similar to conventional methods. These issues limit overall performance and unnecessarily increase computational consumption. In this paper, we have designed a novel and universally applicable integrated radio detection and identification deep architecture and corresponding training method, which organically combines detection and identification networks. Furthermore, we extract signal features using only one-dimensional horizontal convolution based on the characteristics of the impact of wireless channels on time-domain signals. Experiments show that the proposed methods perform signal detection and identification more efficiently, which can not only reduce unnecessary computational consumption but also improve the accuracy and robustness of both detection and identification simultaneously. More specifically, the ability to distinguish different modulated signal categories tends to increase with the rise in SNRs, and the upper limit of detection accuracy can exceed 95% at SNRs above 0 dB. The proposed method can improve both signal detection and identification accuracy from 83.44% to 83.56% and from 61.27% to 62.32%, respectively.
1. Introduction
As key technologies in electromagnetic environment perception, the detection and identification of signals play an important role in various fields such as cognitive radio, electronic reconnaissance, and noncooperative communication [1, 2]. Signal detection (SD), represented by spectrum sensing (SS), refers to determining the existence of the signal except for the noise [3], which is commonly regarded as a binary classification problem. Signal identification (SI), exemplified by automatic modulation classification (AMC), aims to determine the category of signals in the current bandwidth [4], which belongs to the multiclassification problem.
At present, deep learning (DL) has been widely used in wireless communication networks, including the aforementioned SD and SI [5]. The authors in reference [6] proposed an activity pattern-aware SS algorithm based on a convolutional neural network (CNN). The authors in reference [7] proposed a SS algorithm based on the gated recurrent unit (GRU), which is more suitable for dealing with time series. The authors in reference [8] investigated the low signal-to-noise ratio (SNR) of the SS system, proposing a combined CNN and long short–term memory (LSTM)–aided SS scheme. Meanwhile, many researchers in SS have tried different forms of input data, such as time-domain signal [9] and covariance matrix [10], and matched these data with CNN [6], recurrent neural network (RNN) [7], and the network composed of CNN and RNN [8].
As the SI problem is more difficult than SD, more complex and diverse data, such as in-phase/quadrature (I/Q) symbols [11], constellation diagrams [4], time–frequency images (TFIs) [12], are used as inputs of the neural network (NN) in the field of AMC. Numerous AMC network models have been proposed with the aim of improving recognition accuracy [13–15] or reducing network complexity [16, 17]. The authors in reference [18] provided a standard dataset called RadioRML, generated using GNU Radio, and proposed a ResNet-based approach for AMC first. The authors in reference [4] presented a two-stage CNN using constellation diagrams as inputs to implement AMC from the perspective of image recognition. In addition, several studies have integrated RNN with CNN for AMC [19, 20], harnessing RNNs′ ability to capture temporal dependencies, thereby improving classification accuracy. However, the incorporation of hybrid networks often increases the overall complexity of the system.
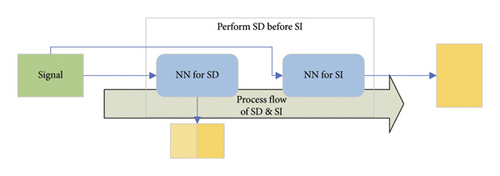
Even though the DL–based SD and SI have achieved notable achievements, there remain some problems that have been ignored. First, from the process of SD and SI, many existing DL–based algorithms, such as traditional methods, treat SD and SI as independent and different tasks that are carried out sequentially, as shown in Figure 1. Although some algorithms have utilized object detection techniques in the field of computer vision (CV) to simultaneously process SD and SI over broadband based on TFI [21, 22], due to the large network size of this method, it may incur unnecessary computational overhead in the absence of signals. Overall, these existing studies have not conducted an in-depth analysis of the processing flow of SD and SI, ignoring important information such as the fact that the SD task is easier than the SI task, and that there is some overlap in the discriminative features relied on by the two tasks. These issues lead to unnecessary computational overhead and limited performance of existing methods. Therefore, considering that the discriminative features required by the two tasks overlap to some extent, we propose a novel two-step approach to achieve radio detection and identification. Specifically, the output of the simpler SD subnetwork determines whether subsequent SI processing is necessary. If no interference is detected, SI processing is skipped, which significantly reduces computational overhead. Some existing studies have also decomposed target tasks to reduce energy consumption [23–25]. Unlike these algorithms that use reinforcement learning (RL) to address wireless body area network (WBAN) issues, this paper employs DL–based algorithm to study radio detection and identification.
In addition, existing SD and SI networks often directly apply CNN modules from the CV domain, ignoring the differences between electromagnetic signals and visual images. They lack network modules designed specifically for the characteristics of electromagnetic signals, leading to limited network efficiency. For example, the I/Q channels have similar features and undergo the same channel effects, so using two-dimensional convolution to extract features may introduce unnecessary computational overhead. Therefore, according to the abovementioned characteristics of the I/Q signal and the wireless channel, we only use one-dimensional convolution (ODC) for feature extraction except for one layer of two-dimensional convolution used to fuse features from different channels, which effectively reduces the computational complexity on the basis of ensuring performance.
In this paper, we introduce a novel integrated radio detection and identification (IRDI) deep architecture for the first time. Specifically, the proposed IRDI network is divided into an SD subnetwork and an SI subnetwork. The output of the simpler SD subnetwork determines whether subsequent SI processing is necessary, and features extracted by the SD subnetwork can be reused by the SI subnetwork to mitigate computational overhead or improve recognition accuracy. In addition, we opt for joint training of the proposed IRDI model (IRDI–J) to fully leverage the advantages of our IRDI architecture, while improving both detection and identification performance. Besides, we have made improvements to the subnetwork based on the abovementioned characteristics of the I/Q signal and the wireless channel. We only use ODC for feature extraction except for one layer of two-dimensional convolution used to fuse features from different channels, which effectively reduces the computational complexity on the basis of ensuring performance. In summary, all the methodologies we have devised not only enhance the accuracy of both SD and SI but also mitigate unnecessary computational overhead.
The remainder of this paper is organized as follows. The details of the proposed IRDI DL architecture, including the relationship between SD and SI, network structure, input data, loss function, and application process are introduced in Section 2. The results of the simulation experiment are shown in Section 3. Finally, we conclude this paper and provide prospects for future work in Section 4.
2. Proposed Methods
2.1. Relationship Between SD and SI
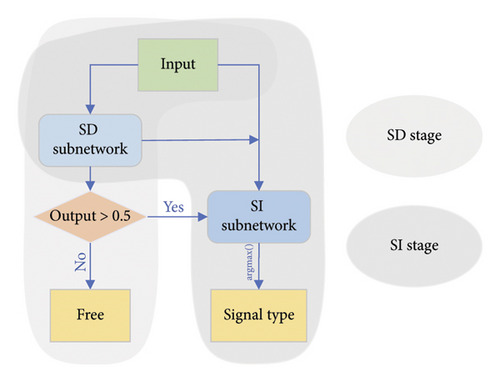
SD and SI constitute two crucial tasks across multiple domains. In narrowband analysis, people often need to detect whether there is a signal in the current subband before subsequent identification, as depicted in Figure 2. Given that multiclassification problems are usually more complex than binary classification problems, it is generally believed that the SD task is less challenging than the SI task. Employing a two-step method can circumvent unnecessary computational overhead caused by SI while the sensing band is unoccupied.

In addition, there is a certain degree of similarity between the two tasks, and traditional feature-based SD and SI methods utilize some of the same statistical features, such as cyclostationarity [26, 27]. We can reasonably speculate that there is a high probability of existing overlap in the features extracted by different neural networks for SD and SI.
2.2. Network Structure
Inspired by multitask learning [28] and depth-tunable network [29], we proposed an IRDI network along with the joint training method, which is designed to handle both SD and SI tasks efficiently. As shown in Figure 3, the proposed IRDI network is divided into a SD subnetwork and a SI subnetwork, where the features extracted by the SD subnetwork are reused by the SI subnetwork.
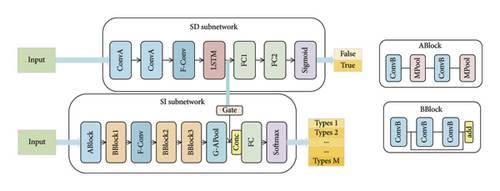
To demonstrate the universality of our proposed methods, we have selected existing well-performing SD and SI networks and applied our methods to them. The structural details of the SI and SD subnetworks are shown on the right side of Figure 3. The SD subnetwork is improved based on the DetectNet proposed by Gao et al. [9], while the SI subnet is improved based on the AMC network called ECNN [30]. Different from ECNN, our SI subnetwork does not have the inversion of time-domain signals as input (ECNN–single) because we believe it is redundant. The modulation signals’ I/Q paths possess similar characteristics and undergo the same channel. So, it is reasonable to only use ODC to extract features from two signals separately and fuse them together. Unlike the commonly employed two-dimensional convolution in existing network architectures, we utilize one-dimensional horizontal convolution (H-Conv) at the front end of the proposed subnetworks, and then we fuse the features from the two signal paths using a layer of two-dimensional convolution (F-Conv), followed by further feature extraction through the subsequent network. Finally, the extracted features are reduced in dimensionality through global average pooling (G-APool) and the classification results are output through fully connected layers (FCLs).
The SD subnetwork consists of two layers of H-Conv, one layer of F-Conv, one layer of LSTM, two layers of FCL, and the final sigmoid activation layer. The output is a number between 0 and 1, representing the probability that the SD subnetwork determines the current perception band is occupied. The details of the SD subnetwork can be found in Table 1. Besides, the detailed model structure of the SI subnetwork is outlined in Table 2, and its output is a vector, corresponding to the probabilities of the existence of M categories of signals.
| Layer | Input | Output size | Kernel size, step |
|---|---|---|---|
| Input layer | — | 1 × 2 × 128 | — |
| H-Conv-1 | Input layer | 8 × 2 × 30 | 8@1 × 10, 1 × 4 |
| H-Conv-2 | H-Conv-1 | 8 × 2 × 6 | 8@1 × 10, 1 × 4 |
| F-Conv-1 | H-Conv-2 | 16 × 1 × 1 | 16@2 × 6, 1 × 1 |
| LSTM | F-Conv-1 layers under K subslots | 32 | — |
| FCL-1 | LSTM | 4 | 32 × 4 |
| FCL-2 | FCL-1 | 1 | 4 × 1 |
| Sigmoid | FCL-2 | 1 | — |
| Layer | Input | Output size | Kernel size, step |
|---|---|---|---|
| Input layer | — | 1 × 2 × 1024 | — |
| H-Conv-1 | Input layer | 16 × 2 × 1024 | 16@1 × 3, 1 × 1 |
| Pool-1 | H-Conv-1 | 16 × 2 × 512 | 1 × 2, 1 × 1 |
| H-Conv-2 | Pool-1 | 16 × 2 × 512 | 16@1 × 3 |
| Pool-2 | H-Conv-2 | 16 × 2 × 256 | 1 × 2, 1 × 1 |
| H-Conv-3 | Pool-2 | 32 × 2 × 256 | 32@1 × 1 |
| H-Conv-4 | H-Conv-3 | 16 × 2 × 256 | 16@1 × 3 |
| H-Conv-5 | H-Conv-4 | 32 × 2 × 256 | 32@1 × 1 |
| Add-1 | H-Conv-3, H-Conv-5 | 32 × 2 × 256 | — |
| F-Conv | Add-1 | 32 × 1 × 256 | 32@2 × 3 |
| H-Conv-6 | F-Conv | 64 × 1 × 256 | 64@1 × 1 |
| H-Conv-7 | H-Conv-6 | 24 × 1 × 256 | 24@1 × 3 |
| H-Conv-8 | H-Conv-7 | 64 × 1 × 256 | 64@1 × 1 |
| Add-2 | H-Conv-6, H-Conv-8 | 64 × 1 × 256 | — |
| H-Conv-9 | Add-2 | 128 × 1 × 256 | 128@1 × 1 |
| H-Conv-10 | H-Conv-9 | 32 × 1 × 256 | 32@1 × 3 |
| H-Conv-11 | H-Conv-10 | 128 × 1 × 256 | 128@1 × 1 |
| Add-3 | H-Conv-9, H-Conv-11 | 128 × 1 × 256 | — |
| G-APool | Add-3 | 128 × 1 × 1 | — |
| FCL | G-APool | 24 | 128 × 24 |
| Softmax | FCL | 24 | — |
Tables 1 and 2 list the SD and SI subnetworks under the separation scenario shown in Figure 1. In the IRDI architecture we proposed, in addition to the original I/Q signal input, the SI subnetwork also has feature vectors from the SD subnetwork as inputs and selects features through a gating mechanism as shown in Figure 3.
2.3. Input Data
We use the I/Q signals as the input data for both SD and SI subnetworks. Assuming there are L sampling points within each perception time slot, then the size of the input data for the SI network is 2 × L. For the SD network, due to the use of LSTM in the network, we divide a perception time slot into K parts and input data with size 2 × L/K from each subslot in chronological order. The input data format for the network is shown in Figure 4.

2.4. Loss Function
A straightforward training approach is to first train the SD subnetwork using LossSD, and then fix the parameters of the SD subnetwork and train the SI subnetwork using LossSI. However, this stepwise training method in our IRDI network (IRDI–S) can only achieve feature reuse of the SD subnetwork. To fully leverage the advantages of our IRDI architecture, we opt for joint training of the proposed IRDI model (IRDI–J) by integrating both losses through uncertainty loss as equation (3) shows, where and are trainable parameters. This not only facilitates feature reuse but also enables the SD subnetwork to receive corresponding gradient flow from the SI subnetwork, similar to the student network in distillation learning, enhancing the training effectiveness of the SD task. The better SD subnetwork can provide improved features for the SI subnetwork, consequently, further enhancing the performance of the SI task. So, IRDI–J should be able to achieve mutual promotion between the two.
2.5. Application Process
The application phase is mainly divided into the SD stage and the SI stage, where the SD stage needs to be performed at each perception time slot, and whether to perform the SI stage depends on the results of the SD. First, the originally received data will be fed into the SD network, and based on the output and the decision threshold (defaults to 0.5), it will be determined whether the current sensing frequency band is occupied by signals other than noise. If the SD network determines that the current frequency band is only noisy, there is no need to perform SI. Otherwise, the original received data and the feature information extracted by SD will be used as inputs for the SI network to further determine the type of signal that currently occupies the frequency band. The specific flow is shown in Figure 5.
3. Experiments and Analysis
3.1. Experimental Environment and Data
We build the network model through the PyTorch framework, and all the networks are evaluated on a hardware platform using an Intel(R) Core(TM) i9-10980XE CPU, 251.4 GB RAM, and a single NVIDIA GeForce RTX 3090 GPU.
The RadioML 2018.01A [18] dataset stands as the most extensively utilized dataset in the realm of AMC; it contains M = 24 different categories of modulated signals, with a SNR range from −20 dB to 30 dB in 2 dB steps, resulting in a total of 26 SNR levels. For each SNR level, there are 4096 signal samples, and each sample instance has L = 1024 I/Q sampling points. Similar to many algorithms, power normalization is performed on the raw signal data. To construct a dataset for our proposed integrated network, we introduced noise signal data and corresponding labels, with a ratio of 0.25 : 0.75 to the original signal data. Furthermore, we split the dataset into training and testing sets in a ratio of 0.8 : 0.2.
3.2. Hyperparameters and Optimizer
In the experiments, we configured the training batch size as 1024 and set the maximum number of epochs to 100. To ensure the acquisition of optimal results, the weights of each epoch are systematically preserved throughout the training process. Upon reaching the maximum iteration threshold of 100 epochs, the model weights corresponding to the epoch that demonstrate the best performance on the validation set are selected as the final parameters. Based on our experience, the Adam optimizer can achieve better convergence than the SGD optimizer. Besides, replacing the Adam optimizer with an SGD optimizer using a smaller step size can, to some extent, reduce overfitting and improve the robustness of the model when overfitting occurs. Consequently, this article defaults to using the combination optimizer of Adam and SGD, with an initial learning rate of 0.001. The specific parameter information is shown in Table 3.
| Hyperparameters and optimizer | Value |
|---|---|
| Batch size | 1024 |
| Epoch | 100 |
| Optimizer | Adam and SGD |
| Learning rate | 0.001 |
3.3. Performance of Proposed Methods
We will conduct ablation experiments to analyze the performance improvements achieved by our proposed methods, including ODC and IRDI. Subsequently, we will compare our network with some existing algorithms.
3.3.1. ODC
Our SD and SI subnetworks are enhanced versions of the existing networks, as discussed earlier, aimed at reducing unnecessary computations. Taking the SI subnetwork as an example, ECNN–single is proposed because using both the I/Q signal and its reverse as inputs will bring redundancy. Besides, ODC is designed because the I/Q paths of the modulation signals own similar characteristics and traverse the same channel.
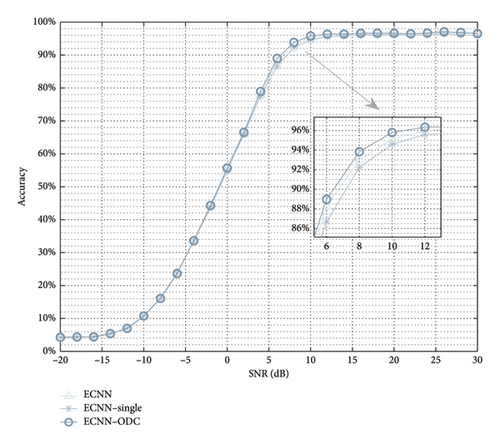
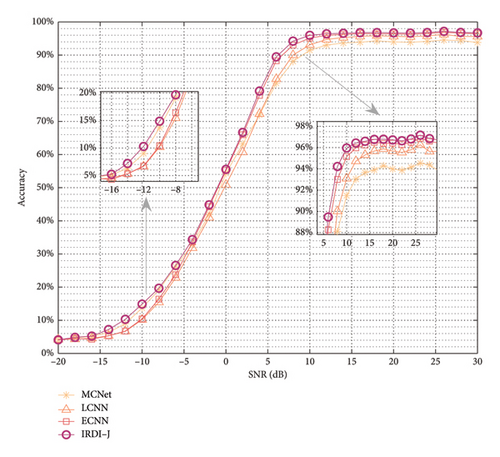
Table 4 presents the accuracy of various SI networks and the memory and floating-point operations (FLOPs) required in a single inference process. As presented in Table 4, ECNN–single reduces half of the computation consumptions caused by the input of the reverse of the I/Q signal. These calculations caused by redundant inputs have a slight positive impact on the performance, resulting in a slight decrease in accuracy for ECNN–single. However, in comparison to ECNN, our proposed ECNN–ODC not only achieves a reduction in computational complexity by over half but also enhances accuracy. So, the SI subnetwork in the following experiments defaults to ECNN–ODC. The comparison of accuracy performance under different SNRs is shown in Figure 6.
| SI subnetwork | Accuracy (%) | Memory (MB) | FLOPs (M) |
|---|---|---|---|
| ECNN | 61.27 | 4.09 | 29.42 |
| ECNN–single | 60.99 | 2.05 | 14.71 |
| ECNN–ODC | 61.52 | 1.61 | 13.35 |
3.3.2. IRDI
In this part, we compared the performance of SD and SI tasks in our proposed IRDI training method (IRDI–S and IRDI–J) with the traditional approach of training two independent subnetworks (initial). We can easily observe in Figure 7 that both IRDI–S and IRDI–J have different performance improvements in both SD and SI tasks. As the IRDI–S method trains the SI subnetwork after the SD subnetwork is trained, it can only improve the performance of the SI task. Due to the joint training of SD and SI subnetworks in the IRDI–J method, the learning of the two tasks can promote each other, thereby improving the performance of both tasks simultaneously, and the improvement effect is better than that of IRDI–S. The IRDI–J method can improve both SD and SI’ accuracy from 83.44% to 83.56% and from 61.52% to 62.32%, respectively. As shown in Figure 8, we can observe that in the SI task, IRDI–S achieved significant performance improvement at lower SNRs, while in the SD task, IRDI–S achieved significant performance improvement at lower SNRs.
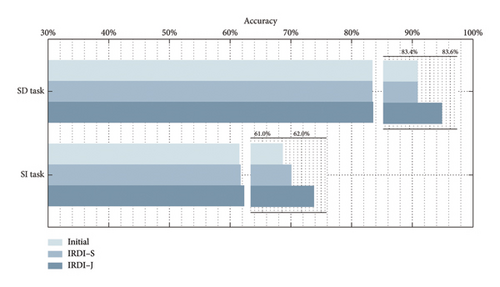
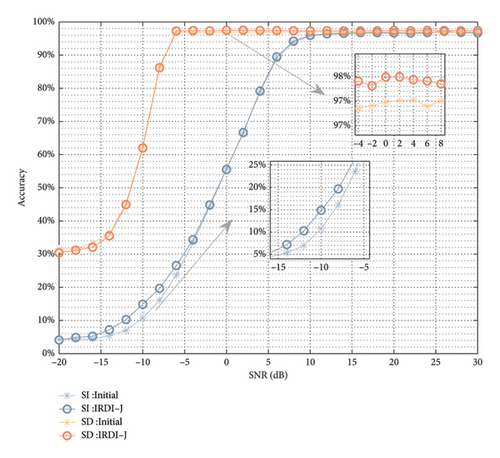
Therefore, it is not difficult to conclude that the IRDI–J proposed in this paper can improve the accuracy of SD and SI tasks while introducing the negligible computational overhead of concatenating and fusing features extracted from the SD subnetwork by the SI subnetwork. It is worth noting that the performance of NN is often related to network size and computational overhead. Therefore, from another perspective, we can appropriately reduce the network size of SD and SI subnetworks to achieve a reduction in computational overhead while ensuring accurate performance.
3.3.3. Comparison With Other Networks
In this part, we compared the performance of the SI task between our proposed network and the existing three high-performance networks (ECNN in [30], LCNN in [31], and MCNet in [32]). In the test dataset, IRDI–J achieved the highest overall recognition accuracy of 62.32%, while the accuracy of the three comparison algorithms was 61.27%, 59.71%, and 59.74%, respectively. More specifically, Figure 9 clearly shows that IRDI–J achieved optimal recognition performance at almost any SNR, indicating its superior robustness.
3.4. Performance Analysis of IRDI–J
In this section, the detection and identification performance of the proposed IRDI–J is further analyzed under different modulated signal types. Figure 10 shows the curves of detection accuracy with SNRs for different modulated signals. From the Figure 10 it is easy to see that the detection accuracy of different modulated signal categories tends to increase with the increase of SNRs, and the upper limit of the detection accuracy can reach more than 95% before 0 dB. In addition, the detection accuracies of the proposed network for similar modulation types are very close. For example, the detection accuracy curves of several ASKs (including 2ASK, 4ASK, and 8ASK) are almost the same. Among the various modulations, the MASK and AM series have the highest detection probability.
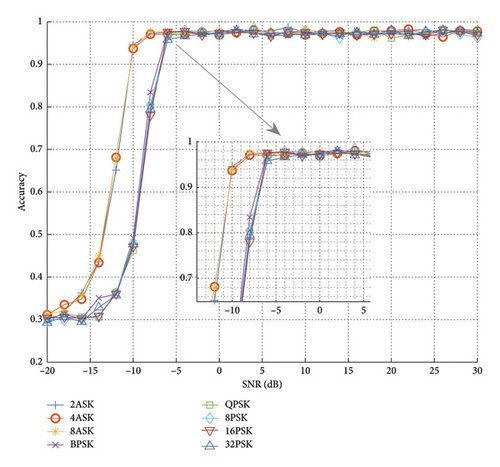

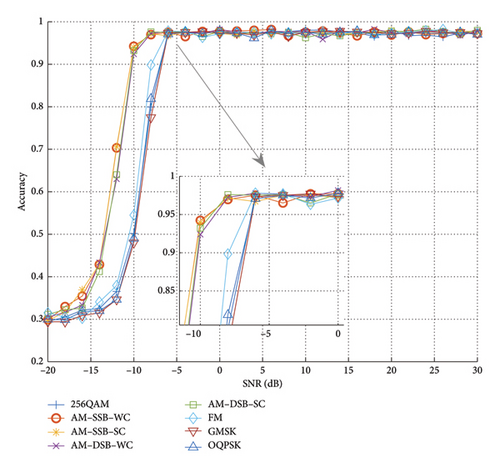
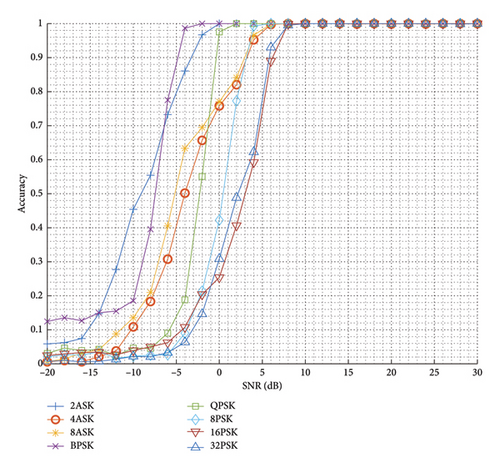
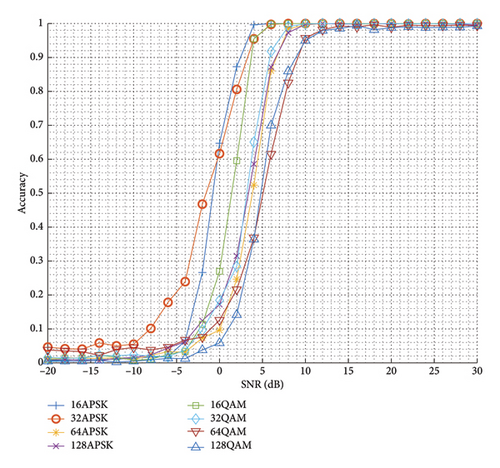
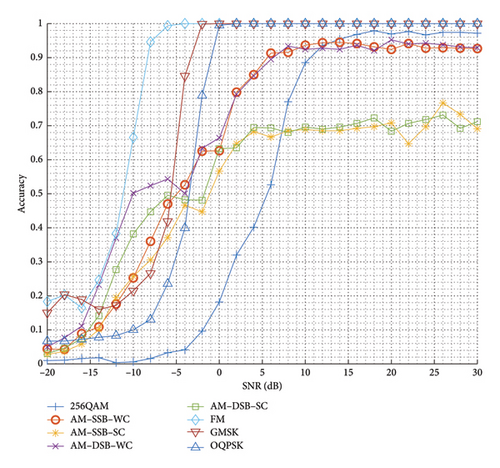
Figure 11 plots the comparison of the recognition accuracy with SNR for different modulation signals, and it is worth noting that this result is obtained by conducting experiments on various data with only a single category of signals in turn, and thus the accuracy here is also the recognition recall of the network for different categories of signals. From the Figure 11, it is easy to find that with the increase of SNR, the recognition accuracy of various signal categories shows an upward trend, and there is a certain upper limit of recognition accuracy. There are some differences in the recognition accuracies of the signals of various modulations with the change of SNR, among which the recognition accuracies of AM–SSB–SC and AM–DSB–SC are the lowest at higher SNRs, and the recognition accuracies of FM are the highest at all SNRs. In general, the higher modulation order corresponds to the lower recognition accuracy for similar modes; for example, the recognition accuracy curve of 128QAM with SNR is always below that of 16QAM.
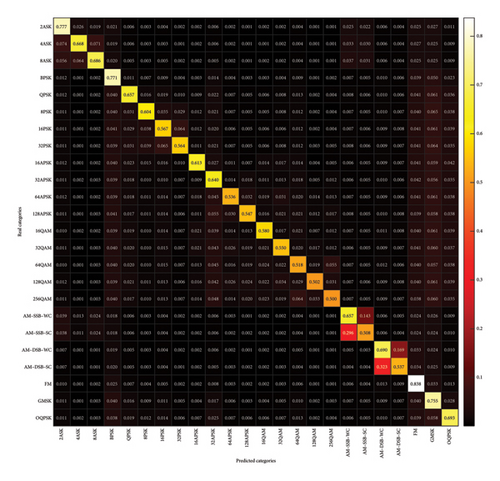
In order to demonstrate more intuitively the proposed network’s discrimination of interference signals of various modulations, this section plots the corresponding confusion matrix based on the outputs and true labels of the recognition subnetwork on the test dataset, as shown in Figure 12. The rows represent the real categories, while the columns represent the predicted categories. Higher values on the diagonal of the matrix indicate better performance in predicting signals in that category. In contrast, nondiagonal values represent misclassifications, where the predicted category differs from the actual one. The higher these off-diagonal values, the greater the likelihood of signal confusion between categories. From the Figure 12, it is easy to find that the FM category has the highest recall, which is most likely due to the fact that it has the largest differences with other signal categories; AM–SSB–SC and AM–SSB–WC and AM–DSB–SC and AM–DSB–WC have the largest chance of misclassification, which is due to the fact that the similarity of their features makes it difficult for the recognition network to correctly distinguish between them. In conclusion, the features of various types of signals and the differences between them make the networks perform differently in recognizing various signals.
4. Conclusion and Future Work
In this paper, we propose a DL architecture called IRDI that aims to achieve efficient integrated detection and identification. The core innovation of the architecture lies in organically combining the detection and recognition networks, integrating the two kinds of losses through uncertainty loss, and jointly training the two subnetworks, which enables the two subnetworks to achieve mutual enhancement through feature sharing and interaction, thus significantly improving the performance of detection and recognition. Compared to traditional separated designs, IRDI eliminates redundant feature extraction processes and substantially reduces computational overhead. Furthermore, we design an efficient convolutional network architecture for the characteristics and transmission patterns of I/Q signals. Through comprehensive ablation experiments, we have validated the effectiveness of the IRDI architecture. Experimental results demonstrate that IRDI achieves superior performance in detection and identification accuracy, robustness, and computational efficiency. The IRDI architecture is highly versatile and can be flexibly applied to a wide range of SD and SI tasks, demonstrating its wide broad application potential.
Despite the significant performance gains achieved by the IRDI architecture, there are still some limitations. The feature interaction mechanism between detection and recognition subnetworks requires further optimization to address potential issues of feature redundancy and information conflict. In additionally, the computational efficiency of IRDI could be enhanced, particularly when processing high-dimensional signals or operating in complex environments. In future work, we plan to conduct an in-depth analysis of features extracted from SD and SI subnetworks to develop more efficient feature interaction mechanisms. Specifically, we will employ techniques such as feature decoupling to make the features learned by the SD and SI subnetworks independent or irrelevant, thereby maximizing the advantages of the proposed architecture and achieving more efficient SD and SI tasks.
Conflicts of Interest
The authors declare no conflicts of interest.
Author Contributions
Zhiyong Luo and Yanru Wang contributed equally.
Funding
This work was supported in part by the National Key Research and Development Program of China under Grant 2023YFB2904701, in part by the Guangdong S&T Programme under Grant 2024B0101020006, in part by the Guangdong Basic and Applied Basic Research Foundation under Grant 2023B1515120093, and in part by the Key Natural Science Foundation of Shenzhen under Grant JCYJ20220818102209020.
Open Research
Data Availability Statement
The data that support the findings of this study are available from the corresponding author upon reasonable request.


