Development of an Electrostatic Precipitator With a Novel Dry-Cleaning Apparatus for Building Ventilation Systems
Abstract
Electrostatic precipitators (ESPs) offer a durable solution for enhancing indoor air quality. However, traditional cleaning techniques often pose financial burdens and result in issues such as electrode degradation and particle re-entrainment, which is crucial for building management. In this study, we introduced an ESP with a novel dry-cleaning apparatus tailored for indoor air purification systems. The novel cleaning apparatus utilized a combination of compressed air-blasting and vacuum suction mechanisms to dislodge and extract particles from the collection plates. Moreover, the ESP incorporated a two-stage design featuring a charger equipped with carbon brush ionizers and a collector comprising carbon ink–coated plastic plates. This design not only mitigates ozone emissions but also reduces installation costs. Our results revealed a consistent cleaning efficiency exceeding 98% under optimal operational conditions, restoring reduced collection efficiency due to contamination. Finally, we conducted field demonstration experiments in subway stations. We retrofitted an air handling unit with our ESP system and dry-cleaning apparatus, showing a collection efficiency of 99.4% for PM1. To validate the efficacy of our dry-cleaning apparatus, we conducted a 16-day test at a vent outlet of a subway station. The field demonstration of the dry-cleaning apparatus showcased nearly flawless recovery of collection efficiency to the initial state. In summary, our investigation represents a significant advancement in overcoming the prevailing challenges associated with ESP utilization in indoor air purification applications.
1. Introduction
Airborne particulate matter (PM) poses a significant health risk because it can be easily inhaled, and it has been classified by the World Health Organization as a first-class carcinogen [1–3]. Because individuals spend most of their time indoors, prioritizing the management of indoor air quality is crucial for human well-being [4]. Typically, indoor air quality in buildings is regulated by the installation of heating, ventilation, and air conditioning (HVAC) systems, which often incorporate medium-grade air filters designed to minimize pressure drop [5]. However, because of the harmful effects of PM, HVAC system filters are being upgraded to high-efficiency particulate air (HEPA) or electrostatically assisted filters [5–9]. HEPA filters are widely recognized for their exceptional filtration capabilities, particularly for fine particles. However, their adoption is constrained by their significant energy consumption and susceptibility to filter degradation resulting from substantial pressure drops caused by clogging [10–12]. Electrostatically assisted filters are high-performance filters that only experience a moderate pressure drop, owing to their high porosity, compared with HEPA filters [6–9]. However, electrostatically assisted filters require periodic replacement, resulting in high maintenance costs and waste generation [13, 14].
There has been a growing interest in utilizing electrostatic precipitators (ESPs) as alternatives to filters for air purification. The ESP, initially invented by Cottrell [15], removes particles by electrostatic force rather than traditional physical filtration methods, such as filters, impactors, and cyclones. The discharge electrodes generate a corona discharge to electrically charge the particles, which are subsequently attracted to and collected on the collection electrode by electrostatic force [16]. Although ESPs can process large quantities of air because of their low-pressure drop, they have certain limitations for indoor air purification, such as ozone generation [17] and high installation and maintenance costs [18].
Researchers have aimed to decrease ozone by minimizing the discharge electrode thickness by using carbon fibers with diameters less than 10 μm as the discharge electrode [19–21]. A two-stage ESP structure has also been utilized to achieve optimal collection efficiency while minimizing ozone generation [20, 22, 23]. Plastic electrodes coated with carbon ink are becoming increasingly used because of their low installation cost and lightweight [23–25].
Through these advancements, ESPs offer a semipermanent solution to air purification, reducing building management costs and eliminating the necessity for frequent replacements. Nonetheless, the effectiveness of ESPs declines as PM accumulates on the collection plates, necessitating periodic cleaning [26].
ESPs can be classified into wet cleaning or dry-cleaning systems. Wet ESPs can efficiently remove adhered particles by washing the electrodes with water. However, their installation costs are considerably higher than those of dry ESPs due to the requirement for water supply and drainage pipelines, along with additional costs for wastewater treatment [27–29]. Dry ESPs remove attached particles by vibrating the collection electrode with a hammer [30]. This method has a low cost but potentially damages the electrodes [31] and results in the re-entrainment of dislodged particles, diminishing collection efficiency [32].
In this study, we aimed to introduce an innovative dry-cleaning method that mitigates electrode damage and re-entrainment issues within a two-stage ESP setup. The method involved deploying a compressed air-blasting unit positioned at the front of the collector coupled with a vacuum suction unit positioned at the rear. Compressed air, pressurized at 2-bar gauge pressure, was directed onto the electrode to dislodge particles, which were then promptly drawn into a vacuum hopper to prevent re-entrainment. Our investigation assessed the cleaning performance concerning various parameters, including the cross-sectional area of the nozzle, quantity of particle loading, and compressed air flow rate throughout the particle loading and cleaning phases. Finally, we conducted field demonstration tests in subway stations that had retrofitted an air handling unit with our two-stage ESPs and the novel dry-cleaning device. Furthermore, the effectiveness of the novel dry-cleaning method was validated through 16 days of demonstration tests at the vent outlet of a subway station.
2. Methodology
2.1. Particle Collection
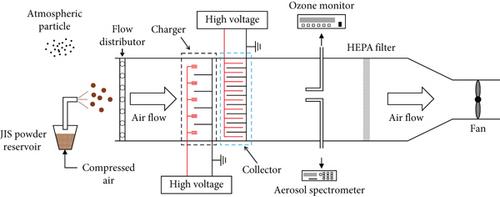
The ozone concentration was measured using an ozone analyzer (O3 analyzer T400, Teledyne Technologies, Thousand Oaks, California, United States) at the same sampling site as the aerosol spectrometer. The generated ozone concentration was defined as the increase in ozone concentration after activating the ESP relative to the background ozone concentration.
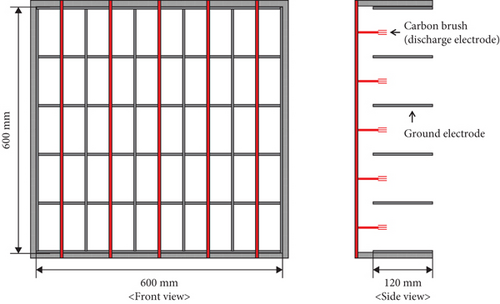
In this study, the two-stage ESP consisted of a charger with carbon fiber ionizers and a parallel plate-type collector (Figure 2). Figure 2(a) displays the front and side views of the charger equipped with carbon fiber ionizers. The charger had a windward dimension of 600 mm × 600 mm. The carbon fiber discharge electrodes were positioned at the center of the grounded lattices within a 5 × 5 channel. The grounded surface had a width of 120 mm and was composed of aluminum. Figure 2(b) shows the collector (0.6 [W] × 0.11 [L] × 0.6 [H] m) composed of plate-type high-voltage and ground electrodes. The high-voltage electrode consisted of a plastic plate with an inside layer of laminated carbon. The ground electrode was made of aluminum and had identical dimensions to those of the carbon film. There were 50 high-voltage plates and 51 ground plates arranged at 5 mm intervals, covering a total collection area of 5.2 m2. While positive corona generally produces less ozone than negative corona, negative corona is superior in particle collection efficiency due to the higher likelihood of generating negative ions in oxygen-rich atmospheric conditions. For this study, we employed negative corona to achieve high collection efficiency while leveraging the low ozone emission characteristics of carbon fiber ionizers, attributed to their small diameter of approximately 7 μm [33, 34]. Additionally, for safety reasons, we applied a negative voltage to the collector to ensure particles were captured on grounded electrodes, minimizing the risk of electric shocks and unintended electrical discharges during operation.
2.2. Particle Loading and Cleaning
For particle loading in the two-stage ESP, Japanese Industrial Standard (JIS) particles (Z8901 Classes 8, Powder Technology Inc., United States) were sprinkled at the entrance to the wind tunnel (Figure 1) by injecting compressed air into the powder reservoir. The JIS particles were then transported through connected conduits and sprayed using a 1/4 ″ pipe nozzle. Due to highly charged particles owing to triboelectrification in the aerosol generation process, high voltages of −6 and −5 kV were applied to the charger and the collector, respectively, which were sufficient for particle deposition. The mass of deposited particles on the collector was measured by comparing the weight of the collector before and after particle loading and using an electronic scale (CAS IW2PI-15, SATORIOUS, China).
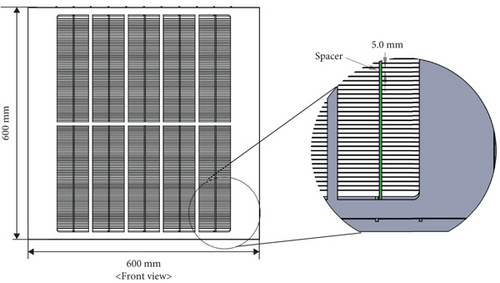
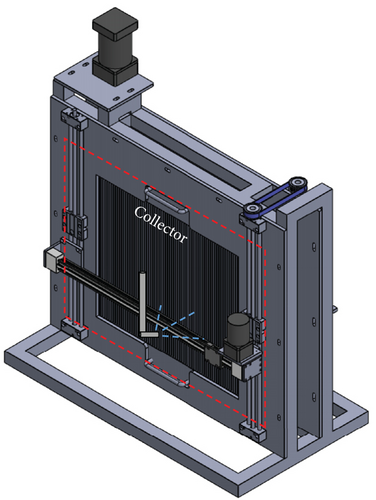
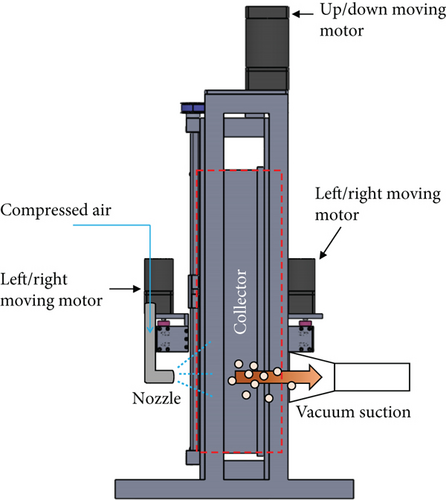
After the particle loading procedure, the contaminated collector was mounted on the novel dry-cleaning device developed in this study (Figure 3). The contaminated collector was cleaned by a compressed air-blasting unit located at the front of the collector. The flow rate of the injected compressed air was measured using a compressed air flow meter (TESTO 6441, Testo SE & Co. KGaA, Lenzkirch, Germany). The air gauge pressure was fixed at 2 bar and adjusted using a pressure regulator (PR2-02BP, TPC Mechatronics, Incheon, South Korea). To prevent resuspension of the dislodged particle, we placed a vacuum suction unit at the back of the collector. The particles blown by the compressed air were sucked through an acrylic hopper with a cross-sectional area of 0.08 × 0.08 m by using an industrial vacuum cleaner (CM-1000WD, Chun Ma star, Seoul, South Korea). The compressed air-blasting nozzle and vacuum suction hopper of the dry-cleaning device automatically moved synchronously at a speed of 0.09 m/s horizontally and 0.05 m/s vertically. Therefore, the compressed air-blasting nozzle and suction hopper were positioned in a linear arrangement with the collector in the center to capture dislodged particles without causing resuspension during the operation. The working process of the dry-cleaning device is shown in Video S1.
Here, ηclean is the cleaning efficiency (percent); m0 is the initial weight of the collector (grams); and m1 and m2 are the weight of the collector before and after cleaning (grams), respectively. An electronic scale (CAS IW2PI-15, SATORIOUS, China) was used to measure the weight of the collector.
3. Results
3.1. Particle Collection and Ozone Concentration
Figure 4 illustrates the corona discharge current as a function of the voltage applied to the charger. Corona discharge started at a voltage of −2.15 kV, and the discharge current was 1.5 mA at the maximum applied voltage of −20 kV. The corona discharge current curve in this study exhibited a quadratic form according to Townsend’s law [35], and the coefficient of determination (R2) was 0.9967.
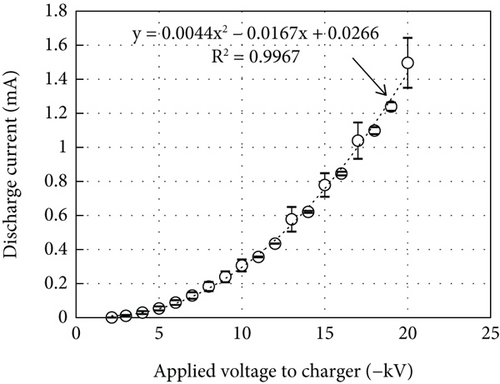
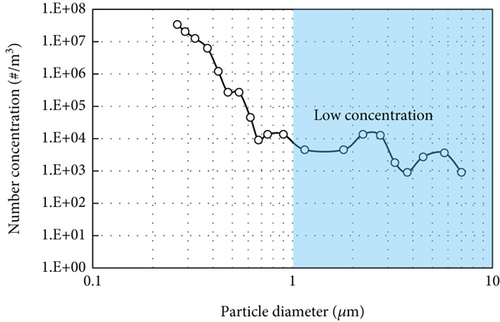
Figure 5 displays the number concentration of atmospheric particles, which was the target particle in the experiment. The number concentration was highest at a particle diameter of 0.27 μm with 3 × 10⁷#/m3, which was the smallest particle diameter measurable on the instrument. For precision, particles larger than 1 μm were excluded from the following analysis because of the extremely low concentration lower than 103 #/m3.
The particle collection efficiency and generated ozone concentration of the two-stage ESP were evaluated for indoor applications by varying the voltage applied to the charger (Figure 6). Figure 6(a) shows collection efficiency with respect to particle diameter, measured under varying voltages applied to the charger. Herein, the applied voltage to the collector was fixed at −5 kV. The lowest collection efficiency was achieved at a diameter of 0.27 μm, and the highest efficiency was at a diameter of 0.9 μm. Collection efficiency increased with particle size because of the elevated particle charge and electrostatic attraction force [16].
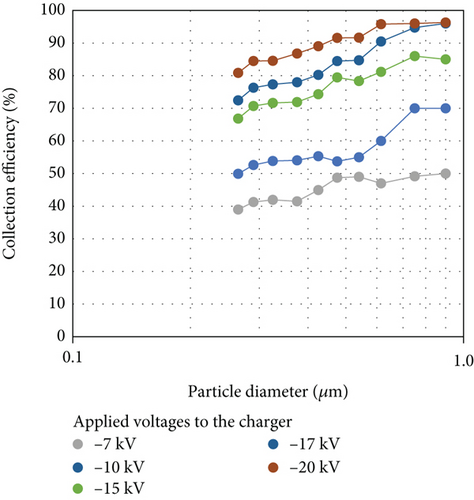
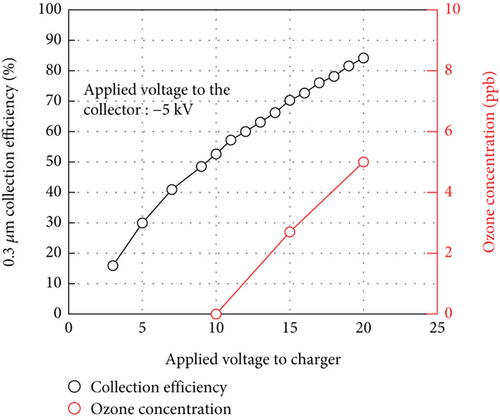
Figure 6(b) shows the collection efficiency of the 0.3 μm particles and the ozone concentration in relation to the applied voltages to the charger. Here, we averaged the number concentrations of particle sizes from 0.265 to 0.325 μm to precisely estimate the collection efficiency of 0.3 μm particles; this size particle is the most difficult to remove due to the low particle charging rate originating from the mechanism of diffusion charging and field charging [16]. No ozone generation was observed until the voltage reached −10 kV, at which point the particle collection efficiency was 52.6%. Increasing the voltage applied to the charger increased the collection efficiency and ozone concentration owing to the increased air ionization energy. Although an applied voltage of −20 kV showed the highest collection efficiency, generating 5 ppb of ozone, we selected −17 kV for the following lab-scale experiments to ensure safety because sometimes an abnormal spark was observed at −20 kV.
3.2. Particle Loading and Cleaning
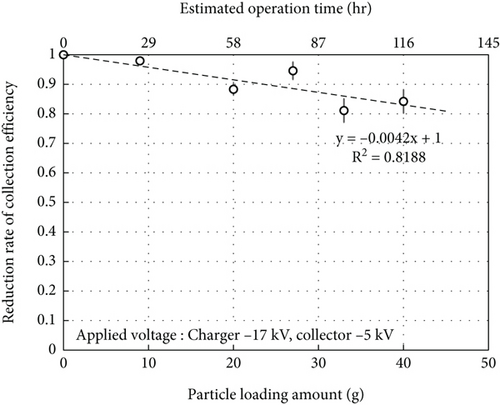
For maintenance, the cleaning period to maintain particle collection efficiency within 20% of the initial state was inferred to be approximately 145 h at a particle loading amount of 50 g. A previous study reported that the runtime, the fractional on-time of the system, of residential HVAC systems in North America had a median of 18% [37]. Considering office buildings, in which occupants use the building in the daytime, the runtime of the HVAC system was inferred to be approximately 9%, corresponding to 2 h per day. With this assumption, the cleaning period was estimated to be approximately 2.5 months with the aforementioned PM10 concentration of 150 μg/m3.
To determine the optimal operating conditions for perfect cleaning, we manufactured three blasting nozzles with differing nozzle areas. Figure 8(a) shows the cleaning efficiency with respect to the nozzle area. Other operating conditions, such as the particle loading amount, compressed air pressure, and airflow rate, were fixed at 16 g, 2 bar, and 244 NL/min, respectively. The corresponding flow velocity to each nozzle area of 90, 35, and 17 mm2 was 45, 116, and 240 m/s. The cleaning efficiency increased up to 100% at 17 mm2 as the blasting air velocity increased in proportion to the decreasing nozzle area. We selected 17 mm2 as the optimal nozzle area because the cleaning time increased with nozzle sizes smaller than 17 mm2. Figure 8(b) illustrates the cleaning efficiency based on the particle loading quantity. The blasting air flow rate ranged from 50 to 220 NL/min when the nozzle area was 17 mm2. At particle loading quantities of less than 6 g, the cleaning efficiency consistently reached 100% across all flow rates. The cleaning efficiency decreased rapidly with an increase in the particle loading quantity. This could be because the compressed air was unable to dislodge the particles quickly enough while the blasting nozzle was in motion. The cleaning efficiency decreased minimally as the particle loading quantity increased but remained at 98.2% when the flow rate was higher than 220 NL/min and the particle loading quantity was 56 g, which was higher than the target particle loading amount of 50 g. Therefore, a flow rate of 220 NL/min was selected as the optimal operating condition.
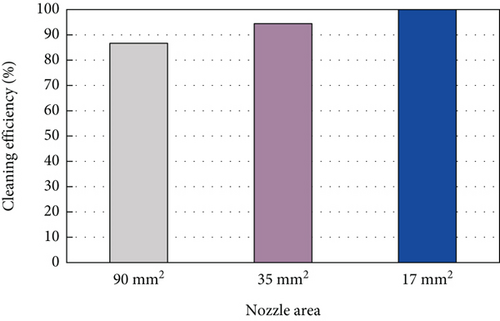
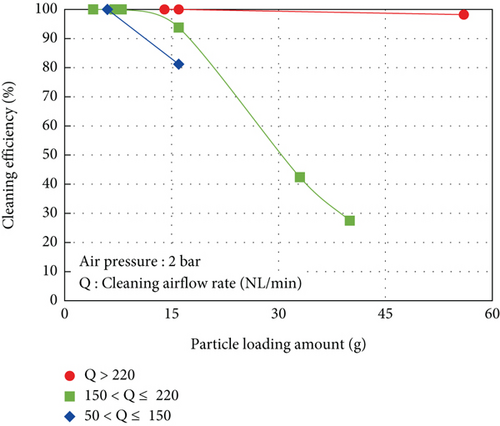
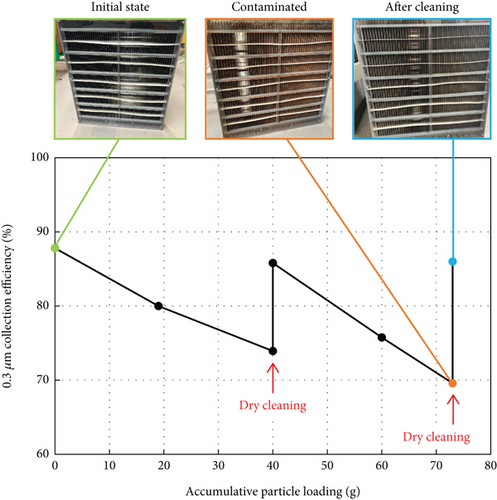
Figure 9 depicts the variation in collection efficiency of 0.3 μm particles and the mass of the loaded particles after particle loading and novel dry cleaning. With increased particle loading from 0 to 40 g, the particle collection efficiency decreased, with the particle loading quantity decreasing from 87.8% to 73.9%. However, the novel dry-cleaning method immediately restored the collection efficiency to its initial level and reduced the particle loading quantity to zero owing to the strong pressure force of the compressed air. After the first dry cleaning, where the accumulative particle loading amount was 40 g, the collection efficiency decreased as the loading amount increased but was recovered again by the second dry cleaning. Thus, the novel dry-cleaning method can perfectly detach particles from the electrodes and restore the collection efficiency after a decrease in particle collection efficiency due to contamination with collected particles.
3.3. Demonstration in Building Environment
To assess the real-world efficacy of our device, we installed the two-stage ESP and the dry-cleaning apparatus in an air handling unit at the Yeongtong subway station (Yeongtong-gu, Suwon, Republic of Korea). Figure 10(a) shows how the air handling unit provides well-conditioned air to the building. The air handling unit operates intermittently to create comfortable air for occupants by appropriately mixing outdoor and indoor air and filtering pollutants from the air. We retrofitted the air handling unit by installing the two-stage ESP and the novel dry-cleaning apparatus developed in this study, as shown in Figure 10(b). The air blower and vacuum suction system are illustrated in Figure 10(c). The air handling unit circulates the air at a flow rate of 24,844 m3/h, with a face velocity of 1.73 m/s.
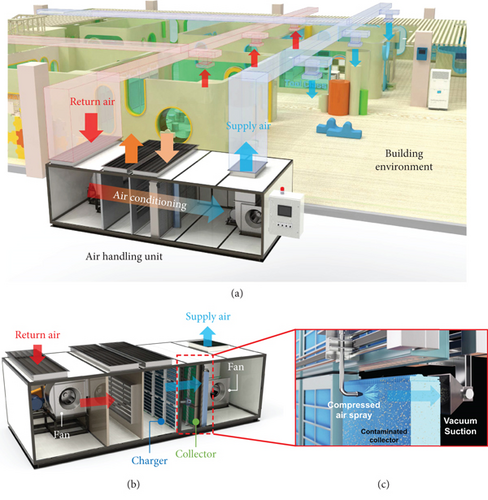
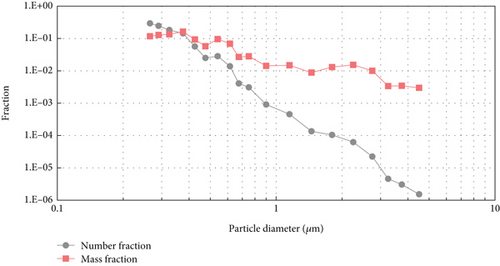
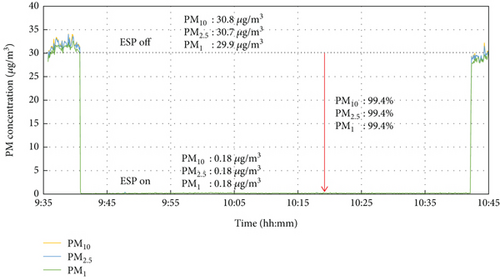
Figure 11 illustrates the particle removal characteristics of the retrofitted air handling unit. We installed an aerosol spectrometer behind the collector to measure atmospheric particles passing the air handling unit. The size distribution of the airborne particle is shown in Figure 11(a). Notably, PM1 accounts for more than 95% of the particles in number and mass fraction. The particle removal performance of the ESP is shown in Figure 11(b). Here, we controlled the air ventilation mode of the air handling unit to be a 100% indoor circulation mode without mixing. The applied voltage of the charger and the collector was −20 and −8 kV, respectively. To identify the maximum performance of the ESP, we slightly increased the applied voltages compared with those of the lab-scale experiment. For 1 h, the ESP removed 99.4% of PM1. Due to the minor portion of PM1–10, the collection efficiency of PM2.5 and PM10 was observed to be almost the same as that of PM1.
For the dry-cleaning experiment, we changed the demonstration site from Yeongtong subway station to the vent outlet of Yongmun subway station (Seo-gu, Daejeon, Republic of Korea) because, at the former station, the amount of collected dust was insufficient to validate the efficacy of the novel dry-cleaning apparatus. Considering the PM10 concentration of 30.8 μg/m3 at Yeongtong subway station, 760 h was necessary to deteriorate the PM removal performance of the ESP, per the lab-scale experiment results in Figure 7. Because of the short daily operation time of the air handling unit being approximately 2 h owing to energy consumption, more than 1 year of delay was expected for the cleaning experiment. Therefore, we installed an ESP dust collection unit in the vent outlet of Yongmun subway station, where the average daily PM10 concentration of 197 μg/m3 was measured. The temporal variation in PM10 concentration in the vent outlet of Yongmun subway station measured from April 12 to 15, 2022, is shown in Figure 12. The airflow velocity was 2.5 m/s, and the voltages applied to the charger and collector were −23 and −8.5 kV, respectively. The PM collection efficiency was also evaluated at a flow velocity of 2.5 m/s with respect to atmospheric particles. To accelerate particle loading, we slightly increased the applied voltages and the flow velocity.
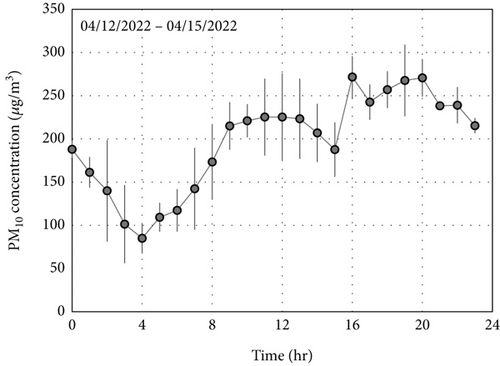
Figure 13 illustrates the performance of the novel dry-cleaning apparatus. Initially, the collection efficiencies of PM2.5 and PM10 were 72.6% and 78.8%, respectively. After the continuous 16-day operation period from May 16 to June 10, 2022, the ESP particle collection system collected a total of 40 g of particles. This was determined by measuring the variation in the weight of the collector using an electronic scale (CAS IW2PI-15, Sartorius, China). Although the collection efficiency for PM2.5 and PM10 decreased to 54.5% and 65.9%, respectively, during this period, these efficiencies were restored to 73.7% and 79.4%, respectively, owing to the implementation of the novel dry-cleaning method.
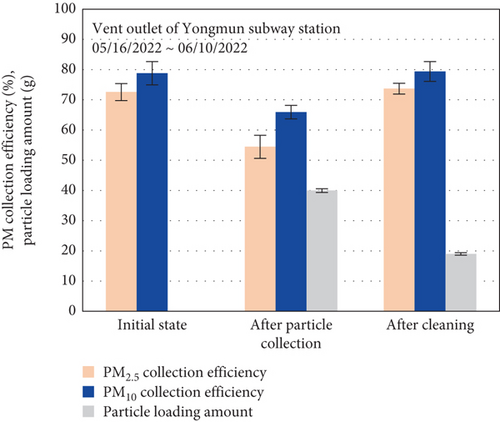
Unlike the results observed in the laboratory experiment with JIS particles, a complete removal of the collected particles was not achieved. This discrepancy might be due to the significant iron content present in the particles suspended at the subway station’s vent outlet [38], which are approximately twice as heavy as JIS particles. Moreover, the collected particles were found to be agglomerated with viscous oils, which originated from lubricating oil emitted by traffic and ventilation fans [39].
4. Discussion
This study introduced a two-stage ESP with a novel dry-cleaning apparatus for an HVAC system to facilitate maintenance. Accumulation of dust in filtration systems can significantly decrease air purification performance; thus, appropriate maintenance is critical. We developed a novel dry-cleaning apparatus using compressed air to blow off deposited dust on the collector and a vacuum suction unit. This apparatus effectively cleaned the contaminated collection plates without damaging the ESP. However, it has limitations, which are discussed in this section and could serve as topics for further research.
To show the recovery rate of our cleaning device, we conducted the ESP restoration experiment twice (Figure 9). Multiple recovery experiments are important to emphasize the cleaning performance. However, we determined that our experiment was sufficient to show the effectiveness of our ESP system, owing to its long cleaning period. In Figure 7, the cleaning period of our ESP system was estimated to be approximately 2.5 months, under PM10 concentration of NAAQS (150 μg/m3). Furthermore, the field demonstration at Yeongtong subway station showed a PM10 concentration of 30.8 μg/m3, which was approximately five times lower than the assumption of 150 μg/m3. In this circumstance, the cleaning period was estimated to be 12.5 months, indicating the two cleanings in Figure 9, corresponding to an operation of approximately 2 years. However, further studies on long-term or acceleration studies should be conducted for practical applications.
To validate the performance of the dry-cleaning apparatus in a field demonstration, we collected airborne particles at the vent outlet of Yongmun subway station. Although the collection efficiency was restored by the dry-cleaning process, the deposited particles were not perfectly blown off. We postulated that this result was attributable to the heavy iron-containing particles and viscous oily particles. The adhesion of surfaces is influenced by several forces, including the Van der Waals forces, electrostatic forces, viscous forces, capillary forces, and gravitational forces, particularly at the micro and nanoscale [40]. Under these conditions, mechanical cleaning may be insufficient to detach fine particles from surfaces. For the perfect recovery of the ESP system, chemical solutions such as ethanol, surfactants, or other organic solvents could be employed. Further investigation is necessary to identify the composition of the deposited particles.
5. Conclusion
In this study, we developed a two-stage ESP with a novel dry-cleaning apparatus for building environments. The two-stage ESP utilized in our study featured a charger equipped with carbon brush ionizers and a collector outfitted with carbon ink–coated plastic plates, which were selected for their ability to ensure high collection efficiency while minimizing ozone emissions. The novel cleaning apparatus employed compressed air-blasting and vacuum suction units to effectively dislodge and remove particles from the collection plates, safeguarding the collector from damage and preventing particle re-entrainment. Our novel dry-cleaning method adeptly restored the particle loading quantity and the collection efficiency of the collector to their initial states.
In our experiments, we assessed the collection efficiency and ozone generation of a two-stage ESP based on the applied voltages of the charger. An applied voltage of −17 kV to the charger proved suitable for indoor applications, yielding an ozone concentration of less than 5 ppb. The collection efficiency decreased linearly as the particle loading quantity increased. For the cleaning, we optimized the novel dry-cleaning apparatus by varying the area of the air-blasting nozzle and the cleaning air flow rate. We concluded that the optimal design was 17 mm2 and 220 NL/min. With the optimized device, the cleaning efficiency exceeded 98%, and the deteriorated collection efficiency was consistently restored to its initial state.
Finally, we performed a demonstration experiment in a subway station for which an air handling unit was being retrofitted. The two-stage ESP and the novel dry-cleaning device were installed inside the air handling unit. For 1 h of operation, the ESP removed 99.4% of PM1. To evaluate cleaning performance, we collected airborne particles in the vent outlet of Yongmun subway station by using an ESP dust collection unit for 16 days. Although some of the deposited particles remained after the dry-cleaning process, the collection efficiency was nearly perfectly restored.
In conclusion, our study introduces a novel dry-cleaning method tailored for ESPs in indoor air purification applications, addressing current challenges in their implementation. Thus, our findings contribute significantly to advancing the utilization of ESPs for indoor air purification.
Conflicts of Interest
The authors declare no conflicts of interest.
Author Contributions
Yeawan Lee and Ye-Sle Kim contributed equally.
Funding
This work was supported by the Basic Research Fund of the Korea Institute of Machinery and Materials (No. NK249A) and in part by the National Research Foundation of Korea (No. 2021M3E8A210003113).
Open Research
Data Availability Statement
The datasets used or analyzed in this study may be obtained from the corresponding author upon reasonable request.


