Comparative Assessment of Bioaerosol Propagation Through an Air Curtain Using Microbiological Methods and Particulate Matter Sensors
Abstract
An important route of transmission for potentially harmful bacteria is the spread of bioaerosols in indoor environments. In a chamber specially developed for particle dispersion tests, we created a defined bioaerosol to study the performance of two methods commonly used in biology and engineering studies: airborne bacterial detection and particulate matter (PM) analysis. A total of five ventilation cases were investigated in which an air curtain, operated at Reynolds numbers Re < 11, 000, shielded the particles in one half of the test chamber from the other half. In two of these five cases, a HEPA filter was also installed to specifically reduce the particle concentration in the test chamber. In addition to active and passive air sampling measurements of bacteria, we took PM measurements in front of, beneath, and behind the air curtain under constant air temperature and relative humidity conditions. The bioaerosol contained nine bacterial species, evenly distributed in artificial saliva. Two species in the bioaerosol, Staphylococcus capitis DSM 111179 and Burkholderia lata DSM 23089T, were selected for evaluation due to their antibiotic resistance, which makes them distinguishable from other species. The results show a similar trend in the concentrations of the detected particles and bacteria. The survival rates of the evaluated bacterial species differed; S. capitis exhibited a greater agreement with the PM measurements than B. lata did, which emphasizes the importance of using a various model organism in such experimental setups. We evaluated the effectiveness of the air curtain in reducing particle and bacterial spread, with values reaching up to 66% for both measurement approaches. This study highlights the key differences between the two detection methods and confirms the reproducibility and suitability of the standardized bioaerosol for future research applications. Both methods have demonstrated their potential for use in more realistic scenarios.
1. Introduction
Microbial spread is natural when people travel or reside indoors because microorganisms, especially bacteria, colonize the human body [1, 2]. These microorganisms can be transferred via surfaces [3, 4] as well as through the air [5]. The potential for microbial transmission is a significant issue when opportunistic or pathogenic agents cause infections. Therefore, it is essential to investigate a range of countermeasures for reducing microbes, particularly in indoor environments such as the passenger compartments of public transportation vehicles [6, 7], where there is a high potential for pathogen transmission due to long-duration and short-distance contact between passengers. Several studies have examined the air quality in the passenger compartments of underground trains and aircraft cabins [8, 9]. Using sequence-based methods, microorganisms in these environments were detected and identified. The detected organisms included common representatives of skin-associated bacteria, such as the genera Corynebacterium, Burkholderia, Staphylococcus, and Propionibacterium. It should be noted that these environments can harbor opportunistic human pathogens, which could lead to infections in immunocompromised individuals. Their presence on public transportation has already been demonstrated. These include multidrug-resistant bacterial pathogens [10–13].
Implementing a multifaceted approach that integrates surface and air cleaning with other active measures can play a crucial role in enhancing microbial safety in the passenger cabin. Additionally, ventilation systems can prevent the spread of airborne microbes [14, 15]. Reducing the dispersion of bioaerosol and the spread of infectious diseases must be considered a key parameter for future ventilation concepts, in addition to reducing energy consumption and thus operating costs. For this reason, we apply a defined bioaerosol to a ventilation concept in a defined experimental environment and compare the bacterial and particle dispersion. Additionally, we evaluate the effectiveness of the chosen air curtain ventilation concept in preventing the spread of airborne bioaerosols. The goal is to apply it to more realistic configurations such as passenger cabins at a later stage. Air curtains are already used in various indoor settings, including shopping malls and hospitals, and have been studied for many years [16]. Recent studies have employed experimental and computational approaches to gain insight into their application against aerosol spread [17, 18].
One recent study [5] demonstrated that the air quality around an orchestra can deteriorate during performances. The authors suggest that assessing bioaerosols may be an appropriate method for modeling exposure to potentially infectious particles from the upper respiratory tract. Unlike the previous study [5], which assessed bacteria sampled from the exhaled air of the musicians, this study uses a newly developed, standardized bioaerosol [19] with a defined, known initial bacterial concentration. The propagation of this bioaerosol is then studied in an experimental chamber. This bioaerosol is based on genera commonly found in public transportation and contains nine bacterial species. This allows us to focus our investigation on this particular environment, which is prone to microbial spread and is therefore relevant to our research. To the best of our knowledge, the controlled distribution of a defined bioaerosol that mimics a specific microbiome, as in this study, has not been conducted before. We will compare the results to particle concentration measurements, a well-known method of evaluating the effectiveness of ventilation concepts [20].
There are a variety of methodologies for evaluating bioaerosol spread. In addition to simulating particle dispersion, analyzing particulate matter (PM) is a reliable method for precise measurement. Various devices are available for measuring PM, ranging from rather expensive, high-resolution detectors to low-cost sensors with lower resolution and precision. Besides measuring PM, culture-based methods can be used to evaluate the spread of bioaerosols and, importantly, the survival of pathogens through air travel. Several studies have been conducted on bioaerosol collection using either passive or active air sampling [21, 22]. Passive air sampling uses Petri dishes containing culture media that allow bacteria to colonize and be cultured for subsequent survival analysis. Active sampling uses air samplers, which are available in a variety of types. The most common air samplers draw air directly onto agar plates using the principle of particle impingement (e.g., MAS-100 Eco, MBV), while others sample the air into a liquid solution (e.g., Coriolis Micro, Bertin Technologies). The advantage of the latter is that the sample can easily be cultured and further analyzed (e.g., by extracting DNA for additional purposes). Selective culture media with antibiotics can be used to analyze specific organisms, while complete media are used to cultivate a broad spectrum of organisms, such as bacteria.
In this study, we use the most common genera from a recent study on public transportation to simulate the public transportation microbiome [19]. This specific simulated microbiome is used as a reference for investigating both time-resolved, sensor-based PM measurements and time-integrated bacterial survival analysis. Our goal is to gain a deeper understanding of how particles and viable bacterial cells propagate through the chamber and the air curtain flow field and to identify the environmental and fluid dynamic properties that affect the two measurement methods. To this end, we create five distinct ventilation cases for air curtain Reynolds numbers Re < 11, 000. Two of the five cases include additional HEPA filters to reduce the overall particle concentration and increase the air curtain’s effectiveness.
In our study, we focused on three key aspects: (A) the introduction of the defined bioaerosol to serve as a reference for studies on the spread of pathogens in indoor environments, (B) measuring viable bacteria and aerosol particles in a range of Dp = 0.3–4 μm and comparing them for five different ventilation cases, and (C) evaluating the performance of the two measurement techniques.
2. Materials and Methods
2.1. Experimental Setup
The measurements were performed in a chamber specifically designed for this experiment. The chamber’s dimensions are 2 m long, 1 m high, and 1 m wide, as shown in Figure 1. An air curtain was installed at the entrance to a second smaller room R2 at a height of H = 68 cm inside the chamber. Thus, the chamber consisted of two subrooms: one to the left of the air curtain (denoted R1 in Figure 1) and one to the right (denoted R2). A bioaerosol generator with an outlet height of 36.5 cm was placed at the bottom left of the chamber (R1) and emitted aerosols toward the air curtain. High air exchange rates (ACR) of around 300 h−1 were achieved with the maximum volume flow of the air curtain and HEPA filters.
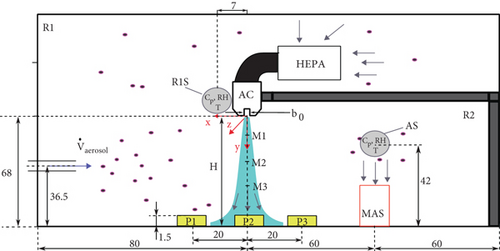

Bacterial samples were collected from four different locations. Active bioaerosol sampling (referred to as sampling location AS) was conducted at one location in R2 using active air sampling on an agar plate with the MAS-100 Eco (MBV) (see Figure 1). Three positions were selected for passive bacterial sampling in the air curtain impingement zone (where the air curtain flow meets the opposing surface and splits into positive and negative x-directions as indicated in Figure 1). The Petri dish (P1) was placed on the left side of the air curtain (x = +20 cm) in the subroom R1. It was closer to the aerosol generator than the other Petri dishes. Thus, the highest bioaerosol concentration was expected at P1. A second Petri dish (P2) was placed directly below the air curtain nozzle (x = 0 cm), and a third dish was placed to the right of the air curtain (P3) (x = −20 cm) in R2. The Petri dishes had a diameter of 10 cm. A total of six PM sensors were installed in R1 and R2. Two PM sensors were placed to the left of the air curtain at position (x = +7 cm, y = 0 cm) (denoted as R1S in Figure 1a). These sensors were positioned symmetrically in the z-direction (z = ±17 cm), as shown in Figure 1b. One sensor was placed to the right of the air curtain (AS), near the inlet of the MAS, and three additional PM sensors were placed 1 cm above the agar plates at positions P1, P2, and P3. Temperature and humidity were also measured at positions R1S and AS.
2.2. Test Organisms, Growth Conditions, and Production of the Simulated Microbiome
The organisms within the used bioaerosol are listed in Table 1 and were grown, as described in [19] using a total of three types of culture media: 2xReasoner’s 2A broth (TEKnova), tryptic soy broth (Sigma-Aldrich), and brain heart infusion broth (Sigma-Aldrich). Media compositions are listed in Tables S1–S3. The strains Burkholderia lata DSM 23089T, Enterococcus viikkiensis DSM 24043T, Propionibacterium cyclohexanicum DSM 16859T, Pseudomonas antarctica DSM 15318T, and Staphylococcus capitis DSM 111179 were grown for 18 h under constant shaking at 200 rpm, while the strains Corynebacterium halotolerans DSM 44683T, Flavobacterium frigoris DSM 15719T, Sphingomonas rubra DSM 26135T, and Streptococcus halotolerans DSM 101996T were grown for 48 h at 200 rpm. The composition of the bacterial strains and respective growth conditions used in this study are listed in Table 1.
| Strain | Growth | Reference |
|---|---|---|
| Burkholderia lata DSM 23089T | 2xReasoner’s 2A (2xR2A) 37°C | [23] |
| Corynebacterium halotolerans DSM 44683T | Tryptic soy broth (TSB) or agar (TSA) 37°C | [24] |
| Enterococcus viikkiensis DSM 24043T | Brain heart infusion (BHI) 37°C | [25] |
| Flavobacterium frigoris DSM 15719T | 2xReasoner’s 2A (2xR2A) 20°C | [26] |
| Propionibacterium cyclohexanicum DSM 16859T | Brain heart infusion (BHI) 37°C | [27] |
| Pseudomonas antarctica DSM 15318T | Tryptic soy broth (TSB) or agar (TSA) 20°C | [28] |
| Sphingomonas rubra DSM 26135T | 2xReasoner’s 2A (2xR2A) 20°C | [29] |
| Staphylococcus capitis DSM 111179 | 2xReasoner’s 2A (2xR2A) 37°C | [30] |
| Streptococcus halotolerans DSM 101996T | Brain heart infusion (BHI) 37°C | [31] |
Each culture (50 mL) was centrifuged at 323 g for 10 min. The supernatant was then discarded, after which the cell pellet was resuspended in 50 mL phosphate-buffered saline (PBS; Na2HPO4 7.0 g, KH2PO4 3.0 g, NaCl 4.0 g/L, pH 7.5). This step was repeated once. Then, the cell pellet was resuspended in 5–20 mL of PBS, depending on the cell density. For B. lata and S. capitis, the cell concentration used was ~108 CFU/mL, as determined by OD600nm measurement and standard plate count on 2xR2A agar. The other seven strains (see Table 1) were mixed to an equal total concentration of 108 cells/mL, which was also confirmed by plate counting on 2xR2A, TSA, and BHI agar. All cell suspensions were equally mixed in artificial saliva, which is based on the work of Woo et al. [32] and described in Table 2.
| Amount | Chemical component |
|---|---|
| 1.00 mL | Dulbecco’s modified Eagle’s medium (PAN-Biotech) |
| 0.88 g | NaCl |
| 0.42 g | NaHCO3 |
| 0.04 g | MgCl2∗6H2O |
| 3.00 g | Mucin |
Bacteria can be classified as either Gram-positive or Gram-negative. This classification offers insight into cell wall and membrane structure. It also influences factors such as antibiotic susceptibility and the ability to withstand stressors like desiccation. To reduce the spread of bacteria and understand the effectiveness of microbial countermeasures, it is essential to test a diverse range of species to obtain comprehensive results.
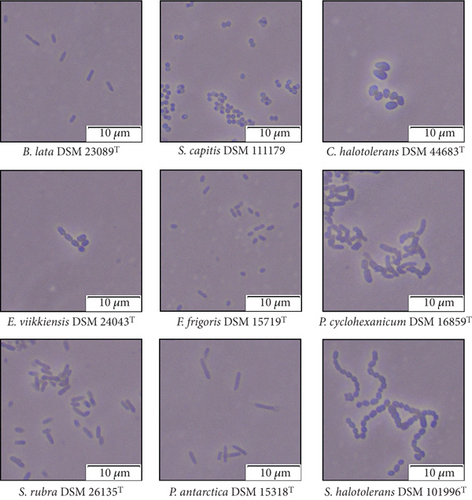
The bacterial species used in this study varied in size and shape. They ranged from approximately Dp = 0.5 to 5.0 μm. S. capitis displayed the smallest cells and P. antarctica displayed the largest cells (Figure 2). The shapes of the bacterial cells ranged from coccoid to rod-shaped to pleomorphic structures, either as single cells or in the form of diplococci, streptococci, or staphylococci. To determine the bacterial survival, we focused on two of the nine species. The selected bacteria, B. lata and S. capitis, harbor antibiotic resistance. B. lata is resistant to streptomycin, while the S. capitis strain used is resistant to rifampicin. This key feature enables clear separation from other airborne bacteria in the bioaerosol or from other sources of pollution during survival assays. Other distinguishing features of these two species are their size and shape (see Figure 2) and their Gram stain (see Table 3).
| Characteristic | S. capitis | B. lata |
|---|---|---|
| Length/size | 0.5–1.2 μm | 2.0–2.5 μm |
| Morphology | Coccoid | Rod-shaped |
| Antibiotic resistance | Rifampicin | Streptomycin |
| Gram-stain | Positive | Negative |
2.3. Bioaerosol Generation, Sampling, and Survival
2.3.1. Aerosol Generation
The aerosol was generated using a “Blaustein Atomizer” (BLAM, CH Technologies), connected to a control unit (CHƐST, CH Technologies). This setup was used in combination with a syringe pump and a 50 mL syringe containing the bacterial solution. Continuous aerosolization was achieved with an air pressure of 1.24 bar (18 psi). The BLAM nebulized the bacterial solution via four collision nebulization jets in MPA (multipass atomization) mode at a flow rate of 0.5 mL/min. Similar settings were used in the study by Danelli et al. [33], in which the nebulization efficiency for Escherichia coli ATCC 25922 was tested, achieving nebulization efficiencies approximately two to four times higher than other nebulizers. According to the manufacturer, the BLAM’s output particle diameter is generally between Dp = 0.001 and 10 μm. Massabò et al. [34] found that the mean size distribution of the generated particles is 0.45 μm (STD of 0.25 μm). For each ventilation configuration, the bioaerosol was nebulized for 10 min while the air sampler and PM sensors were operated. Before starting a new measurement, the particle concentration Cp (Dp = 0.3–10 μm) in the test chamber had to fall below a threshold of Cp < 20 cm−3.
2.3.2. Aerosol Sampling
The MAS-100 Eco was used for active sampling at position AS (see Figure 1). The device collects 100 L of aerosol per minute onto an agar plate. The collected bacteria can be retrieved from the plate afterwards. Thus, a total of 1000 L were sampled during the 10-min measurement intervals. Preliminary measurements were conducted to ensure sufficient bacteria were sampled [35]. The collection efficiency of impaction-based bioaerosol samplers, such as the MAS-100, is defined by the cutoff diameter D50. According to the manufacturer of the MAS, the cutoff diameter is D50 = 1.6 μm. This means that 50% of the particles with a diameter of 1.6 μm will adhere to the agar plate. Particles with a diameter greater than D50, and therefore greater inertia, are more likely to impact on the agar plates, resulting in a higher collection efficiency. Since S. capitis ranges in size from 0.5 to 1.2 μm and B. lata ranges from 2.0 to 2.5 μm, it is reasonable to hypothesize that higher concentrations of B. lata will be measured at the air sampler position. This assumes that the larger cells of B. lata have a higher mass or form larger particles during nebulization than the smaller cells of S. capitis.
In passive sampling, particles that result from settling or adhesive forces attach to the agar in the Petri dishes. It is a common technique used in numerous studies [21, 36] and has been known for a long time [37]. However, the quantity of sampled aerosol is usually unknown, which can lead to discrepancies between the different sampling methods. Passive sampling was used at positions P1, P2, and P3 in the impingement zone of the air curtain, where the air curtain flow reaches the bottom of the test chamber (see Figure 1). These positions were selected since Petri dishes are less disruptive to the air curtain flow in the impingement zone than the MAS, and the air curtain’s aerodynamic sealing remains undisturbed.
2.3.3. Determination of the Bacterial Survival
To analyze the dispersion of bioaerosols, the previously described bacterial community (see Table 1) was nebulized within the chamber and collected on the agar plates via passive and active sampling. The survival of the key species, which are resistant to antibiotics (see Table 3) on the agar plates, was evaluated exclusively. After each measurement, the agar plates (agar 15 g/L) used for active sampling were retrieved from the chamber, and 1.2 mL of PBS was distributed onto each Petri dish. The cell solution collected from the agar plate was used for survival analysis. To determine the bacterial survival in a cell suspension of B. lata, a 10-fold dilution series from 10−1 to 10−8 was prepared and plated on 2xR2A agar containing 150 μg/mL streptomycin. To grow S. capitis, 2xR2A agar containing 5 μg/mL rifampicin was used. The media plates were incubated for 2 days at 37°C. The concentration of surviving bacteria (Cb) was determined by counting colony-forming units (CFU). Prior to aerosolization, the bacterial community solution was also subjected to CFU per milliliter determination. The concentrations were found to be 7 × 10⁷ CFU/mL for B. lata and 1.7 × 10⁸ CFU/mL for S. capitis.
2.4. Measurement of the Aerosol Properties
Temperature and relative humidity were measured because they affect water evaporation and, consequently, the final particle size of the aerosol. These parameters also affect the survival of microorganisms and the transmission of infectious diseases, like influenza [38]. SHT85 sensors (Sensirion) were used to measure the temperature and relative humidity in the chamber with respective accuracies of ±0.1°C and ±1.5% RH. The chamber temperature remained nearly constant at 14.7°C (±0.8°C) throughout the measurements. The temperature difference between in front of (R1) and behind the air curtain (R2) was small during each measurement with ΔT1,2 < 0.4 K. We measured an average humidity of 63.4% RH (±5.4% RH) for all scenarios. During a single measurement, the humidity increased by approximately 5% RH due to the evaporation of the water within the aerosol particles. The minimum and maximum temperatures in the test chamber were 13.4°C and 15.9°C, respectively, and were directly influenced by the ambient laboratory temperatures.
Additionally, SPS30 PM sensors (Sensirion) were used to monitor the particle concentrations Cp (1/cm3) for particles with diameters in the size range of Dp = 0.3–10 μm. These optical sensors measure the scattered light from particles illuminated by a laser diode inside the sensor. According to the signal of the photo diode, each particle is sorted into a specific particle size interval (bin). In our study, we evaluated the following particle size intervals: Dp = 0.3–1.0, Dp = 1.0–2.5, Dp = 0.3–2.5, and Dp = 2.5–4.0 μm. These intervals cover the sizes of the studied bacterial species B. lata and S. capitis (see Figure 2) and also the majority (> 99%) of the particles that were generated by the BLAM. The PM sensors provide a number concentration precision for the particle sizes Dp = 0.3–2.5 μm (PM2.5) of ±100 cm−3 for concentrations Cp < 1000 cm−3 and ±10% of the measured value (m.v.) for concentrations 1000 < Cp < 3000 cm−3. For Dp = 2.5–4.0 μm (PM4), the accuracy is lower, with a maximum uncertainty of ±25% m.v. It has also been shown [39] that these sensors can be used for PM2.5 at higher concentrations of 3000 < Cp < 20,000 cm−3 with deviations from a reference particle sizer (OPS3300, TSI) of less than ±10% m.v. We did not observe particle concentrations greater than 18,000 cm−3 in our measurements. All sensors were connected to an open-source data acquisition system, and the PM data were recorded at approximately 1 Hz. Data acquisition was facilitated by the use of a mobile measurement system (MMS) developed at the German Aerospace Center (DLR). The MMS is completely open source [40] and includes various sensors that provide mobile, versatile measurement of different indoor air parameters [41].
2.5. Air Curtain
| Air curtain configuration: | (m3/h) | Reac | (m/s) | (m/s) | (m/s) |
|---|---|---|---|---|---|
| ACoff | 0 | 0 | — | — | — |
| AClow+HEPA | 244 | 4000 | 0.92 | 0.80 | 0.61 |
| AClow | 344 | 5700 | 1.67 | 1.14 | 0.60 |
| AChigh+HEPA | 446 | 7450 | 2.40 | 1.52 | 1.03 |
| AChigh | 623 | 10,400 | 3.46 | 2.62 | 1.82 |
Similarly to Ep, we also determined the ratio of local bacterial survival, Cb(x < 0) to Cb(x > 0), as described in Equation (3) and Section 2.3.3. Thus, a higher Ep indicates better protection of the air curtain against the spread of aerosol particles, while a higher Eb indicates better protection against the spread of viable bacteria. In our experimental setup, we calculated Ep and Eb on positions P1 and P3, where the air curtain flow impinges on the floor. The results will be shown and discussed in Section 3.4.
2.6. Statistical Analyses
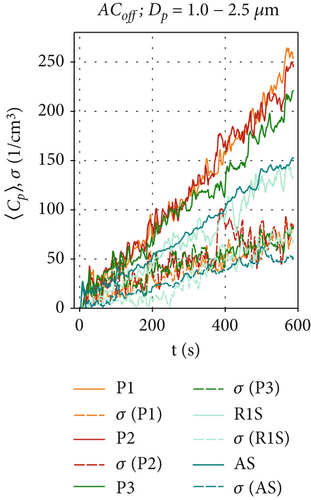
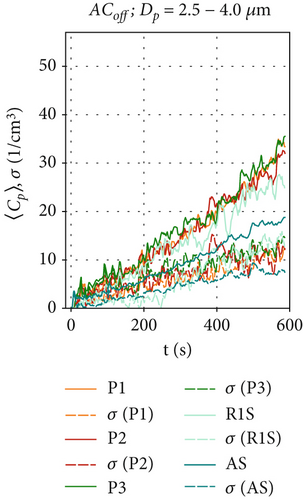
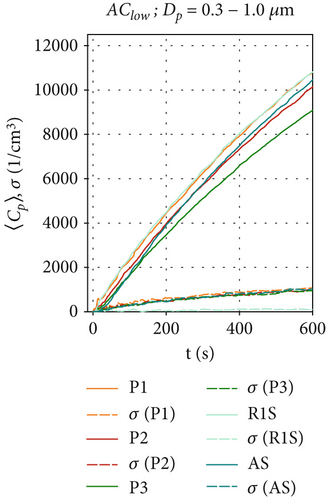
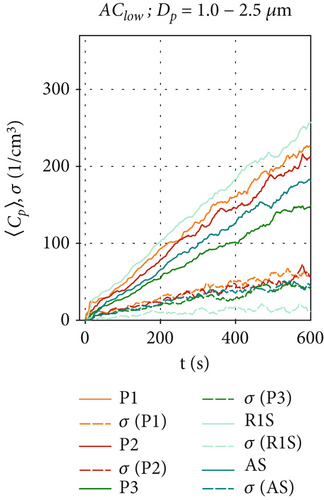
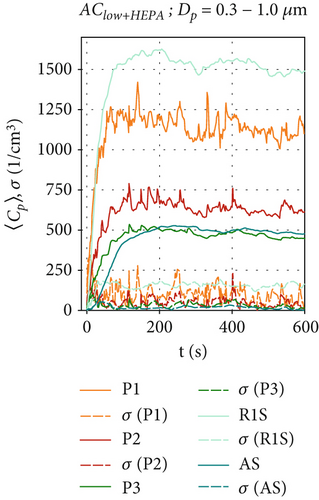
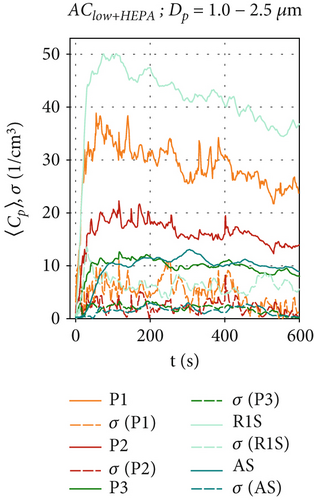
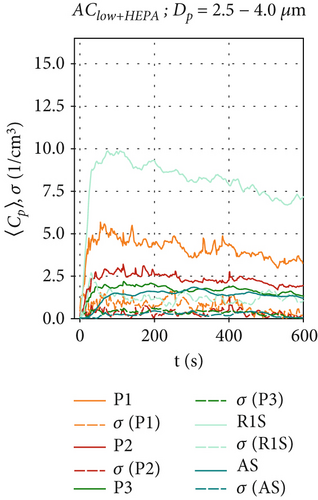
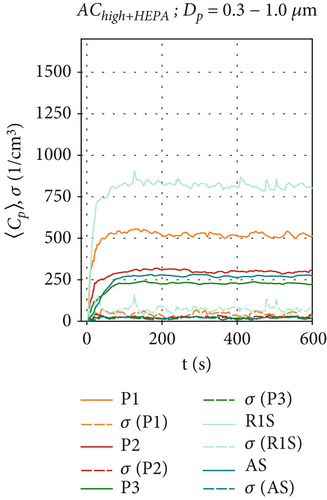
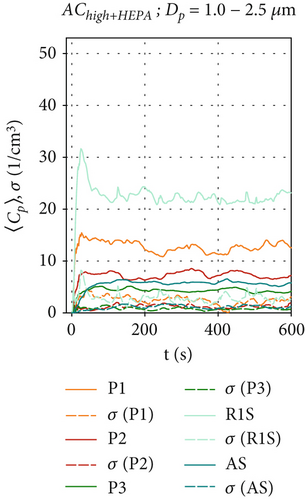
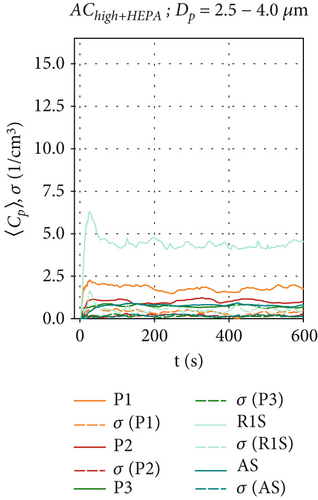
Regarding the triplicated, time-resolved PM measurements, the ensemble-averaged time series 〈Cp〉(t) is shown in Figures 3, 4, and 5 together with the respective standard deviations σ. The measurement of aerosol properties (see Section 2.4) and bacterial survival (see Section 2.3.3) for the five ventilation configurations (see Table 4) was performed in triplicate (n = 3). Student’s t-tests [43] were used to determine significant differences between the particle and bacteria data, as well as the decrease in particle and bacterial concentrations, respectively. If the variances of the two datasets were unequal, a Welch’s t-test [44] was performed instead since Student’s t-test assumes equal variance. If one of the datasets was not normally distributed, the Mann–Whitney U-test [45] was performed instead, as this test makes no assumptions about the distribution of the data. The Mann–Whitney U-test is a nonparametric test that does not rely on normal distribution. Significant differences were defined as p ≤ 0.05 ( ∗), very significant differences as p ≤ 0.01 ( ∗∗), and highly significant differences as p ≤ 0.001 ( ∗∗∗). These differences are shown in Figure 6 and subsequent figures. Significance tests were performed between ACoff and the scenarios with air curtain, as well as between the two datasets (particle measurements and bacterial survival) for the same ventilation configuration. All statistical analyses were performed using SigmaPlot 14.5 (Systat Software Inc.).
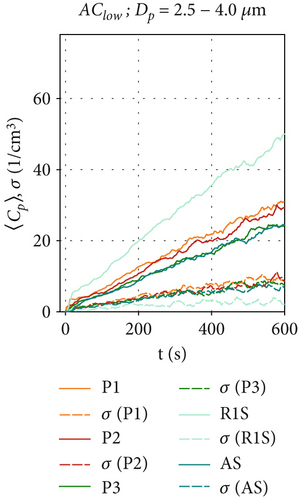
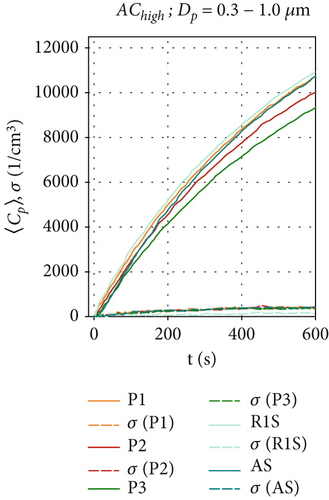
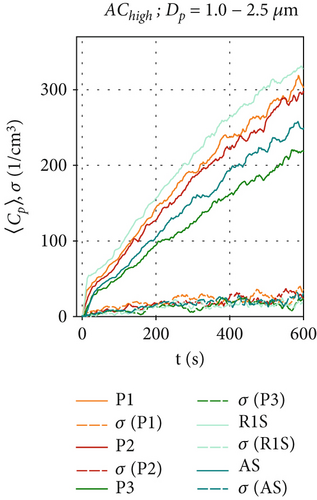
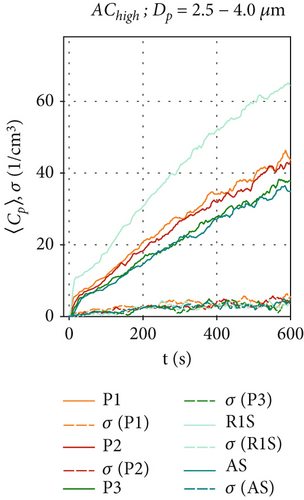
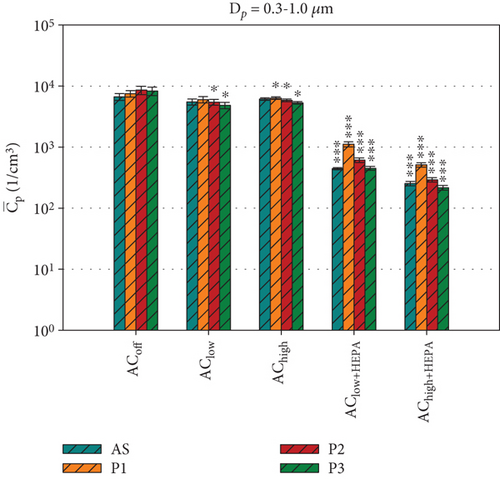
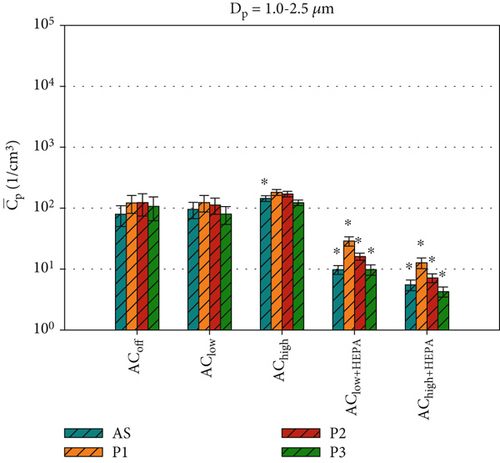
These time series were averaged over time to obtain the mean particle concentration and the respective standard deviations, which are shown as bar plots in Figure 6 and subsequent figures.
3. Results and Discussion
The Results and Discussion section is organized as follows: In Section 3.1, we analyze the local particle concentrations 〈Cp〉(t) for all ventilation configurations, as this is a common analysis for aerosol spread. Section 3.2 assesses the bacterial survival Cb of our bacterial test species, B. lata DSM 23089T and S. capitis DSM 111179, to provide an overview of both the particle concentrations and the bacterial survival. In Section 3.3, the local bacterial survival rates, which are expected to behave similar to the time- and ensemble-averaged local particle concentrations, are analyzed for all air curtain configurations. Finally, in Section 3.4, we evaluate the performance of PM and bacterial survival analysis with and without HEPA filters of varying effectiveness of the air curtain in preventing the passage of particles.
3.1. Evaluation Method 1: Local Particle Concentrations
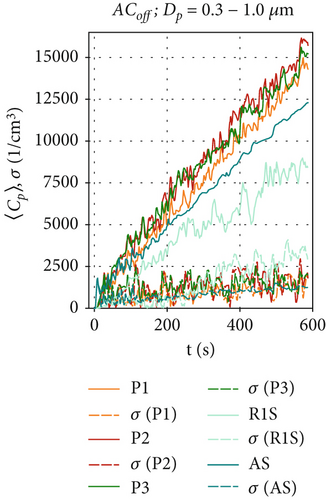
By measuring the local particle concentrations, we can determine the time-resolved particle dispersion inside our test chamber and quantify the effectiveness of the air curtain against the spreading of particles from the aerosol generator. Since the measured data contains few particles larger than 4 μm in diameter (which is consistent with the literature on the BLAM aerosol generator [35]), we will focus on the size range Dp = 0.3–4.0 μm. Figure 3 shows the ensemble-averaged concentrations 〈Cp〉(t) at positions R1S, AS, P1, P2, and P3 for the reference scenario ACoff. Figure 4 shows the results for the active air curtain but without HEPA filters. Figure 5 shows the results for the active air curtain with additional HEPA filters.
Figures 3a, 3b, and 3c are dedicated to particle concentrations for the reference scenario ACoff, with a deactivated air curtain (Re = 0), and for particle sizes: (a) Dp = 0.3–1.0, (b) Dp = 1.0–2.5, and (c) Dp = 2.5–4.0 μm. With the air curtain switched off, there is no additional forced mixing of the air in the test chamber other than the induced airflow induced by the particle source. This results in local particle concentrations differing by a factor of two depending on the particle size and measurement location, as illustrated in Figures 3a, 3b, and 3c). Additionally, local particle concentrations fluctuate significantly over time due to the transport of the turbulent flow structures within the test chamber for the ACoff configuration. This is also indicated by the considerable differences in the results obtained in these three individual measurements, shown as dotted lines, indicating the standard deviation of the ensemble average at time t of the measurement. The increase of the particle concentrations during the observed 600 s is nearly linear in Figure 3b,c. In contrast, a logarithmic increase is observed at R1S for the smaller particles (Dp = 0.3–1.0 μm). Since the particle production rate is constant for all measurements due to the constant supply rate from the CHƐST, differences in the time development of the particle concentration must result from differences in the settling, evaporation, or agglomeration of individual particles. The main reason for the different behavior of the smaller particles may be their higher sensitivity to turbulence-induced velocity fluctuations in the measurement chamber due to their lower mass and inertia. This could result in increased particle transport toward the chamber walls, where electrostatic or adhesive forces can trap them.
In comparison, Figures 4a, 4b, and 4c show the particle concentrations when the air curtain operates in the AClow configuration. Since there are no HEPA filters installed in this ventilation scenario, particle removal occurs only through gravitational, adhesive, and electrostatic forces. The particle concentration behind the air curtain is significantly lower than in the ACoff configuration. The concentrations exhibit a logarithmic increase at all positions, reaching a maximum 〈Cp〉 between 9000 and 11,000 cm−3 for the smallest particles in Figure 4a. This is due to the induced air curtain airflow, which facilitates mixing and reduces an inhomogeneous particle distribution within the measurement chamber for all measured particle sizes, thereby reducing high local maximum particle concentrations. This is supported by the fluctuations of 〈Cp〉(t) and also by the standard deviation σ of the ensemble-averaged measurements at all positions Pi, which are reduced compared to the ACoff configuration. Figure 4b shows that, for the size range of Dp = 1.0 - 2.5 μm, similar concentrations are measured at all positions (〈Cp〉(t = 600 s) = 150-260 cm−3) compared to the ACoff configuration. Only at position R1S, in front of the air curtain, we measure higher values 〈Cp〉(t = 600 s) ≈ 250 cm−3 compared to ~150 cm−3 in Figure 3b. We attribute this increase to the aerodynamic seal of the air curtain, which results in an increase in the particle-related air curtain effectiveness, Ep, as discussed further in Section 3.4. The lowest particle concentrations are measured at position P3 on the floor behind the air curtain. Figure 4c shows slightly increased particle concentrations for the size range of Dp = 2.5–4.0 μm compared to the reference scenario ACoff in Figure 3c. The highest values are measured at R1S with 〈Cp〉(t = 600 s) = 50 cm−3, continuing the trend shown in Figure 4b. Concentrations for this particle size range decrease with distance from the aerosol generator, with only little difference between positions AS and P3 behind the air curtain.
Figures 4d, 4e, and 4f show the particle concentrations when the air curtain is activated at the highest volume flow rate in the configuration AChigh. Figure 4d shows that for the size range of Dp = 0.3–1.0 μm, the concentrations 〈Cp〉(t) are similar to those in Figure 4a. As in Figures 3a and 4a, the increase in particle concentration follows a logarithmic behavior. This behavior is even more pronounced at AChigh and is also observable for particles larger than 1.0 μm in Figure 4e,f. These results can be attributed to an increased turbulence in the airflow, which increases the transport of particles toward the walls of the chamber, thereby increasing particle removal, as discussed above. The increased turbulence also enhances particles mixing in the chamber. Therefore, the fluctuations of 〈Cp〉(t) and of σ are further reduced compared to AClow. Figure 4f shows that for particle sizes of Dp = 2.5–4.0 μm, there is only little difference in concentration at positions AS and P3, illustrating the effective mixing of larger particles behind the air curtain. In contrast to that finding, 〈Cp〉(t = 600 s) at R1S, which is in front of the air curtain, is almost twice as high as at positions AS and R3, which are behind the air curtain. This indicates that the air curtain is already effective against larger particles in this ventilation scenario. Additionally, we measure higher total particle concentrations at all positions for the larger particles (Dp > 1 μm) than for ACoff and AClow. We attribute this result to the induced airflow in the chamber, which prevents particles from settling in R1 and R2.
Figure 5 shows the aerosol particle concentration 〈Cp〉(t) for the ventilation configurations with HEPA filters, which provide an additional source of particle removal in addition to the effects described earlier in this section. For the AClow+HEPA configuration in Figures 5a, 5b, and 5c, the particle removal is significantly enhanced, and a steady-state concentration is quickly reached (t ≤ 200 s) at all positions Pi, as the particle removal rate reaches equilibrium with the particle production rate in the chamber. The maximum concentrations are reached at position R1S for all particle sizes. As the distance from the BLAM increases, a clear reduction in particle concentrations is evident from in front of the air curtain (R1S), at the bottom (P1), directly under the nozzle (P2), and behind the air curtain (P3 and AS) for all analyzed particle sizes. Therefore, we can conclude that the air curtain significantly reduces the particle spread behind the air curtain (x < 0) in this HEPA filter scenario. Thus, an air curtain with HEPA filters could serve as an alternative retrofit for a passenger cabin if an additional fresh air supply is unavailable.
For AChigh+HEPA in Figures 5d, 5e, and 5f, steady-state particle concentrations were reached even faster (t≈120 s), as the particle removal rate has been further increased due to the higher flow rate and therefore higher filtration rates. AChigh+HEPA also shows the lowest particle concentration fluctuation and also the lowest σ for all sensor positions, especially for P3 and AS behind the air curtain. As discussed earlier, this is due to the increased mixing, which is enhanced by the higher volume flow configuration compared to AClow+HEPA. After particles in the size range of Dp = 0.3–1.0 μm reach their maximum concentration, they remain at a constant level, as shown in Figure 5d. The decrease in particle concentration of larger particles (> 1.0 μm), shortly after the start of the measurement (t ≈ 30 s) in Figure 5e,f for the positions P1, P2, and R1S, requires further investigation, as no reasonable explanation has yet found. It appears that the larger particles exhibit a distinct behavior when HEPA filters are integrated into the air curtain. A more pronounced effect is observed at sensor positions located at x ≥ 0, directly below and in front of the air curtain.
Figure 6 shows the average particle concentrations during the entire 600-s measurement period for all ventilation configurations. To make further comparisons between the two datasets in the following sections, we will compare the average particle concentrations at positions P1, P2, P3, and AS, where bacterial survival data was collected. Figure 6 shows the average particle concentrations for each position and ventilation configuration. These are compared via t-test to our reference configuration, ACoff. For the smaller particles (Dp = 0.3 –1.0 μm), which make up ~99% of all particles, a highly significant ( ∗∗∗) reduction of approximately one log count is found for all ventilation configurations, including HEPA filters at all measurement positions (see Figure 6a). For the AClow and AChigh configurations, the local measurements at P2 and P3 show a significant ( ∗) reduction in . For particle concentrations in the range of Dp = 1.0–2.5 μm (Figure 6b), significant reductions are only observed for AClow+HEPA and AChigh+HEPA. A significant increase in particle concentration at AS is found for the AChigh configuration in Figure 6b as well as for P1, P2, and P3 for Dp = 2.5–4.0 μm (see Figure S1). These results demonstrate a significant increase in particles in the size range of Dp = 1.0–4.0 μm for the configurations with an active air curtain but without HEPA filters. This is most likely due to the induced airflow in the chamber, which prevents particles from settling.
This section provided an overview of the dynamic particle behavior in the experimental chamber based on local PM measurements during five distinct ventilation scenarios. Increasing the air curtain volume flow resulted in an increased air curtain velocity with enhanced particle mixing in the measurement chamber. Without HEPA filters, the air curtain was more effective in reducing the dispersal of larger particles (> 1 μm) than smaller particles (< 1 μm). Scenarios with HEPA filters demonstrated a highly significant reduction in particles, particularly behind the air curtain, due to the additional filtration process.
3.2. Evaluation Method 2: Local Bacterial Survival
The survival of the two key bacterial species selected for this study, B. lata and S. capitis, represents the second assessment method for measuring the spread of potentially harmful bioaerosols, in addition to PM measurements. In the absence of time-resolved data, the local bacterial survival assessment provides specific insights into the effects of how environmental conditions, such as temperature and humidity, affect bacteria. These conditions were kept constant throughout the study. Figure 7 shows the local bacterial survival Cb at sampling position Pi with the associated standard deviations for all ventilation configurations that were investigated in this study. These were measured in triplicate. As was done for the data in Figure 6, t-tests were conducted for Cb at all sampling positions, comparing the data at each position Pi with the control configuration ACoff. It should be noted that the initial concentration of B. lata within the bacterial community was 7 × 10⁷ CFU/mL, while the concentration of S. capitis was 1.7 × 10⁸ CFU/mL. This was due to the limited precision possible in the bioaerosol production process. Regarding the overall bacterial survival achieved, the morphologically smaller species, S. capitis exhibits concentrations approximately 10 times higher than those of B. lata at all measurement positions in Figure 7. The highest viable cell concentration of S. capitis is collected by the MAS across all configurations. This outcome is expected, given the increased particle collection efficiency on the agar plate resulting from active sampling at a flow rate of 100 L/min. Since the air sampler’s cutoff diameter (D50) is 1.6 μm, particles smaller than 1.6 μm are collected with lower efficiency, while particles larger than 1.6 μm are collected with higher efficiency. Given the size range of Dp = 0.5–1.2 μm for S. capitis and Dp = 2.0–2.5 μm for B. lata, one might expect higher concentrations of B. lata to be collected by the MAS compared to S. capitis. However, this is not the case. In fact, the concentrations of S. capitis are consistently higher than those of B. lata across all sampling positions. Although the measured bacterial survival of B. lata is lower than that of S. capitis, some of these cells may still be metabolically active, as they can adapt to stress by reducing their reproduction rate as a survival strategy [46].
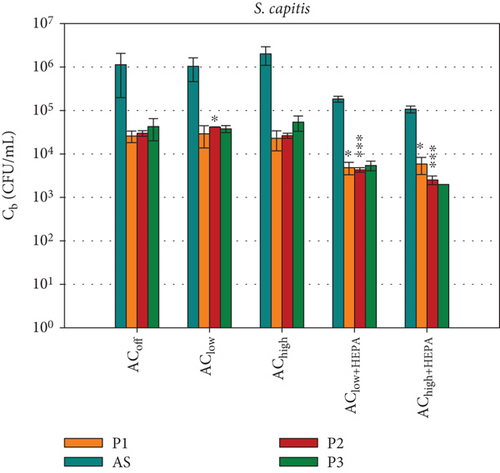
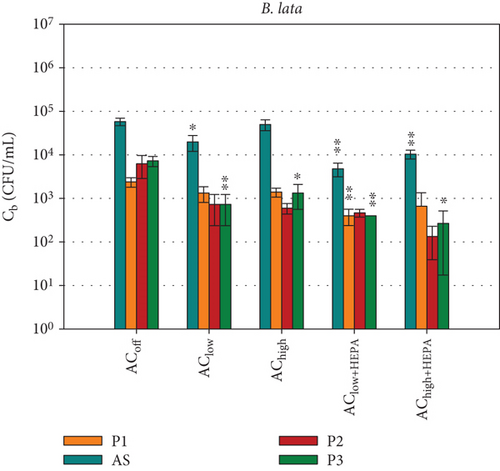
Figure 7a shows a gradual increase in S. capitis with increasing distance (P1→P3) for the ACoff and air curtain configurations without HEPA filters. This suggests that the air curtain has no measurable impact on the bacterial spread. Adding HEPA filters to the air curtain creates a distinct ventilation scenario, with a highly significant ( ∗∗∗) reduction in particles (as shown in Figure 6) and in bacterial survival at position P2, which is directly below the air curtain nozzle. Furthermore, a notable reduction of approximately one log scale is evident at all positions Pi. However, the t-test does not consider the reduction to be significant at positions AS and P3 because the standard deviations in the reference configuration ACoff are high. For the AChigh+HEPA configuration, the highest bacterial survival is observed at P1 (in front of the air curtain), and the lowest is observed at P3 (behind the air curtain). This is consistent with the measured particle concentrations in Figure 6.
Figure 7b shows the survival of B. lata. The highest concentrations are measured by the MAS behind the air curtain at position AS (Cb < 105 CFU/mL), while the concentrations at P1, P2, and P3 are below 104 CFU/mL. For the AChigh ventilation scenario, a clear trend is evident at position P3, where the decrease of Cb is significant ( ∗). For the AClow ventilation scenario, the decrease is very significant ( ∗∗).
For the configurations with HEPA filters, a very significant reduction is observed for AS, as well as for P1 and P3, with the AClow+HEPA configuration. It is noteworthy that the standard deviations for B. lata are increased for AChigh+HEPA at P2 and P3. This is hypothesized to be due to the low total bacterial concentration of B. lata (Cb < 400 CFU/mL), resulting from increased particle removal, as discussed in the previous section. This emphasizes the importance of adapting the initial cell count in the bioaerosol to the ventilation configuration.
The most reasonable explanation for our findings is the correlation between the bacterial size and shape and the particle size distribution of the aerosol generator [34]. S. capitis has coccoid cells that are smaller in size, while B. lata has slightly larger rod-shaped cells (see Figure 2). It is reasonable to assume that B. lata is more susceptible to external forces acting on its cell walls during aerosol generation or sampling. This would ultimately result in a reduced survival rate compared to S. capitis. Another possible explanation lies in the characteristics of the cell walls of both species. S. capitis is Gram-positive, while B. lata is Gram-negative, resulting in different cell wall properties of both species. Gram-positive bacteria are generally more resistant to desiccation than Gram-negative bacteria [47, 48], but further research is necessary to quantify the influence of these parameters.
The survival of the two species differed significantly between the two air sampling methods. This finding is consistent with the fact that passive and active sampling impact microorganisms in distinct ways [49]. For passive air sampling, survival can differ depending on cell size and shape [50]. Mainelis observed that the selection of an air sampler and the selection of the bacteria to be tested both significantly influence survival [51]. We aimed to increase comparability for further studies on airborne bacterial dispersal by using a defined bioaerosol in a controlled laboratory setting with controlled environmental conditions under five distinct ventilation scenarios. Our results highlight the importance of considering a diverse range of bacterial species in order to detect variations in survival under different environmental conditions.
3.3. Comparison Between Both Evaluation Methods
3.3.1. Absolute Concentrations
The number of viable bacteria or active virions per particle is an important parameter for calculating infection risks and dose–response models. While the D50 of the MAS is known, its collection efficiency across the entire particle size is not. Thus, the following comparison of the two investigated quantities of bioaerosol dispersal is limited to the measured absolute concentrations of particles , calculated as an average over the course of 600 s of the measurement time, and bacterial survival Cb, representing the total number of sampled bacteria over the entire measurement duration. Nevertheless, active bacterial sampling by the MAS is a more reliable sampling strategy than passive bacterial sampling in varying ventilation scenarios. For this reason, we focus on the active sampling technique for the comparison of the absolute concentrations in Figure 8. This figure compares the absolute concentrations of sampled particles of Dp = 1.0–2.5 μm and the survival of the two key bacterial species for all five distinct ventilation scenarios at the AS position. This particular size range was chosen due to the alignment between cell size (see Table 3) and particle size. For completeness, a comparison with the other particle sizes is shown in Figure S2, revealing similar trends in both datasets.
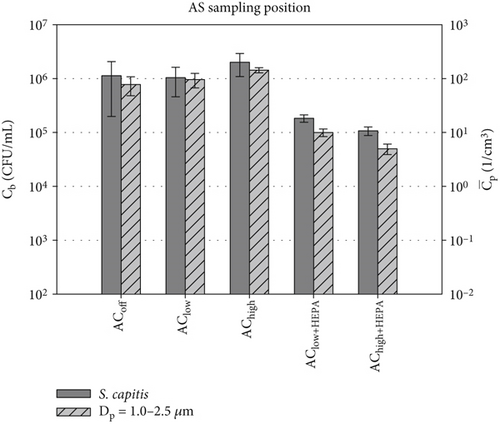
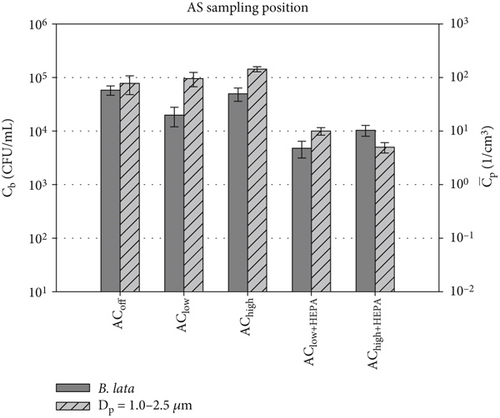
Figure 8a shows a notable agreement between the particle concentration and the bacterial survival of S. capitis in configurations without HEPA filters. Both quantities increase in the AChigh scenario, and the standard deviation significantly decreases for both datasets. The measured particle concentrations in this size range are approximately four orders of magnitude lower than Cb of S. capitis. Therefore, a different scaling was selected for the log-scaled y-axis for both datasets. There is less agreement for the configurations with HEPA filters. Nevertheless, a notable decline of approximately one log count is evident when comparing AClow+HEPA to AChigh for both datasets. Furthermore, both bioaerosol dispersion measurement methods demonstrate a reduction toward the AChigh+HEPA scenario. The standard deviation for both datasets decreases compared to the ventilation scenarios without HEPA filters.
Figure 8b presents a comparison between B. lata and particles with diameters between Dp = 1.0 and 2.5 μm. Given that B. lata is slightly larger than S. capitis (see Table 3), similar or even better agreement with the particle data of that particular size range was expected. However, the observed agreement between the PM data and Cb is less pronounced, especially in the context of the AClow scenario. A reduction in Cb is evident for the HEPA configurations. The factors contributing to the observed discrepancy in the behavior of the two bacterial species can be attributed to a wide range of potential causes. First, fluctuations in the viable cell concentration of the bioaerosol impact the biological data. Second, the effect of atomization by the four BLAM nozzles on the distinct bacterial species is unknown. Nevertheless, the BLAM was identified as the most suitable and least harmful nebulizer in the study by Danelli et al. [33]. The impact of the nebulization process on the cells was outlined in Section 3.2. Finally, the potential for codependencies among the nine species under study may affect the bacterial viability in the air or on the sampling medium.
3.3.2. Normalized Concentrations
After analyzing the absolute data for bacterial survival and particle concentrations, each dataset (Cb and ) is normalized with the corresponding ACoff data, as shown in Figure 9. This allows us to identify the effects of the applied ventilation configuration while reducing the influence of different initial concentrations of B. lata and S. capitis in the artificial saliva. Therefore, it is reasonable to hypothesize that the normalized evaluation data for each position Pi, and Cb,norm = (Cb,i(AC)/Cb,i(ACoff), will exhibit similar behavior under equal environmental conditions which were achieved inside the experimental chamber. Figure 9 also shows the results of t-tests conducted to analyze the relationship between the normalized particle concentrations and the normalized bacterial survival rates at each position by comparing the two datasets of Cb and , respectively.
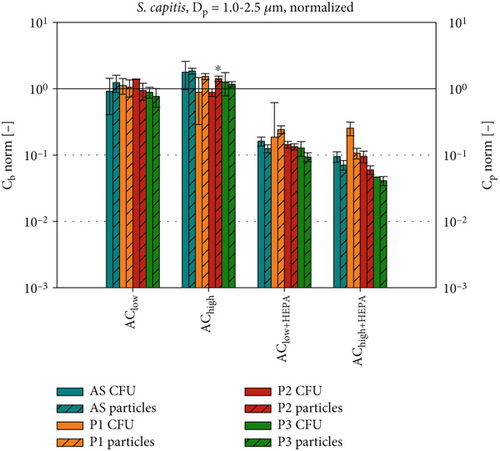
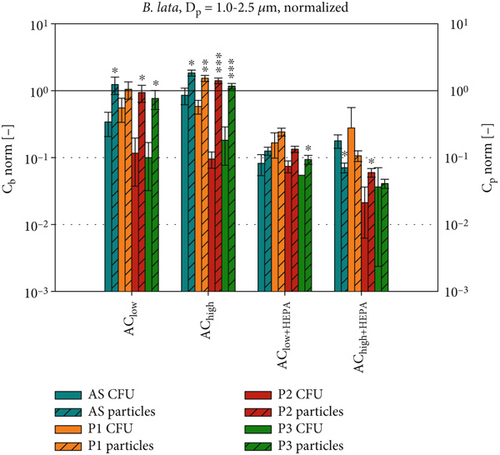
The two methods of assessing bioaerosol dispersion show best agreement for Cb,norm of S. capitis (Figure 9a), which displays a pattern comparable to Cp,norm for Dp = 1.0–2.5 μm. Notably, the particle concentrations are more similar to those of S. capitis than to those of B. lata (Figure 9a,b). This can be attributed to the size and shape of the cells of S. capitis in comparison to the cells of B. lata, as previously described. A comparison to particles in the 0.3–1.0 μm size range is presented in Figure S3a,b. Regarding B. lata (Figure 9b), it is observed that only the HEPA filter configurations of the air curtain result in a comparable reduction of approximately 90% for both bacteria and particles. The agreement between B. lata and the particle concentrations of Dp = 0.3–1.0 μm (see Figure S3b) is found to be similar to that observed with Dp = 1.0–2.5 μm in Figure 9b.
Our findings highlight the heterogeneous behavior of different bacterial species during airborne transmission. Therefore, we recommend implementing a defined testing strategy to evaluate the susceptibility of opportunistic bacteria to environmental conditions during airborne transmission. Our results also demonstrate good agreement between measured bacterial and PM concentrations for S. capitis. Thus, its transmission pathways under similar environmental conditions could be traced using only PM measurements. Furthermore, combining both measurement methods allows for the development of optimized microbial countermeasures for future use in indoor environments such as the passenger cabins of trains and aircraft.
3.4. Air Curtain Effectiveness
This final section presents an assessment of the effectiveness of the considered air curtain system in mitigating the spread of the bioaerosol within the test chamber. The particle-based air curtain effectiveness, denoted as Ep, is calculated according to the formulation presented in Equation (2) of Section 2.5. A comparison is made with the bacterial related air curtain effectiveness Eb as defined in Equation (3). These calculations are performed at sampling positions P1 (in front of the air curtain) against P3 (behind the air curtain). Both positions are equidistant from the center plane of the air curtain at a distance of x = ±20 cm (see Figure 1). It should be noted that active and passive bacterial sampling are subject to different physical effects during the sampling process, as previously discussed. These effects depend heavily on the flow field at the sampling position; thus, the results may vary considerably for the different air curtain Reynolds numbers and for the two sampling methods.
As illustrated in Table 5 (first row) and previously in Figures 3, 4, 5, 6, and 7, a high transport of bioaerosols into R2 was measured when the air curtain was inactive. The data indicate negative effectiveness for both Ep and Eb, meaning that there is higher concentration of particles and bacteria at P3 behind the air curtain than at P1 in front of it. The values for Eb for S. capitis (−0.64) and B. lata (−2.04) are significantly lower than the values for Ep across all particle sizes.
| S. capitis | B. lata | Dp = 0.3–1.0 μm | Dp = 1.0–2.5 μm | Dp = 2.5–4.0 μm | |
|---|---|---|---|---|---|
| Eb (−) | Eb (−) | Ep (−) | Ep (−) | Ep (−) | |
| ACoff | −0.64 | −2.04 | −0.10 | 0.12 | −0.07 |
| AClow | −0.30 | 0.45 | 0.20 | 0.36 | 0.23 |
| AChigh | −1.36 | 0.05 | 0.16 | 0.33 | 0.20 |
| AClow+HEPA | −0.12 | 0.00 | 0.60 | 0.66 | 0.59 |
| AChigh+HEPA | 0.66 | 0.60 | 0.58 | 0.66 | 0.60 |
The second row of Table 5 shows the effectiveness of the air curtain for both bacterial species in the AClow configuration. The effectiveness for S. capitis (Eb = −0.3) differs greatly from that for B. lata (Eb = 0.45). The same is true for the AChigh configuration, as shown in the third row of Table 5. Although the standard deviation of Cb for S. capitis (see Figure 7a) were remarkably low for the AChigh configuration, future comparisons of active bacterial sampling methods, such as those used by the MAS, may yield more comparable results for Eb than passive sampling on agar plates. Regarding Ep in both configurations, a reduction to Ep = 0.2–0.36 for AClow and to Ep = 0.16–0.33 for AChigh is observed. This indicates that the air curtain is effective in reducing particle spread for both configurations, with a slight advantage for the lower Reynolds number configuration AClow in our specific geometric setup (see Figure 1). Additionally, a higher Ep is observed for AClow and AChigh configurations for particle diameters > 1 μm, as discussed earlier in relation to Figure 4.
In the last row of Table 5, there is good agreement between Ep and Eb for the AChigh+HEPA configuration. For both bacterial species and the particle diameters smaller than 4.0 μm, the values range from 0.58 to 0.66. The highest bacterial air curtain effectiveness (Ep = 0.66) is associated with S. capitis. This species exhibited lower standard deviations in the triplicate measurements (Figure 7) and also better agreement with the (normalized) particle concentrations in Figures 8 and 9 for Dp = 1.0–2.5 μm. Therefore, a very good agreement with the particle-based effectiveness (Ep = 0.66) for medium-sized particles (Dp = 1.0–2.5 μm) was expected for the AChigh+HEPA configuration. For B. lata, the highest agreement is observed between Eb and Ep for Dp = 2.5–4.0 μm, with a value of 0.60 for both. This may be attributed to the larger cell size and the rod-shaped morphology of B. lata (see Table 3 and Figure 2).
The AChigh+HEPA configuration shows nearly identical values to the AClow+HEPA configuration, with regard to Ep for all investigated particle sizes. However, a notable shift is observed in Eb, with the air curtain effectiveness declining for S. capitis (−0.12) and B. lata (0.00) compared to the AChigh+HEPA configuration. As previously mentioned, these discrepancies are due to the different flow regimes of the air curtain (Reynolds number reduction from 7450 to 4000), resulting in different sampling conditions at P1 and P3, respectively.
Further measurement campaigns should include flow field measurements near the Petri dishes to gain a deeper understanding of these findings. The sensor-based results of Ep in Table 5 also elucidate two important findings. First, applying fresh or filtered air when using the air curtain as an indoor ventilation concept is crucial to mitigate the spread of airborne pathogens. Second, increasing the volume flow and the Reynolds number Reac from AClow+HEPA to AChigh+HEPA does not necessarily increase the effectiveness of Ep. In fact, it decreases by 0.02 for the particles with Dp = 0.3–1.0 μm, indicating a dependency of Ep (Re, Dp), as discussed in the literature [17, 42]. When considering a potential application in the passenger cabin or other indoor environments, it is important to bear in mind that HEPA filters create additional resistance to airflow. Consequently, more power is needed to operate the air curtain and achieve sufficient airflow for aerodynamic sealing. We recommend using fresh air to power the air curtain; however, this may also depend on the air quality and climatic conditions of the ambient fresh air and may not always be possible, for example, in an air craft cabin or subway train. Regarding Ep and thus Eb, it is difficult to predict the effect of changing to a more realistic geometric scenario. Several studies, for example, the one by Kurec et al. [18], aim to implement air curtains in realistic geometries. However, factors such as the position of the suction ports for the exhaust air remain very relevant. Adapting the flow parameters to the respective geometry and boundary conditions will remain necessary to achieve an optimal balance between energy consumption and reducing bioaerosol dispersal, thereby improving air quality.
4. Conclusions and Outlook
- A.
The bacterial input was a defined mixture of a total of nine bacterial species in artificial saliva, representing genera commonly found in aircraft and subway systems. This approach provides a realistic representation of actual bioaerosols. The bioaerosol was nebulized using a well-established bioaerosol generator. Sampling was performed passively on agar plates positioned in the impingement zone of the air curtain and actively via an aerosol sampling device behind the air curtain. Two species, B. lata and S. capitis (representing Gram-negative and Gram-positive bacteria, respectively), were subjected to selective evaluation based on their resistance against the antibiotics streptomycin and rifampicin, respectively. Cultivating both species allowed us to determine bacterial survival for all tested air curtain configurations. Significant discrepancies were observed between the two sampling techniques and the two species. The active aerosol sampling method demonstrated significantly higher bacterial survival due to the increased collection efficiency. In contrast, the passive sampling method yielded bacterial survival counts that were approximately 1.5–2 log counts lower. A comparison of the bacterial survival of B. lata and S. capitis using both sampling methods revealed lower concentrations of 1–1.5 log counts for B. lata than for S. capitis. This difference can be attributed to the different characteristics of the species (morphology, size, desiccation resistance, etc.), which influence their survival (e.g., during nebulization). Due to limited precision in the production process, a slightly lower initial concentration of B. lata was found in the bioaerosol before nebulization. Additionally, the difference in local survival between the two bacterial genera emphasizes the need for caution when performing quantitative analyses. These results highlight the importance of using a combination of different bacterial strains and standardized methods when investigating the transmission routes of potentially harmful bioaerosols. Nevertheless, our defined bioaerosol remains a suitable tool for analyzing bioaerosol dispersal.
- B.
The comparison of the local PM measurements with the local bacterial survival (determined by active and passive particle sampling) showed that the particle measurements were more sensitive to the different flow configurations of the air curtain than the biological evaluation tool. Another advantage of the PM measurements is the temporal resolution of the data, which provides additional information on the dynamics of aerosol spread. This makes PM measurements advantageous when designing a specific ventilation system or adjusting its parameters. Including bacterial survival is important when evaluating system parameters that cannot be assessed through aerosol particle counting alone. These factors may include temperature, humidity, radiation, or biochemical reactions, which can affect pathogens during airborne transport from a source of contamination to a potentially susceptible individual. As these parameters did not vary during our measurements, we expected a good agreement between the number of airborne particles and the number of viable bacteria collected. Indeed, the agreement between S. capitis and the measured particle concentrations in the size range Dp = 1.0–2.5 μm was remarkable when comparing the bacteria sampled from the air sampler. However, the agreement between the survival rate of B. lata and the actively sampled particles in the specified size range was less pronounced. Normalizing the bacterial and particle data to our reference configuration with the air curtain deactivated showed that S. capitis reflected changes in particle concentration more accurately than B. lata did. These different results highlight the varying behavior of bacterial species, an important consideration when performing and interpreting studies on bioaerosol dispersal.
- C.
Adjusting the fan speed and using HEPA filters resulted in five distinct air curtain Reynolds numbers (Re < 11, 000) and a variation of the air curtain flow field. Using the previously described sensor-based and biological evaluation tools at designated points on the floor in front of and behind the air curtain (P1/P3), we assessed the effectiveness of the air curtain in preventing bioaerosol dispersion. When the air curtain was inactive, strong fluctuations in particle concentrations in the chamber were measured over time. Regarding the microbial evaluation method, the air curtain effectiveness reached values of up to −2.04 for B. lata and −0.64 for S. capitis, indicating that up to 204% more bacteria were sampled behind the air curtain than in front of it. The PM sensor-based evaluation method yielded values of −0.1 for the smaller particles (0.3–1.0 μm) and up to 0.12 for the larger particles (1.0–2.5 μm). The activation of the air curtain resulted in a particle-related effectiveness of 0.2 for smaller (< 1 μm) and 0.36 for larger particles Dp = 1.0–2.5 μm. Adding HEPA filters significantly increased the effectiveness for the smaller and the larger particles due to particle removal at the air curtain inlet. Therefore, a comparison of the effectiveness between the different configurations was not in the scope of our studies. In the HEPA scenario, the effectiveness against the smaller particles reached 0.58, while the effectiveness against the larger particles reached 0.66. In this configuration, the effectiveness against bacterial spread was evaluated at 0.60 and 0.66 for B. lata and S. capitis, respectively. The good agreement between the two measurement techniques for this final configuration indicates that the bacterial-based results obtained from the Petri dishes were significantly influenced by the local air velocities, which affected the settling characteristics of the particles on the Petri dishes. Further studies should use multiple active aerosol samplers in front of and behind the air curtain as this method is less sensitive to variations in local air velocity. However, passive sampling, for example, in the air curtain impingement zone can provide valuable information on bioaerosol spread, but quantitative analyses must be carried out with caution.
Our study indicates that the defined bacterial bioaerosol served as an appropriate reference standard that facilitated a deeper understanding of the spread of potentially harmful bioaerosols. Comparing PM concentration with bacterial survival showed better agreement for S. capitis. A broader evaluation of all nine bacterial species present in the bioaerosol could provide a more comprehensive understanding of their specific airborne survival and behavior. Studies using single model organisms would be interesting to investigate the effect of using single organisms versus a microbial community that resembles a more realistic reference. The air curtain reduced the spread of bioaerosols in the test chamber. It was most effective with particles between 1.0 and 2.5 μm in diameter. As expected, the configurations that included additional HEPA filters achieved higher particle removal rates. Changes in environmental parameters such as humidity, temperature, and UV radiation, which directly affect bacterial survival, can be the subject of further measurements. Additionally, conducting experiments in a cabin-like environment can account for factors such as cabin dimensions, seating arrangements, headrests, doors, and other features. Before integrating the air curtain into an overall ventilation strategy, however, the thermal comfort of passengers in the vicinity of the air curtain’s strong airflow must be assessed.
This study introduced a standardized bioaerosol and reliable, straightforward detection methods. Using these methods in a defined indoor environment, we compared the spread of two bacterial species from the bioaerosol across five different ventilation scenarios. This comparison allowed us to evaluate the methods against each other and investigate bioaerosol transmission in depth. This study will facilitate the testing and evaluation of novel measures for airborne microbial reduction in future applications.
Conflicts of Interest
The authors declare no conflicts of interest.
Author Contributions
Yen-Tran Ly and Andreas Kohl share joint first authorship.
Funding
This work was funded by the GANDALF project of the German Aerospace Center (DLR). Open Access funding was enabled and organized by Projekt DEAL.
Acknowledgments
We thank Felix Werner, Andrea Schroeder, and Alessa Schiele for their help during the experiments and Christoph Steger for building the experimental chamber. We especially thank Ralf Moeller for his unlimited support for this project and beyond. This publication represents a component of Y.-T.L.’s doctoral (Dr. Rer. Nat.) thesis in the Faculty of Natural Science at the Justus Liebig University Giessen, Germany. This publication represents a component of A.K.’s doctoral (Dr. Ing.) thesis in the Faculty of Mechanical Engineering at the Technische Universität Ilmenau, Germany.
Open Research
Data Availability Statement
Data are available on request.


