Protective and Restorative Effects of Biophilic Design in High School Indoor Environments on Stress and Cognitive Function
Abstract
Mental health is a significant concern for teenagers. Given that about 80% of Chinese high school students spend the majority of their time indoors on campus, school environments present opportunities not just for learning but also for reducing students’ stress and promoting their well-being. Previous research has shown that direct interactions with natural elements such as green plants have restorative effects, but limited attention has been given to indirect interactions with nature. We investigated the impact of three design forms—nonbiophilic, curved, and biomimicry—within school corridors and classrooms on Chinese high school students’ stress and cognitive functions. We employed a combination of subjective assessments and objective measurements to examine the protective and restorative impacts of these three design forms and utilized virtual 3D models in order to control confounding environmental variables during a visual experience. Through virtual reality simulations involving 96 participants, we collected physiological responses, including skin conductance level, heart rate, indicators of heart rate variability, and cognitive responses, including creativity and attention test scores, to evaluate participants’ changes in stress levels and cognitive performance. Our results indicated that indirect exposure to nature, particularly curved forms, facilitates greater cognitive improvement and stress reduction, whereas nonbiophilic forms offer enhanced stress protection benefits. Therefore, learning environments with nonbiophilic design may be more suitable for tasks that induce stress, such as classes and examinations. Learning environments that feature curved biophilic forms may be better suited for promoting relaxation, creativity, and attention.
1. Introduction
1.1. The Mental Health of Adolescents
Students encounter heightened academic stress, longer study hours, and limited extracurricular activities at the high school level than at other stages of education, which could lead to significant physical and mental health challenges [1, 2]. The World Health Organization (WHO) reported that mental health issues are a primary concern among adolescents; in 2021, approximately 13% of individuals aged 10–19 experienced conditions such as depression and anxiety. Most high school students’ psychological development is not yet fully matured, which renders them vulnerable to various mental health issues influenced by environmental factors, including rebellion, low self-esteem, social withdrawal, attention deficits, anxiety, insomnia, and hair loss, which significantly impacts their overall well-being and academic performance [3, 4]. According to the WHO, adolescents’ mental health problems could impede physical, psychological, and intellectual development and profoundly affect their adult lives [5].
1.2. The Impact of School Environments
The school campus serves as the primary environment for daily learning and living activities and significantly shapes students’ experiences. Learning is influenced by four factors: systems and processes, products and services, communication, and environment, of which the environment, in particular, critically affects student behavior [6]. Increasing evidence suggests that physical characteristics of learning environments such as temperature, air quality, lighting, acoustics, color schemes, furniture, and natural elements impact student health [6–9]. Features of classroom spaces, including seating arrangements, density, privacy, and the presence of windows, influence student behavior, attitudes, and performance [10, 11]. The quality of school environments is closely associated with students’ psychological well-being and thus holds significance for students, faculty, and parents, which ultimately impacts societal productivity.
High school students spend a considerable amount of time on campus, and therefore, the school environment plays a pivotal role in their development [12]. Surveys indicate that approximately 80% of Chinese high school students spend their time learning and engaging in activities within indoor environments. School environments not only serve as learning spaces but also as areas for relieving study fatigue and enhancing students’ physical and mental health. Kaplan [13] explored the psychological effects of outdoor activities and introduced the concept of a “restorative environment,” suggesting that natural settings help individuals reduce stress and associated negative emotions, alleviate psychological fatigue, and promote mental and physical health. Hartig et al. [14] further defined “restoration” as the process of regaining physiological, psychological, and social abilities lost during adaptation to external environments.
1.3. The Benefits of Biophilic Design
Biophilic design stems from the biophilia hypothesis, which posits that humans possess an innate connection with the natural world and emphasizes the importance of contact with nature for human well-being. In essence, biophilic design advocates for the integration of natural systems and processes into artificial environments [15]. Fundamental to biophilic design is the incorporation of natural features and systems into living spaces, thereby increasing opportunities for human interaction with the natural world. For instance, biophilic design in architectural settings integrates elements such as natural lighting and ventilation, green spaces, and other natural components to foster healthier and more efficient built environments. Research suggests that biophilic design can influence brain function; biophilic elements in hospital wards have been shown to reduce tension and elicit positive emotional responses [16]. Studies have also demonstrated that natural lighting, ventilation, greenery, large windows, indirect connections to nature, and natural materials significantly enhance student satisfaction [17]. Biophilic design has been demonstrated to yield health benefits across physical, psychological, and behavioral domains and can therefore offer restorative advantages for students’ overall well-being [18–20]. Therefore, the biophilic design holds crucial importance in contemporary school environments, particularly in light of postpandemic and climate change challenges, where students’ connection to the natural world may be diminished, and adolescent health issues are closely linked to the school environment. Biophilic design not only enhances the restorative qualities of learning environments but also plays an essential role in shaping students’ educational experiences and living spaces. This approach helps alleviate the stress and anxiety often induced by classroom learning while simultaneously replenishing students’ cognitive abilities.
1.4. Indirect Experience of Nature
Classification of various biophilic design strategies into three sensory experiences—direct experience of nature, indirect experience of nature, and experience of space and place—provides a comprehensive framework for understanding biophilic design’s multifaceted applications [21]. Indirect experience of nature integrates into spatial design biophilic forms, patterns, and processes, including natural shapes, organic forms, geometric patterns inspired by nature, and biomimicry design principles. Natural forms are highly diverse and can manifest in architectural elements such as leaf-like patterns on columns, plant shapes on building facades, or animal facsimiles woven into fabrics. These forms, while not directly occurring in nature, draw on common design principles found in the natural world and can transform a static space into one with the dynamic qualities of living systems. Curvature is widely regarded as a “biophilic” parameter ([22]; DESIGN; [21, 23]). For example, the “wings” of the Sydney Opera House evoke the characteristics of a bird, the stained glass windows of Notre Dame resemble a rose, and the skyline of some cities mimics the vertical heterogeneity of a forest. Natural geometry refers to mathematical properties commonly found in nature, including curved rather than rigid forms, hierarchical scales, and self-repeating patterns. Curved geometries are not simply a design choice; they reflect natural principles such as the golden ratio and the Fibonacci sequence, which are deeply connected to natural forms [15, 21, 24]. These organic elements serve as visual stimuli that deepen individuals’ connection to nature, thereby positively influencing human psychology. In the realm of design, there is a deliberate emphasis on natural shapes, curves, fluidity, and organic structures over rigid geometric forms, which results in dynamic and vibrant design aesthetics. The seamless integration of these biophilic elements can create a more immersive and enriching environment and foster a profound sense of connection to the natural world.
1.5. Virtual Reality (VR) for Biophilic Design Studies
VR technology has become a key tool in design research and practice, enhancing built environment processes and enabling effective preliminary assessments of biophilic design interventions through its immersive and low-cybersickness features. VR is also widely used in studies on productivity, comfort, and behavior, incorporating cognitive tests and surveys. For instance, VR forest environments revealed comparable restorative effects to those of real forest settings; in fact, VR environments were often perceived as more appealing and cohesive [25]. Similarly, Li et al. [26] demonstrated the positive impact of VR urban scenes on psychological restoration and noted significant enhancements in self-efficacy for cognitive recovery and activation of the frontal lobe, which contributes to cognitive restoration among individuals with mild-to-moderate anxiety and depression. Ojala et al. [27] simulated natural window views using VR technology and observed positive effects on emotion and creativity. Specifically, Yin et al. [20] utilized VR experiments to investigate the restorative benefits of outdoor window views and indoor biophilic design environments on users’ physiological and psychological indicators, and their results indicated the advantages of different landscapes and biophilic design elements. Studies have further shown that biophilic design in indoor office settings can reduce stress and enhance cognitive functions such as attention and creativity [28]. Moreover, incorporating biophilic elements into VR environments has been found to significantly improve cognitive performance, lower perceived stress levels, and foster a stronger connection to nature among university students [29].
1.6. Physiological Monitoring in VR Experiments
VR experiments allow researchers to evaluate environmental restoration by incorporating physiological indicators, including eye tracking, galvanic skin response [28], heart rate (HR), and electroencephalography [30]. The biomonitoring sensors are well suited for laboratory settings and have been utilized in various experimental studies [31–33] to collect physiological indicators such as skin conductance level (SCL), HR, root mean square of successive differences (RMSSD), and low frequency/high frequency (LF/HF) ratio, among others. The correlation between physiological indicators and stress primarily involves responses from the autonomic nervous system when individuals encounter various stimuli and situations. The human autonomic nervous system encompasses the sympathetic and parasympathetic nervous systems, which regulate the body’s reactions to external stimuli [34–36]. Activation of the sympathetic nervous system occurs when individuals experience emotions such as stress, anxiety, or excitement, leading to an elevation in SCL, an acceleration of HR, a decrease in RMSSD, and an increase in LF/HF values [37].
1.7. Research Questions
Previous studies have primarily focused on environmental design elements that offer direct contact with nature, such as plants, water, natural materials, and natural light. However, there has been relatively less emphasis on design elements related to indirect contact with nature, such as abstract features, concrete features, and simulated dynamic natural changes. Research on the psychological effects of abstract and concrete features of indirect contact with nature is currently limited to theoretical and applied research, with empirical studies yet to yield significant conclusions. Furthermore, several studies on restorative environments have primarily focused on medical and office spaces and paid relatively little attention to high schools. Although the application of biophilic design in hospitals, workplaces, and university campuses has shown positive outcomes in combating mental fatigue and enhancing creativity, relaxation, and excitement by alleviating stress, similar research in high school environments is lacking. In this study, we focused on senior high school students to address these gaps in restorative environment research and explore the potential benefits of biophilic design in adolescent health, which could contribute to improving students’ mental health and cognitive states and thereby enhance the overall quality of high school education.
Classrooms and corridors are the primary indoor spaces where students study and relax. Due to design requirements, such as educational functionality, diversity, and sustainability, these environments can indirectly provide nature-inspired experiences to achieve restorative purposes. For classrooms, we hypothesized that biophilic forms offer stress reduction benefits by alleviating stress and enhancing attention. For corridors—spaces connecting indoor and outdoor environments that students use during class breaks for relaxation, divergent thinking, and imagination—we hypothesized that biophilic forms offer stress protection benefits and enhance students’ creativity. Stress reduction benefits in this context pertain to the decrease in exposure to the environment following sustained stress. Classroom environments with restorative benefits can alleviate the stress associated with learning. Stress protection benefits enhance individuals’ capacity to both adapt to challenges and mitigate their adverse effects. These benefits result in reduced stress elevation after individuals have been exposed to the environment for a period of time and represent a reverse process of stress reduction benefits.
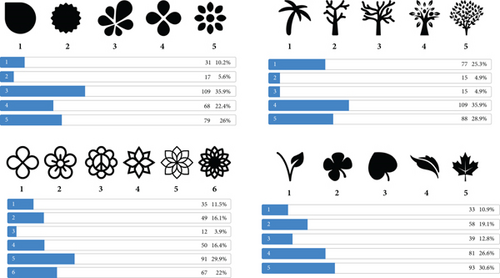
The forms encompass a variety of natural forms, such as graceful curves; tree-like structures; circular and elliptical forms, arches, columns, undulating lines, and dynamic patterns reminiscent of plant and animal contours; and biological structures. We selected four commonly used biophilic forms suitable for indoor learning environments—water droplets, branches, flowers, and leaves—further evolving their variations and densities to gauge students’ preferences for these natural shapes. An online questionnaire survey was conducted among 304 high school students in Shanghai that included questions such as “Please select your favorite form from the following images” (see Figure 1). The findings revealed that “No. 3 waterdrop-shaped curve” was the preferred curve form among students (35.9%), whereas “No. 4 branches with a moderate amount of leaves” emerged as the favored tree branch form (35.9%). Additionally, “No. 5 waterdrop-shaped petal” was the preferred petal form (29.9%), and “No. 5 maple leaf shape” was the favored leaf form (30.6%).
- •
Does a curved or biomimicry biophilic design corridor foster greater creativity among students compared to nonbiophilic design?
- •
Does a curved or biomimicry biophilic design corridor more effectively mitigate the escalation of academic stress among students compared to nonbiophilic design? (stress protection)
- •
Does a curved or biomimicry biophilic design classroom enhance attention spans among students to a greater extent compared to nonbiophilic design?
- •
Does a curved or biomimicry biophilic design classroom better alleviate stress levels among students compared to nonbiophilic design? (stress reduction)
2. Methodology
2.1. VR Experiment
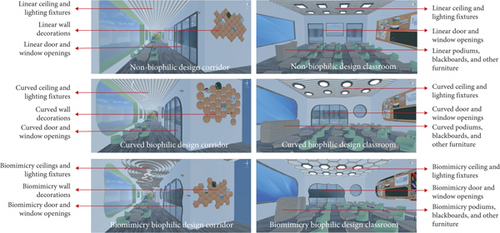
We utilized Rhino 7 software for modeling six experimental scenarios, followed by rendering in Unity software. Participants engaged with different virtual scenarios via VR headsets, and based on objective physiological indicators, cognitive assessments, and feedback from environmental scales, we concluded the environmental design(s) that offered superior restorative benefits. This experiment employed HTC VIVE VR headsets and the ErgoLAB BioSensor to monitor students’ physiological indicators (SCL, HR, RMSSD, and LF/HF) within virtual environments. The ErgoLAB BioSensor (Jinan Salked Information Technology Co. Ltd., ErgoLAB 2.0) features intelligent insertion detection technology, a unified data collector, and multisignal source acquisition lines, enabling data collection at a sampling frequency of up to 4096 Hz per channel. Its intelligent design, high precision, high sensitivity, and compact size have made it widely applicable in various experimental studies [31–33].
2.2. Cognitive Tests and Perceived Restorativeness Scale (PRS)
We used Guilford’s Alternative Uses Test (AUT) to examine students’ creative thinking levels [38] and the Stroop test for assessing attentional control (STROOP, 1991). To evaluate the perceived restoration potential of environments, participants completed the PRS after exposure to virtual environments.
The AUT is a psychological assessment tool used to gauge an individual’s divergent thinking capacity. In this experiment, participants were allotted 1 min in the VR environment to articulate as many unconventional uses for newspapers and plastic bags as possible. Two researchers documented the participants’ responses and independently assessed their creativity across four dimensions: fluency, flexibility, originality, and elaboration (with scores ranging from 1 to 5 for each dimension). To mitigate bias, the scores from both raters across the four dimensions were combined to yield a total creativity score. The discrepancy in creativity scores was computed as the creativity score postexposure to the corridor environment minus the creativity score pre-exposure, with a larger discrepancy signifying a more pronounced influence of the environment on creativity enhancement.
The Stroop test is a widely employed experimental paradigm for assessing cognitive abilities and attentional control. It entails a conflict between the color of words and the semantic meaning of the words, probing individuals’ attention and reaction time in processing information [39]. Participants undertook word-naming tasks (identifying the names of 27 fonts) and color-naming tasks (identifying the colors of 27 fonts) within the VR environment. Researchers recorded the time taken to complete each task, with a shorter duration indicative of enhanced capability to process conflicting information and superior executive function. The attentional time discrepancy was computed as the completion time of the second task (identifying colors) minus that of the first task (identifying color names), with a larger difference suggesting a more substantial impact of the environment on attention enhancement.
PRS is a widely recognized tool for evaluating individuals’ perceived restoration potential of environments [39], which has found extensive application in research on restorative environments [40]. Chinese scholars have conducted empirical studies on the reliability and validity of the Chinese version of the PRS, affirming its robustness in assessing restorativeness, with the scale items deemed representative and appropriate [41]. Tailored to the context and research inquiries of this study, we adapted and refined specific items and dimensions of the scale. The revised scale comprises 11 items that enable participants to evaluate the environmental attributes encountered during the VR experiment by assigning ratings ranging from 1 to 7.
2.3. Experiment Procedure
We carried out the experiment at a high school in Shanghai from September 8 to 20, 2023, in an effort to minimize variations in participants’ physical and mental states across different seasons or school terms. We first used GPower software to assist in calculating statistical power and sample size. Based on the statistical methods and analysis parameters, with α set to 0.05, f set to 0.25, and the power set to 0.95, the estimated required sample size is 44. A total of 96 students were recruited through teacher announcements in various classes and online notices posted by researchers to participate in the study. All participants volunteered and were randomly assigned experiment order. They arrived punctually at the laboratory, were briefed on the experimental procedure and instructions, and signed informed consent forms before the study commenced. Participants were advised to abstain from strenuous activities and caffeinated beverages and to ensure ample rest and regular sleep patterns.
The VR experiment consisted of four stages conducted in approximately 35 min: pre-experiment preparation, VR environment adaptation, formal experiment, and completion of postexperiment surveys. Before commencing the experiment, researchers adjusted the central air conditioning panel in the laboratory to maintain consistent physical environmental parameters, maintaining a temperature of 26°C, humidity at 50%, and an air change rate (ACH) of 6/h. This setup ensured a comfortable environment for participants, with consistent temperature, humidity, and stable CO₂ levels throughout the experiment. Upon arrival at the designated location for the virtual experiment, participants received a briefing from researchers on the general experimental process and instructions but no specific details about the experiment’s purpose. Following this, participants were required to sign an informed consent form. Researchers then assisted participants with wearing VR headsets and physiological sensors and initiating physiological data measurement after signal calibration, which persisted until the conclusion of the experiment.
Before the formal experiment, we conducted a pilot study. Based on participants’ responses during the pilot, we found that middle school students required 2 min to adapt to the VR environment. Any time beyond 2 min led to fatigue and a loss of interest in the experiment. Therefore, the VR environment adaptation stage, which lasted approximately 2 min, acquainted participants with the experimental equipment and the virtual environment, ensuring the comfortable positioning of VR headsets and optimized visual effects. It also guaranteed the normal recording and synchronization of physiological indicators. Participants were then instructed to verbally review the experiment’s instructions in the VR environment, which emphasized the importance of keeping sensor-wearing fingers still to prevent detachment and maintaining a seated position to avoid abrupt changes in physiological signals caused by movement. However, participants were permitted to freely rotate their seats to fully immerse themselves in the restorative environment.
The formal experiment comprised four stages: baseline measurement, exposure to the corridor environment, pressurization, and exposure to the classroom environment. Participants completed the entire experiment in the VR environment. Cognitive and pressurization tests were conducted in a single designated VR test model, a four-walled enclosed space where the test content was presented similarly to a PPT presentation. In contrast, exposure to the corridor and classroom environments occurred in six separate VR experimental models, which included the three classroom and three corridor scenes designed earlier. This approach allowed participants to focus solely on the test content, minimizing their impact on the cognitive and pressurization test results. Additionally, it enabled the independent assessment of the restorative benefits of each exposure environment. The experiment employed a combination of between- and within-subject design, which ensured that participants took part in the VR experiment only once and that they were randomly assigned to either the corridor or classroom environment for each session.
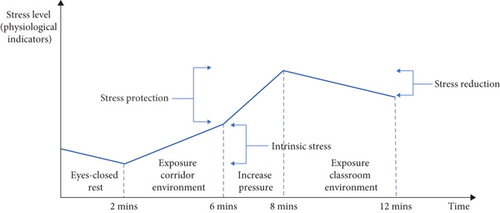
The experiment commenced with participants closing their eyes and relaxing for 2 min to establish baseline physiological indicators. Following this, the first AUT creativity test was administered, succeeded by a 4-min exposure to a randomly designated corridor environment. To ensure adequate restoration without inducing participant fatigue, the exposure duration in the VR environment was determined based on prior research on VR restorative environments [20, 28, 29]. After exposure to the corridor environment, participants underwent the second AUT creativity test. Subsequently, participants entered the pressurization stage, which comprised an English-speaking test and a mathematics addition and subtraction test that used numbers up to three digits. Participants were presented with two English-speaking test questions in the VR environment and were allowed 20 s to prepare and 50 s to respond to each question. Following this, participants were allotted 60 s to provide answers to the mathematics questions before the countdown ended in order to apply visual and auditory stress to the participants. Upon completion of the pressurization stage, participants underwent the first attention test, followed by the recovery phase of the experiment. Subsequently, participants were randomly assigned to a 4-min exposure to a designated classroom environment before undergoing the second attention test, which marked the conclusion of the VR experiment. The experimental procedure is depicted in Figure 3.

Upon completion of the virtual experience, researchers helped participants remove the experimental equipment. Participants subsequently completed an online survey, detailed in the appendix as the Post-VR School Environment Experience Survey. This survey collected demographic information, assessed generalized anxiety levels using the Generalized Anxiety Disorder (GAD) Scale, and gathered data on subjective environmental preferences as well as perceptions of restorative environments. Based on experience from previous research [20, 25, 26], we placed questionnaire responses outside the VR to ensure that participants could focus fully on their experience in the virtual environment rather than being distracted by answering questions. Additionally, to control the overall duration of the experiment and avoid potential discomfort from prolonged exposure to the VR environment, we opted to have participants complete the questionnaires outside of the virtual setting for greater convenience. Following thorough verification of all experimental procedures and participant responses for accuracy, the single experiment session was concluded. The experimental site is shown in Figure 4.

2.4. Data Analysis
- 1.
Intrinsic stress of the corridor environment: stress value during exposure to the corridor minus stress value during baseline.
- 2.
Stress protection benefit of the corridor environment: stress value during the stress induction period minus stress value during exposure to the corridor.
- 3.
Stress reduction benefit of the classroom environment: stress value during exposure to the classroom minus stress value during the stress induction period.
We then analyzed the remaining valid data following prior research practices. To ensure data integrity, we excluded any abnormal values that were three standard deviations from the mean, as accidental actions by subjects during the experiment could impact the results. Subsequently, paired sample t-tests were performed on the before-and-after indicator data for each stage to assess whether significant differences existed in the means of the two related measurement indicators before and after exposure. Additionally, a univariate analysis of variance (ANOVA) was employed on the difference values of the observed indicators before and after each stage to evaluate the significance of observed value differences. We did not apply the Bonferroni correction because our t-tests were based on distinct comparisons within a well-defined hypothesis, reducing the need for this stringent adjustment. Applying it could also lower statistical power and increase the risk of Type II errors. Instead, we focused on robust data collection and reported effect sizes (Cohen’s d) alongside p values to highlight the practical significance of our findings. We conducted comprehensive inference and analysis by integrating the results of the paired sample t-tests and ANOVA, along with the means and medians of each measurement indicator. The level of significance was set at 0.05 (two-sided). Data analysis was conducted using SPSS Version 26.0 (IBM SPSS, IBM Corp., Armonk, NY, United States).
3. Results
3.1. Participant Demographics
A total of 96 high school students, comprising 47 boys and 49 girls, participated in the VR experiment. The majority of participants were from the first and second grades of high school and accounted for 86.4% of the total, as shown in Table 1. The average scores for each item on the GAD-7 Scale were less than 3, with median scores of 2, indicating overall normal psychological health status among the participants.
| Characteristics | Frequency (n) | Percent (%) |
|---|---|---|
| Gender | ||
| Male | 47 | 49 |
| Female | 49 | 51 |
| Total | 96 | 100 |
| Grade | ||
| Preparatory class | 5 | 5.2 |
| First year (K10) | 32 | 33.3 |
| Second year (K11) | 51 | 53.1 |
| Third year (K12) | 8 | 8.3 |
| Total | 96 | 100 |
| GAD-7 Scale scores (1–4) | Median | Mean |
| Feeling nervous, anxious, or on edge | 2 | 2.47 |
| Unable to stop or control worrying | 2 | 2.12 |
| Worrying too much about different things | 2 | 2.42 |
| Having trouble relaxing | 2 | 2.19 |
| Being so restless that it is hard to sit still | 2 | 1.78 |
| Becoming easily annoyed or irritable | 2 | 2.38 |
| Feeling afraid something awful might happen | 2 | 1.98 |
3.2. Cognitive Tests
The boxplot of the differences in creativity scores before and after exposure to the corridor environment (ΔCreativity) indicates that all three corridor designs enhanced students’ creativity. However, the curved corridor showed the most significant improvement, followed by the biomimicry corridor. The nonbiophilic design corridor showed the smallest increase in creativity (Figure 6). Similarly, the differences in attention time before and after exposure to the classroom environment (ΔAttention) also demonstrate that the curved design classroom enhanced students’ attention to a greater extent, whereas the nonbiophilic design classroom led to the lowest increase in attention (Figure 7).
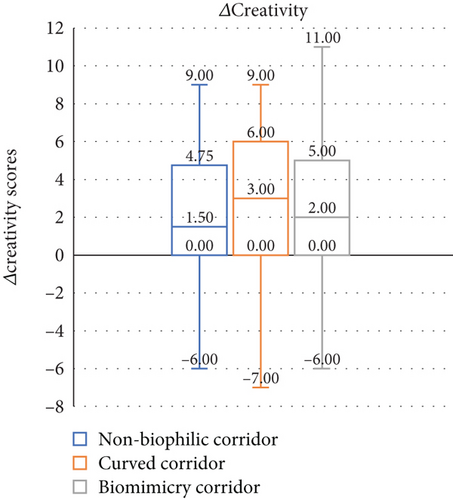
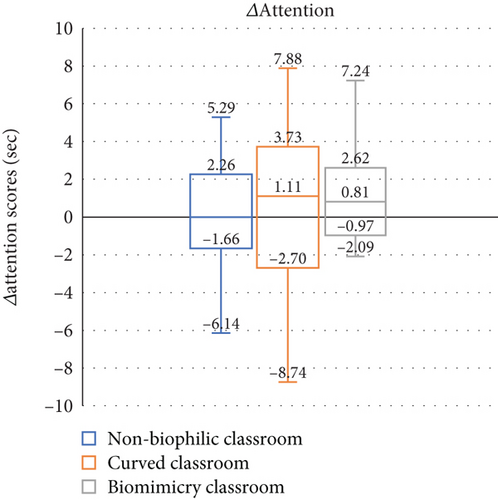
Paired sample t-tests were conducted to analyze the creativity scores, with all p values less than 0.05 indicating statistical significance (Table 2). This suggests that all three corridor environments enhanced students’ creativity. Regarding the attention time, paired sample t-tests yielded no statistical significance. Furthermore, ANOVA was performed on ΔCreativity and ΔAttention and yielded p values of 0.64 and 0.21, which suggests no statistical significance (Table 3).
| Cognitive test: Environment | N | Mean | Standard deviation |
Standard error |
95% confidence interval (lower, upper) |
t | Degrees of freedom |
Sig. (two-tailed) |
|
|---|---|---|---|---|---|---|---|---|---|
|
32 | −2.09 ∗∗ | 3.96 | 0.70 | −3.40 | −0.54 | −2.81 | 31 | 0.01 |
|
32 | −3.09 ∗∗ | 4.30 | 0.76 | −4.64 | −1.54 | −4.07 | 31 | < 0.01 |
|
32 | −2.72 ∗∗ | 4.52 | 0.80 | −4.35 | −1.09 | −3.41 | 31 | < 0.01 |
|
32 | 0.23 | 4.30 | 0.76 | −1.32 | 1.78 | 0.30 | 31 | 0.76 |
|
32 | 0.53 | 3.99 | 0.71 | −0.91 | 1.97 | 0.76 | 31 | 0.46 |
|
32 | 0.48 | 3.90 | 0.69 | −0.93 | 1.88 | 0.69 | 31 | 0.50 |
- ∗∗Significant at the 0.01 level.
| Variables | Sum of squares | df | Mean square | F | Sig. |
|---|---|---|---|---|---|
| Three corridors’ ΔCreativity | 16.33 | 2 | 8.17 | 0.44 | 0.64 |
| Three classrooms’ ΔAttention | 15.64 | 2 | 7.82 | 1.58 | 0.21 |
3.3. PRS Scores
The analysis of the PRS scores (Table 4) reveals all three types of design exhibited distinct inclinations toward orderliness, lack of clutter, and organized item arrangement. However, the biophilic design demonstrated significantly higher scores in multidimensional exploration, novelty, avoidance of boredom, and reduced need for task-oriented thinking. The curved design showed significant improvement in scores related to temporary relief from daily stress and distancing from matters requiring attention. In addition, biomimicry design showed a significant increase in scores related to greater attraction to interesting stimuli and distancing from transactional focus. Corridor and classroom with curved biophilic design scored highest for the item “I can temporarily set aside the pressure of daily life and study here.” Among all scoring criteria (total: 77), the curved biophilic corridor scored the highest (54.30), followed by the biomimicry corridor (53.21). The total score of curved classrooms (53.12) surpassed that of nonbiophilic and biomimicry classrooms.
| Scales (1–7 scores): Environment designs | Nonbiophilic design corridor | Curved biophilic design corridor | Biomimicry design corridor | Nonbiophilic design classroom | Curved biophilic design classroom | Biomimicry design classroom |
|---|---|---|---|---|---|---|
| This environment gives me a sense of novelty. | 4.33 | 5.33 | 5.12 | 4.39 | 4.82 | 4.39 |
| My attention is drawn to many interesting things here. | 4.03 | 4.36 | 4.61 | 4.12 | 4.67 | 4.30 |
| I do not feel bored here. | 4.48 | 4.91 | 4.91 | 4.09 | 4.48 | 4.30 |
| I can temporarily set aside the pressure of daily life and study here. | 3.91 | 4.58 | 4.21 | 3.79 | 4.33 | 3.82 |
| This place allows me to escape from things that require my attention, and I enjoy being in such places. | 3.94 | 4.27 | 4.55 | 4.06 | 4.09 | 3.85 |
| When I’m here, I do not have to think about things I have to do, and I like being in such places. | 4.15 | 4.64 | 4.52 | 3.91 | 4.15 | 3.88 |
| The items in this environment are organized and arranged. | 5.09 | 5.39 | 5.24 | 5.27 | 5.73 | 5.76 |
| The environment is not messy, and everything seems to have its proper place. | 5.03 | 5.88 | 5.39 | 5.27 | 5.61 | 5.79 |
| This environment has a clear sense of order. | 5.39 | 5.33 | 5.33 | 5.42 | 5.73 | 5.73 |
| I can explore multiple aspects of this environment. | 5.03 | 5.39 | 5.15 | 4.70 | 5.18 | 4.33 |
| I can do what I like here. | 4.00 | 4.21 | 4.18 | 3.82 | 4.33 | 3.79 |
| Total (scores) | 49.39 | 54.30 | 53.21 | 48.85 | 53.12 | 49.94 |
3.4. Intrinsic Stress of Corridor Environments
3.4.1. Description of Physiological Indicators for Intrinsic Stress
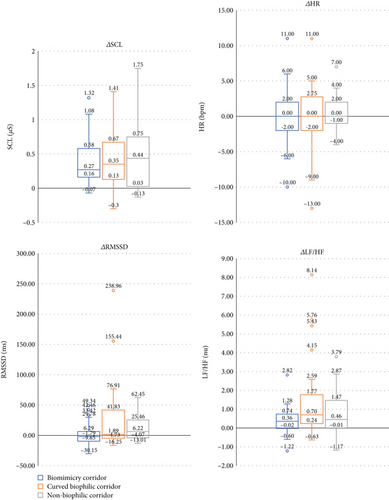
The mean ΔSCL results indicate the highest intrinsic stress levels in the nonbiophilic corridor, followed by the curved corridor, with the biomimicry corridor showing the lowest intrinsic stress. The mean ΔHR results also show the highest intrinsic stress in the nonbiophilic corridor, while the mean ΔHR and ΔRMSSD results reveal that the curved corridor exhibited the lowest intrinsic stress. However, the mean ΔLF/HF results show the opposite pattern (see Table 5 and Figure 8).
| Physiological indicators: Corridors | N | Minimum | Maximum | Mean | Std. error | Std. deviation | Variance |
|---|---|---|---|---|---|---|---|
| ΔSCL: Biomimicry corridor | 31.00 | −0.07 | 1.32 | 0.37 | 0.06 | 0.34 | 0.12 |
| ΔSCL: Curved biophilic corridor | 31.00 | −0.30 | 1.41 | 0.42 | 0.08 | 0.47 | 0.22 |
| ΔSCL: Nonbiophilic corridor | 32.00 | −0.13 | 1.75 | 0.47 | 0.08 | 0.48 | 0.23 |
| ΔHR: Biomimicry corridor | 32.00 | −10.00 | 11.00 | −0.06 | 0.68 | 3.85 | 14.84 |
| ΔHR: Curved biophilic corridor | 32.00 | −13.00 | 11.00 | −0.13 | 0.76 | 4.30 | 18.50 |
| ΔHR: Nonbiophilic corridor | 31.00 | −4.00 | 7.00 | 0.23 | 0.43 | 2.39 | 5.71 |
| ΔRMSSD: Biomimicry corridor | 31.00 | −30.15 | 49.34 | 1.51 | 3.58 | 19.94 | 397.62 |
| ΔRMSSD: Curved biophilic corridor | 31.00 | −16.25 | 238.96 | 25.53 | 9.79 | 54.50 | 2970.04 |
| ΔRMSSD: Nonbiophilic corridor | 32.00 | −13.01 | 62.45 | 13.17 | 3.97 | 22.48 | 505.13 |
| ΔLF/HF: Biomimicry corridor | 30.00 | −1.22 | 2.82 | 0.39 | 0.13 | 0.73 | 0.53 |
| ΔLF/HF: Curved biophilic corridor | 31.00 | −0.63 | 8.14 | 1.39 | 0.36 | 1.99 | 3.96 |
| ΔLF/HF: Nonbiophilic corridor | 32.00 | −1.17 | 3.79 | 0.71 | 0.19 | 1.10 | 1.20 |
3.4.2. t-Tests and ANOVA of Intrinsic Stress
The t-test analyses for SCL reveal that the biomimicry corridor (0.37) was lower than that of the curved corridor (0.42) and the nonbiophilic corridor (0.47), indicating higher intrinsic stress in nonbiophilic design (Table 6). The HR and RMSSD results also reveal that intrinsic stress in nonbiophilic design was greater than that in curved designs, although the t-test analysis of HR results was not significant. In addition, the ANOVA results for LF/HF and RMSSD were significant, and post hoc comparisons indicated that the intrinsic stress in the biomimicry design corridor was greater than that in the curved corridor (Tables 7 and 8). Based on the results of the t-tests and ANOVA, it can be inferred that the nonbiophilic design exhibits the highest intrinsic stress, followed by the biomimicry design, whereas the curved design has the lowest intrinsic stress levels.
| Physiological indicators: Corridors | Mean | Standard deviation |
Standard error |
95% confidence interval (lower, upper) |
t | Degrees of freedom |
Sig. | Cohen’s d | |
|---|---|---|---|---|---|---|---|---|---|
| (two-tailed) | |||||||||
| SCL: Biomimicry corridor | 0.37 ∗∗ | 0.34 | 0.06 | 0.24 | 0.49 | 6.01 | 30 | < 0.001 | 0.34 |
| SCL: Curved biophilic corridor | 0.42 ∗∗ | 0.47 | 0.08 | 0.25 | 0.6 | 5.06 | 30 | < 0.001 | 0.47 |
| SCL: Nonbiophilic corridor | 0.47 ∗∗ | 0.48 | 0.08 | 0.3 | 0.64 | 5.57 | 31 | < 0.001 | 0.48 |
| HR: Biomimicry corridor | −0.06 | 3.85 | 0.68 | −1.45 | 1.33 | −0.09 | 31 | 0.93 | 3.85 |
| HR: Curved biophilic corridor | −0.13 | 4.3 | 0.76 | −1.68 | 1.43 | −0.16 | 31 | 0.87 | 4.30 |
| HR: Nonbiophilic corridor | 0.23 | 2.39 | 0.43 | −0.65 | 1.1 | 0.53 | 30 | 0.6 | 2.39 |
| RMSSD: Biomimicry corridor | 1.51 | 19.94 | 3.58 | −5.8 | 8.83 | 0.42 | 30 | 0.68 | 19.94 |
| RMSSD: Curved biophilic corridor | 25.53 ∗∗ | 54.5 | 9.79 | 5.54 | 45.52 | 2.61 | 30 | 0.01 | 54.50 |
| RMSSD: Nonbiophilic corridor | 13.17 ∗∗ | 22.48 | 3.97 | 5.07 | 21.27 | 3.32 | 31 | < 0.01 | 22.48 |
| LF/HF: Biomimicry corridor | 0.39 ∗∗ | 0.73 | 0.13 | 0.12 | 0.66 | 2.93 | 29 | 0.01 | 0.73 |
| LF/HF: Curved biophilic corridor | 1.39 ∗∗ | 1.99 | 0.36 | 0.66 | 2.12 | 3.89 | 30 | < 0.01 | 1.99 |
| LF/HF: Nonbiophilic corridor | 0.71 ∗∗ | 1.1 | 0.19 | 0.31 | 1.1 | 3.66 | 31 | < 0.001 | 1.10 |
- ∗∗Significant at the 0.01 level.
| Variables | Sum of squares | df | Mean square | F | Sig. |
|---|---|---|---|---|---|
| SCL | 0.17 | 2 | 0.08 | 0.44 | 0.65 |
| HR | 2.2 | 2 | 1.1 | 0.08 | 0.92 |
| RMSSD | 8944.99 ∗ | 2 | 4472.5 | 3.49 | 0.04 |
| LF/HF | 16.02 ∗ | 2 | 8.01 | 4.21 | 0.02 |
- ∗Significant at the 0.05 level.
| Physiological indicators | Corridor design | Corridor design | Mean difference | Standard error | Sig. (two-tailed) | 95% confidence interval (lower, upper) | |
|---|---|---|---|---|---|---|---|
| LF/HF | Nonbiophilic corridor | Curved biophilic corridor | −0.68 | 0.41 | 0.27 | −1.69 | 0.32 |
| Biomimicry corridor | 0.32 | 0.24 | 0.45 | −0.26 | 0.90 | ||
| Curved biophilic corridor | Nonbiophilic corridor | 0.68 | 0.41 | 0.27 | −0.32 | 1.69 | |
| Biomimicry corridor | 1.00 ∗ | 0.38 | 0.04 | 0.05 | 1.95 | ||
| Biomimicry corridor | Nonbiophilic corridor | −0.32 | 0.24 | 0.45 | −0.90 | 0.26 | |
| Curved biophilic corridor | −1.00 ∗ | 0.38 | 0.04 | −1.95 | −0.05 | ||
| RMSSD | Nonbiophilic corridor | Curved biophilic corridor | −12.36 | 10.56 | 0.57 | −38.65 | 13.93 |
| Biomimicry corridor | 11.66 | 5.35 | 0.10 | −1.46 | 24.78 | ||
| Curved biophilic corridor | Nonbiophilic corridor | 12.36 | 10.56 | 0.57 | −13.93 | 38.65 | |
| Biomimicry corridor | 24.02 | 10.42 | 0.08 | −1.97 | 50.01 | ||
| Biomimicry corridor | Nonbiophilic corridor | −11.66 | 5.35 | 0.10 | −24.78 | 1.46 | |
| Curved biophilic corridor | −24.02 | 10.42 | 0.08 | −50.01 | 1.97 | ||
- ∗Significant at the 0.05 level.
3.5. Stress Protection of Corridor Environments
3.5.1. Description of Physiological Indicators for Stress Protection
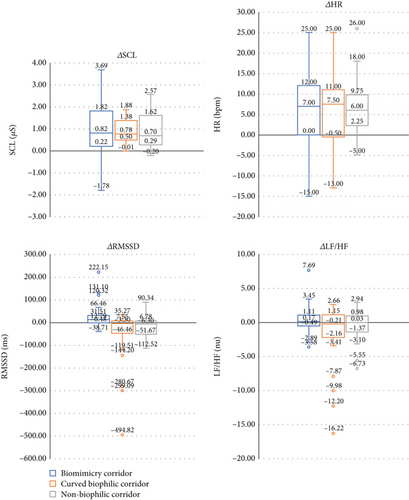
The mean ΔSCL results indicate that the curved corridor provides the most effective stress protection benefits, followed by the nonbiophilic corridor, with the biomimicry corridor offering the least, which aligns with the ΔLF/HF results. The mean ΔHR results show that the biomimicry corridor provides the greatest stress protection benefits, followed by the nonbiophilic corridor, while the curved corridor offers the least. The mean ΔRMSSD results suggest that the biomimicry corridor offers the most effective stress protection, followed by the nonbiophilic design, with the curved design offering the least (see Table 9 and Figure 9).
| Physiological indicators: Corridors | N | Minimum | Maximum | Mean | Std. error | Std. deviation | Variance |
|---|---|---|---|---|---|---|---|
| ΔSCL: Biomimicry corridor | 32.00 | −1.78 | 3.69 | 0.98 | 0.18 | 1.02 | 1.04 |
| ΔSCL: Curved biophilic corridor | 31.00 | −0.01 | 1.88 | 0.90 | 0.11 | 0.58 | 0.34 |
| ΔSCL: Nonbiophilic corridor | 32.00 | −0.20 | 2.57 | 0.92 | 0.14 | 0.81 | 0.66 |
| ΔHR: Biomimicry corridor | 32.00 | −15.00 | 25.00 | 6.16 | 1.46 | 8.24 | 67.94 |
| ΔHR: Curved biophilic corridor | 32.00 | −13.00 | 25.00 | 6.53 | 1.43 | 8.12 | 65.87 |
| ΔHR: Nonbiophilic corridor | 32.00 | −5.00 | 26.00 | 6.47 | 1.16 | 6.54 | 42.77 |
| ΔRMSSD: Biomimicry corridor | 31.00 | −38.71 | 222.15 | 25.20 | 9.29 | 51.73 | 2675.64 |
| ΔRMSSD: Curved biophilic corridor | 31.00 | −494.82 | 35.27 | −46.67 | 20.76 | 115.58 | 13358.99 |
| ΔRMSSD: Nonbiophilic corridor | 32.00 | −112.52 | 90.34 | −14.40 | 8.13 | 45.98 | 2113.76 |
| ΔLF/HF: Biomimicry corridor | 32.00 | −12.34 | 7.69 | 0.00 | 0.53 | 3.00 | 9.01 |
| ΔLF/HF: Curved biophilic corridor | 31.00 | −16.22 | 2.66 | −1.50 | 0.79 | 4.37 | 19.12 |
| ΔLF/HF: Nonbiophilic corridor | 32.00 | −6.73 | 2.94 | −0.43 | 0.37 | 2.09 | 4.37 |
3.5.2. t-Tests and ANOVA of Stress Protection
The t-test of SCL for all three corridors was significant, with the mean for the nonbiophilic design (1.40) lower than that for the biomimicry design (1.42) and curved design (1.44). The results for HR indicated that the curved biophilic corridor had higher values than both the nonbiophilic and biomimicry corridors (Table 10). The ANOVA results indicate that ΔRMSSD was significant (Table 11). Post hoc comparisons revealed that the stress protection benefits in the nonbiophilic and curved corridors were greater than those in the biomimicry corridor (Table 12). Based on these results, it can be inferred that the nonbiophilic design offers the greatest stress protection benefits, followed by the biomimicry design, whereas the curved design offers the fewest stress protection benefits.
| Physiological indicator: Corridor | Mean | Standard deviation |
Standard error |
95% confidence interval (lower, upper) |
t | Degrees of freedom |
Sig. (two-tailed) |
Cohen’s d | |
|---|---|---|---|---|---|---|---|---|---|
| SCL: Biomimicry corridor | 1.42 ∗∗ | 0.85 | 0.15 | 1.72 | 1.11 | 9.42 | 31 | < 0.001 | 0.76 |
| SCL: Curved biophilic corridor | 1.44 ∗∗ | 1.08 | 0.19 | 1.04 | 1.83 | 7.37 | 30 | < 0.001 | 0.57 |
| SCL: Nonbiophilic corridor | 1.40 ∗∗ | 0.88 | 0.15 | 1.71 | 1.08 | 9.01 | 31 | < 0.001 | 0.88 |
| HR: Biomimicry corridor | 6.09 ∗∗ | 6.54 | 1.16 | 3.74 | 8.45 | 5.27 | 31 | < 0.001 | 6.54 |
| HR: Curved biophilic corridor | 6.41 ∗∗ | 6.18 | 1.09 | 4.18 | 8.63 | 5.87 | 31 | < 0.001 | 6.18 |
| HR: Nonbiophilic corridor | 6.31 ∗∗ | 4.68 | 0.83 | 4.63 | 8 | 7.63 | 31 | < 0.001 | 4.54 |
| RMSSD: Biomimicry corridor | 26.71 ∗∗ | 47.26 | 8.49 | 9.37 | 44.04 | 3.15 | 30 | 0.00 | 36.57 |
| RMSSD: Curved biophilic corridor | −21.14 | 67.44 | 12.11 | −45.88 | 3.6 | −1.75 | 30 | 0.09 | 67.44 |
| RMSSD: Nonbiophilic corridor | −1.23 | 32.48 | 5.74 | −12.94 | 10.48 | −0.21 | 31 | 0.83 | 32.48 |
| LF/HF: Biomimicry corridor | 0.55 ∗∗ | 1.16 | 0.21 | 0.12 | 0.97 | 2.63 | 30 | 0.01 | 1.16 |
| LF/HF: Curved biophilic corridor | −0.11 | 2.56 | 0.46 | −1.05 | 0.82 | −0.25 | 30 | 0.81 | 2.56 |
| LF/HF: Nonbiophilic corridor | 0.28 | 1.3 | 0.23 | −0.19 | 0.74 | 1.2 | 31 | 0.24 | 1.3 |
- ∗∗Significant at the 0.01 level.
| Variables | Sum of squares | df | Mean square | F | Sig. |
|---|---|---|---|---|---|
| SCL | 0.1 | 2 | 0.05 | 0.07 | 0.93 |
| HR | 2.58 | 2 | 1.29 | 0.02 | 0.98 |
| RMSSD | 80337.78 ∗∗ | 2 | 40168.89 | 6.69 | < 0.01 |
| LF/HF | 56.31 | 2 | 28.15 | 3.08 | 0.05 |
- ∗∗Significant at the 0.01 level.
| Corridor design | Corridor design | Mean difference | Standard error | Sig. (two-tailed) | 95% confidence interval (lower, upper) | |
|---|---|---|---|---|---|---|
| Nonbiophilic corridor | Curved biophilic corridor | 32.27 | 22.29 | 0.39 | −23.24 | 87.79 |
| Biomimicry corridor | −39.59 ∗∗ | 12.34 | 0.01 | −69.89 | −9.30 | |
| Curved biophilic corridor | Nonbiophilic corridor | −32.27 | 22.29 | 0.39 | −87.79 | 23.24 |
| Biomimicry corridor | −71.87 ∗∗ | 22.74 | 0.01 | −128.35 | −15.38 | |
| Biomimicry corridor | Nonbiophilic corridor | 39.59 ∗∗ | 12.34 | 0.01 | 9.30 | 69.89 |
| Curved biophilic corridor | 71.87 ∗∗ | 22.74 | 0.01 | 15.38 | 128.35 | |
- ∗∗Significant at the 0.01 level.
3.6. Stress Reduction of Classroom Environments
3.6.1. Description of Physiological Indicators for Stress Reduction
The mean ΔSCL results indicate that both biomimicry and curved classrooms provide similar stress reduction benefits, while the nonbiophilic classroom offers the least. The mean ΔHR and ΔRMSSD results show that the biomimicry classroom delivers the most significant stress reduction benefits, followed by the nonbiophilic classroom, with the curved classroom offering the fewest. For mean ΔLF/HF, the results demonstrate that the curved design provides the greatest stress reduction benefits, followed by the nonbiophilic design, with the biomimicry classroom offering the least (see Table 13 and Figure 10).
| Physiological indicator: Classrooms | N | Minimum | Maximum | Mean | Std. error | Std. deviation | Variance |
|---|---|---|---|---|---|---|---|
| SCL: Biomimicry classroom | 31 | −1.54 | 4.06 | 1.47 | 0.22 | 1.24 | 1.53 |
| SCL: Curved biophilic classroom | 31 | −0.08 | 3.21 | 1.47 | 0.17 | 0.96 | 0.92 |
| SCL: Nonbiophilic classroom | 32 | −0.12 | 4.53 | 1.61 | 0.24 | 1.35 | 1.83 |
| HR: Biomimicry classroom | 32 | −16 | 48 | 11.88 | 2.35 | 13.31 | 177.27 |
| HR: Curved biophilic classroom | 32 | −9 | 47 | 13.28 | 2.37 | 13.4 | 179.43 |
| HR: Nonbiophilic classroom | 32 | −6 | 39 | 12.94 | 1.94 | 10.99 | 120.84 |
| RMSSD: Biomimicry classroom | 30 | −112.57 | 244.58 | 31 | 14.68 | 80.4 | 6463.69 |
| RMSSD: Curved biophilic classroom | 31 | −630.14 | 129.15 | −57.19 | 26.27 | 146.29 | 21400.75 |
| RMSSD: Nonbiophilic classroom | 32 | −147.33 | 187.96 | −14.42 | 13.7 | 77.5 | 6006.6 |
| LF/HF: Biomimicry classroom | 31 | −4.13 | 7.07 | 0.7 | 0.44 | 2.43 | 5.91 |
| LF/HF: Curved biophilic classroom | 31 | −16.96 | 8.47 | −1.26 | 0.95 | 5.27 | 27.73 |
| LF/HF: Nonbiophilic classroom | 32 | −7.44 | 4.64 | −0.49 | 0.53 | 3.01 | 9.08 |
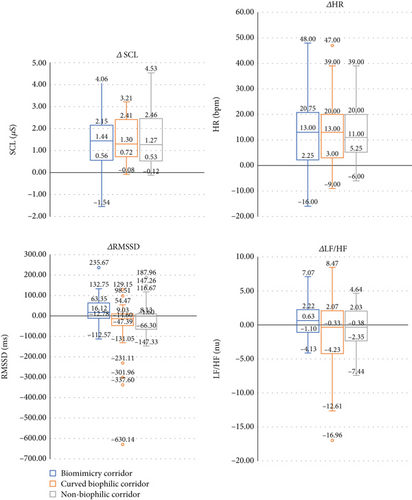
3.6.2. t-Tests and ANOVA of Stress Reduction
The t-tests of SCL were significant, with the mean for the curved classroom (0.56) less than that for the biomimicry classroom (0.57) and the nonbiophilic classroom (0.69). The results for HR indicated that the curved biophilic classroom had higher values than both the nonbiophilic and biomimicry classrooms (Table 14). The ANOVA results indicate that ΔRMSSD was significant (Table 15). Post hoc comparisons reveal that the curved classroom offers greater stress reduction benefits compared to the biomimicry classroom (Table 16). Based on the results, it can be inferred that the curved classroom offers the greatest stress reduction benefits, followed by the biomimicry classroom, whereas the nonbiophilic classroom offers the fewest stress reduction benefits.
| Physiological indicator: Classrooms | Mean | Standard deviation |
Standard error |
95% confidence interval (lower, upper) |
t | Degrees of freedom |
Sig. (two-tailed) |
Cohen’s d | |
|---|---|---|---|---|---|---|---|---|---|
| SCL: Biomimicry classroom | 0.57 ∗∗ | 0.54 | 0.1 | 0.37 | 0.77 | 5.87 | 30 | < 0.001 | 0.54 |
| SCL: Curved biophilic classroom | 0.56 ∗∗ | 0.47 | 0.08 | 0.39 | 0.73 | 6.73 | 30 | < 0.001 | 0.47 |
| SCL: Nonbiophilic classroom | 0.69 ∗∗ | 0.64 | 0.11 | 0.46 | 0.92 | 6.11 | 31 | < 0.001 | 0.64 |
| HR: Biomimicry classroom | 5.72 ∗∗ | 6.13 | 1.08 | 7.93 | 3.51 | 5.28 | 31 | < 0.001 | 6.13 |
| HR: Curved biophilic classroom | 6.75 ∗∗ | 6.1 | 1.08 | 8.95 | 4.55 | 6.26 | 31 | < 0.001 | 6.1 |
| HR: Nonbiophilic classroom | 6.47 ∗∗ | 5.51 | 0.97 | 8.45 | 4.48 | 6.65 | 31 | < 0.001 | 5.51 |
| RMSSD: Biomimicry classroom | −12.37 | 51.54 | 9.41 | −31.61 | 6.88 | −1.31 | 29 | 0.2 | 51.54 |
| RMSSD: Curved biophilic classroom | 10.52 | 46.71 | 8.39 | −6.62 | 27.65 | 1.25 | 30 | 0.22 | 46.71 |
| RMSSD: Nonbiophilic classroom | 0.02 | 38.94 | 6.88 | −14.02 | 14.06 | 0 | 31 | 1 | 38.94 |
| LF/HF: Biomimicry classroom | −0.31 | 1.32 | 0.24 | −0.79 | 0.18 | −1.29 | 30 | 0.21 | 1.32 |
| LF/HF: Curved biophilic classroom | −0.25 | 2 | 0.36 | −0.98 | 0.49 | −0.69 | 30 | 0.49 | 2 |
| LF/HF: Nonbiophilic classroom | 0.06 | 1.4 | 0.25 | −0.45 | 0.56 | 0.23 | 31 | 0.82 | 1.4 |
- ∗∗Significant at the 0.01 level.
| Variables | Sum of squares | df | Mean square | F | Sig. |
|---|---|---|---|---|---|
| SCL | 0.46 | 2 | 0.23 | 0.16 | 0.85 |
| HR | 34.4 | 2 | 17.2 | 0.11 | 0.9 |
| RMSSD | 118570.59 | 2 | 59285.29 ∗∗ | 5.25 | 0.01 |
| LF/HF | 60.32 | 2 | 30.16 | 2.13 | 0.13 |
- ∗∗Significant at the 0.01 level.
| Classroom design | Classroom design | Mean difference | Standard error | Sig. (two-tailed) | 95% confidence interval (lower, upper) | |
|---|---|---|---|---|---|---|
| Nonbiophilic classroom | Curved biophilic classroom | 42.77 | 29.63 | 0.39 | −30.59 | 116.13 |
| Biomimicry classroom | −45.41 | 20.08 | 0.08 | −94.69 | 3.87 | |
| Curved biophilic classroom | Nonbiophilic classroom | −42.77 | 29.63 | 0.39 | −116.13 | 30.59 |
| Biomimicry classroom | −88.19 ∗ | 30.10 | 0.02 | −162.60 | −13.77 | |
| Biomimicry classroom | Nonbiophilic classroom | 45.41 | 20.08 | 0.08 | −3.87 | 94.69 |
| Curved biophilic classroom | 88.19 ∗ | 30.10 | 0.02 | 13.77 | 162.60 | |
- ∗Significant at the 0.05 level.
3.7. Subjective Questionnaire
3.7.1. Subjective Perception of Stress
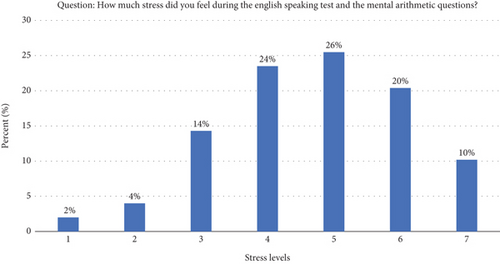
Participants reported an average stress level of 4.7 (on a Likert scale of 1–7) after stress introduction (i.e., English oral tests and math mental arithmetic tasks). More than 56.1% experienced stress levels of 5 or greater, which supports the observed increase in physiological stress indicators during pressurization (Figure 11).
3.7.2. Subjective Perception of Relaxation and Design Preferences
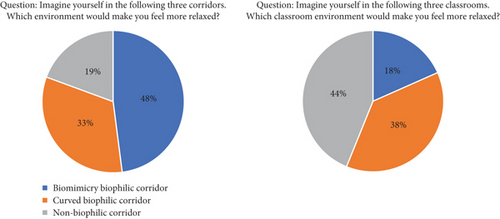
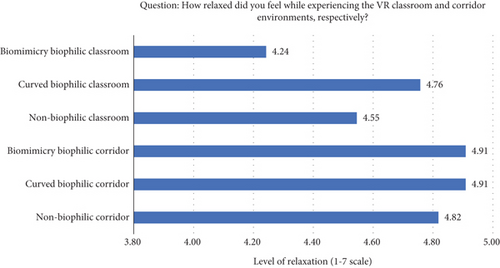
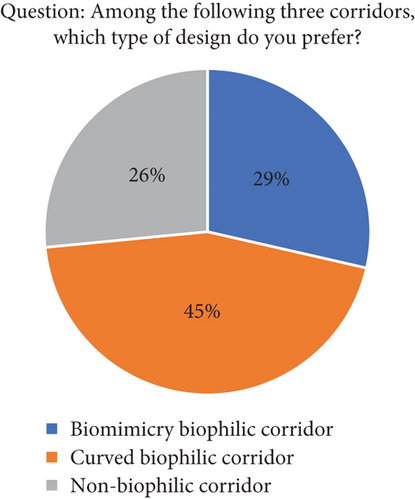
Participants reported feeling more relaxed in the biomimicry corridor (48%), followed by the curved corridor (33%) and the nonbiophilic design corridor (19%) (see Figure 12). Participants reported feeling more relaxed in the curved classroom (44%), followed by the biomimicry classroom (38%) and nonbiophilic classroom (18%). Additionally, the average score of relaxation for the three corridors (4.9) was higher than that for the three classrooms (4.53), and the curved corridor (4.91), biomimicry corridor (4.91), and curved classroom (4.76) received the highest subjective ratings, specifically (Figure 13). For design preferences (Figure 14), the curved corridor had the highest subjective preference rate (45%), whereas the nonbiophilic corridor had the lowest subjective preference rate (26%).
3.7.3. Subjective Questionnaire Responses
Upon cross-analysis, we noticed that participants generally preferred the environments they were actually in VR environments (Table 17). For example, those who were in VR nonbiophilic classrooms often said they felt more relaxed. We saw similar trends with the curved classrooms and biomimicry corridors. This suggests that relying solely on subjective analysis to compare the restorative effects of different environments may not be fully conclusive. Therefore, it is comprehensive to consider objective measures such as physiological indicators to obtain a more thorough understanding.
| Subquestion: What VR environment did you just experience? | Question: Imagine yourself in the following three corridors, which environment would make you feel more relaxed? | ||
|---|---|---|---|
| Biomimicry corridor | Curved corridor | Nonbiophilic corridor | |
| Nonbiophilic corridor | 32.40% | 29.30% | 44.40% |
| Curved corridor | 32.40% | 41.50% | 22.20% |
| Biomimicry corridor | 35.10% | 29.30% | 38.90% |
| Biomimicry classroom | Curved classroom | Nonbiophilic classroom | |
| Nonbiophilic classroom | 34.80% | 21.90% | 50.00% |
| Curved classroom | 23.90% | 53.10% | 27.80% |
| Biomimicry classroom | 43.50% | 25.00% | 22.20% |
4. Discussion
4.1. Benefits of Curved Biophilic Design on Creativity and Attention
The research findings indicate that curved biophilic designs significantly enhance students’ creativity and attention in both corridor and classroom settings. This underscores the impact of indirect contact with natural elements on the cognitive function of high school students. In comparison with previous research findings on the impact of direct contact with natural elements on creativity and attention [28, 42–45], our study further validates the cognitive restorative benefits through indirect contact with biophilic design. Results from Jung, D. Kim, and N. Kim [16] further support this notion that biophilic design elements induce changes in brain functionality in the frontal lobe region, with significant alterations in emotions and brain waves. Additionally, our study partially extends the findings of Felsten [46], who pointed out that indirect contact with nature through natural murals may also restore attention fatigue. Notably, we found that designs with smaller curvature amplitudes exhibit superior cognitive restorative benefits compared to biomimicry designs. This aligns with the findings of Palumbo et al., who found that smooth curved objects evoke pleasure and are often more preferred than angular objects [47].
4.2. Intrinsic Stress and Stress Protection Benefits of Biophilic Environments
In the stress protection stage, we observed that both biomimicry and curved corridors exhibit lower intrinsic stress compared to nonbiophilic corridors. However, we found that nonbiophilic corridors outperform biomimicry and curved corridors in providing stress protection benefits. This suggests an inverse relationship between the intrinsic stress of biophilic designs and their stress protection benefits, wherein environments with higher intrinsic stress possess stronger stress protection benefits. Conversely, environments with lower intrinsic stress demonstrate weaker stress protection benefits. This phenomenon could be explained by the theory of moderate arousal, which posits an inverted U-shaped relationship between arousal or stress and performance. In simpler terms, moderate levels of stress can enhance performance, but too much or too little stress can lead to decreased performance [48–51]. In other words, when individuals are already in a high-stress environment, adding further stress may not significantly increase stress levels, as they are already operating at a heightened level of arousal. Conversely, in a low-stress environment, adding further stress can lead to a significant increase in stress levels, as the individuals are starting from a lower level of arousal. Therefore, individuals may face moderate stress in nonbiophilic environments, which leads to increased levels of motivation and performance.
4.3. Stress Protection and Stress Reduction Benefits of Biophilic Environments
In the stress reduction stage, we found that the curved classroom exhibits significantly greater stress reduction benefits compared to nonbiophilic and biomimicry classrooms. Further comparisons reveal that the curved design outperforms biomimicry design in stress reduction benefits. This aligns with earlier research findings that demonstrate that curvature has positive psychological and physiological effects on humans [52, 53] and that curved spaces activate areas associated with pleasure and reward [54]. Features with curved characteristics in space, furniture, and objects receive more positive evaluations in terms of preference [55], pleasure [56], attractiveness [57], beauty [58], safety [59], and stress response [58, 59]. Additionally, we found an inverse relationship between stress protection benefits and stress reduction benefits of the environment. In other words, environments with lesser stress protection benefits exhibit better stress reduction effects, and vice versa. Therefore, nonbiophilic environments are more suitable for stress-inducing tasks, such as exams and classes, whereas curved biophilic environments are more suitable for stress-relieving activities.
4.4. Restorative Characteristics and Preference for Biophilic Environments
According to the analysis of the PRS questionnaire and scores on various environmental dimensions, environments with higher scores in attractiveness and escapism exhibit better restoration. This suggests that the attractiveness of learning environments and features that provide an escape from daily pressures are crucial for the psychological restoration of high school students. This finding supports the research conclusions of Soliman, Moustafa, and Fahmy [60], who found that subjective perceptions of stress reduction are significantly correlated with attractiveness and escapism, in addition to the orderliness and focus of design features. Furthermore, we found that high school students who engage more frequently in biophilic activities demonstrate a stronger preference for biophilic perceptual forms; thus, the frequency of outdoor biophilic activities may be related to biophilic perceptions. This finding is consistent with Berto et al.’s [61] research, which found that the degree of individuals’ connection with nature may influence their perception of natural environments, thereby affecting preferences for restorative environments.
4.5. Limitations
Our study faces several limitations. First, the shape selection was based on the geometric morphology of the design experience to facilitate a more intuitive quantification of preferences. Future research could enhance this approach by incorporating participants’ subjective choices into the questionnaire design. Second, due to the limited time available for each participant, we did not administer the Slater–Usoh–Steed, Igroup Presence Questionnaires (IPQ), and the Virtual Reality Sickness Questionnaire (VRSQ) to assess VR immersion and cybersickness at the end of the experiment. Future studies should incorporate these evaluations to ensure that feedback from each participant is fully valid and comprehensive. Third, there may be a learning effect when participants undergo cognitive tests for the second time, potentially affecting the accuracy of enhancements observed in attention and creativity tests. Additionally, although VR experiments visually approximate real-world scenes, the absence of real-world activities and human interaction means that our conclusions cannot fully account for nonvisual factors in the environment. These limitations necessitate further consideration in future research endeavors.
5. Conclusions
In this randomized experiment with 96 participants, we validate that learning environments incorporating biophilic elements are more restorative compared to those that lack such features and that curved biophilic designs demonstrate superior cognitive and stress reduction benefits over nonbiophilic and biomimicry forms. Additionally, we observe that nonbiophilic designs offer significantly greater stress protection benefits compared to other designs. This suggests that nonbiophilic environments are conducive to stress-inducing tasks, whereas environments that feature curved biophilic designs are more conducive to leisure activities aimed at relaxation. Our findings offer valuable insights for architects, designers, and school managers; highlight the impact of biophilic designs on students’ stress levels and cognitive performance; and provide approaches for helping high school students alleviate daily pressures.
Conflicts of Interest
The authors declare no conflicts of interest.
Author Contributions
Li Mengqi and Yin Jie are co-first authors.
Funding
This work was supported by the National Natural Science Foundation of China (Nos. 52378073 and 51778422), the Fundamental Research Funds for Central Universities (No. 22120240378), and the Kingfar-CES “Human Factors and Ergonomics” Program (No. 230805329314629).
Acknowledgments
The authors appreciate the help from students and teachers of Tongji-Huangpu School of Design and Innovation, Shanghai. We also sincerely thank the reviewers and editors for their valuable comments and suggestions, which greatly contributed to the improvement of this work.
Appendix A: Appendix With Post-VR School Environment Experience Survey
Q1. Your Gender
- Male
- Female
Q2. Your Grade Level
- Grade 7
- Grade 8
- Grade 9
- Grade 10
- Grade 11
- Grade 12
Q3. Which VR environment did you just experience? [Multiple Choice/only two]
- Nonbiophilic classroom
- Curved biophilic classroom
- Biomimicry classroom
- Nonbiophilic corridor
- Curved biophilic corridor
- Biomimicry corridor
Q4. Over the past two weeks, how often have you been bothered by the following problems? [Matrix Scale]
1. Not at all 2. Several days 3. More than half the days 4. Nearly every day
- Feeling nervous, anxious, or on edge ______
- Not being able to stop or control worrying ______
- Worrying too much about different things ______
- Having difficulty relaxing ______
- Being so restless that it is hard to sit still ______
- Becoming easily annoyed or irritable ______
- Feeling afraid as if something awful might happen ______
Q5. How much stress did you feel during the English speaking test and mental math? [Matrix Scale]
1 = No stress at all, 7 = Very stressed. A lower score indicates lower stress.
- Your score is: _____________
Q6. How relaxed did you feel in the classroom and corridor environments in the VR experience? [Matrix Scale]
1 = Not relaxed at all, 7 = Very relaxed.
- Your relaxation level in the corridor environment: __________
- Your relaxation level in the classroom environment: __________
Q7. Please evaluate the corridor environment you just experienced in VR [Matrix Scale]
1 = Strongly disagree, 7 = Strongly agree
- This environment feels fresh. ______
- My attention was drawn to many interesting things. ______
- This place does not feel boring. ______
- I can temporarily let go of the pressures of daily life and school in this place. ______
- This is a place where I can distance myself from things that need my attention. I like to come to places like this. ______
- When I′m here, I do not need to think about tasks I have to complete. I enjoy coming to places like this. ______
- The objects in this environment are organized. ______
- This environment is not messy; everything seems to have its proper place. ______
- This environment has a clear sense of order. ______
- This environment can be explored in multiple ways. ______
- I can do what I like in this environment. ______
Q8. Please evaluate the classroom environment you just experienced in VR [Matrix Scale]
1 = Strongly disagree, 7 = Strongly agree
- This environment feels fresh. ______
- My attention was drawn to many interesting things. ______
- This place does not feel boring. ______
- I can temporarily let go of the pressures of daily life and school in this place. ______
- This is a place where I can distance myself from things that need my attention. I like to come to places like this. ______
- When I′m here, I do not need to think about tasks I have to complete. I enjoy coming to places like this. ______
- The objects in this environment are organized. ______
- This environment is not messy; everything seems to have its proper place. ______
- This environment has a clear sense of order. ______
- This environment can be explored in multiple ways. ______
- I can do what I like in this environment. ______
Q9. Compare the psychological feelings between the corridor and classroom environments in the VR experience [Single Choice]
- The corridor environment made me feel more relaxed than the classroom environment.
- The classroom environment made me feel more relaxed than the corridor environment.
- Both the corridor and classroom environments made me feel equally relaxed.
- Neither the corridor nor the classroom environments made me feel relaxed.
Q10. Imagine you are in the following corridors, which environment would make you feel the most relaxed? [Single Choice]
- Biomimicry corridor
- Nonbiophilic corridor
- Curved biophilic corridor
Q11. Imagine you are in the following classrooms, which environment would make you feel the most relaxed? [Single Choice]
- Nonbiophilic classroom
- Biomimicry classroom
- Curved biophilic classroom
Q12. Which design approach do you prefer for the following corridors? [Single Choice]
- Biomimicry corridor
- Curved biophilic corridor
- Nonbiophilic corridor
Q13. In the past month, how often did you go outside and connect with nature? [Single Choice]
- Almost every day
- 2-3 times a week
- Once a week
- 2-3 times a month
- Once a month
- Never
Open Research
Data Availability Statement
The data supporting this study are available from the corresponding author upon reasonable request.


